Inspect
editInspect
editThe Inspect view in Kibana allows you to view information about all requests that were made to collect the data displayed on the current page.
Many requests go into building visualizations in Kibana. For example, to render visualizations in the Uptime app, Kibana needs to request a list of all your monitors, data about the availability of each monitor over time, and more. If something goes wrong, the Inspect view can help you report an issue and troubleshoot with Elastic support.
Inspecting requests is available for the following apps:
- APM
- Uptime
- User Experience
Enable inspect
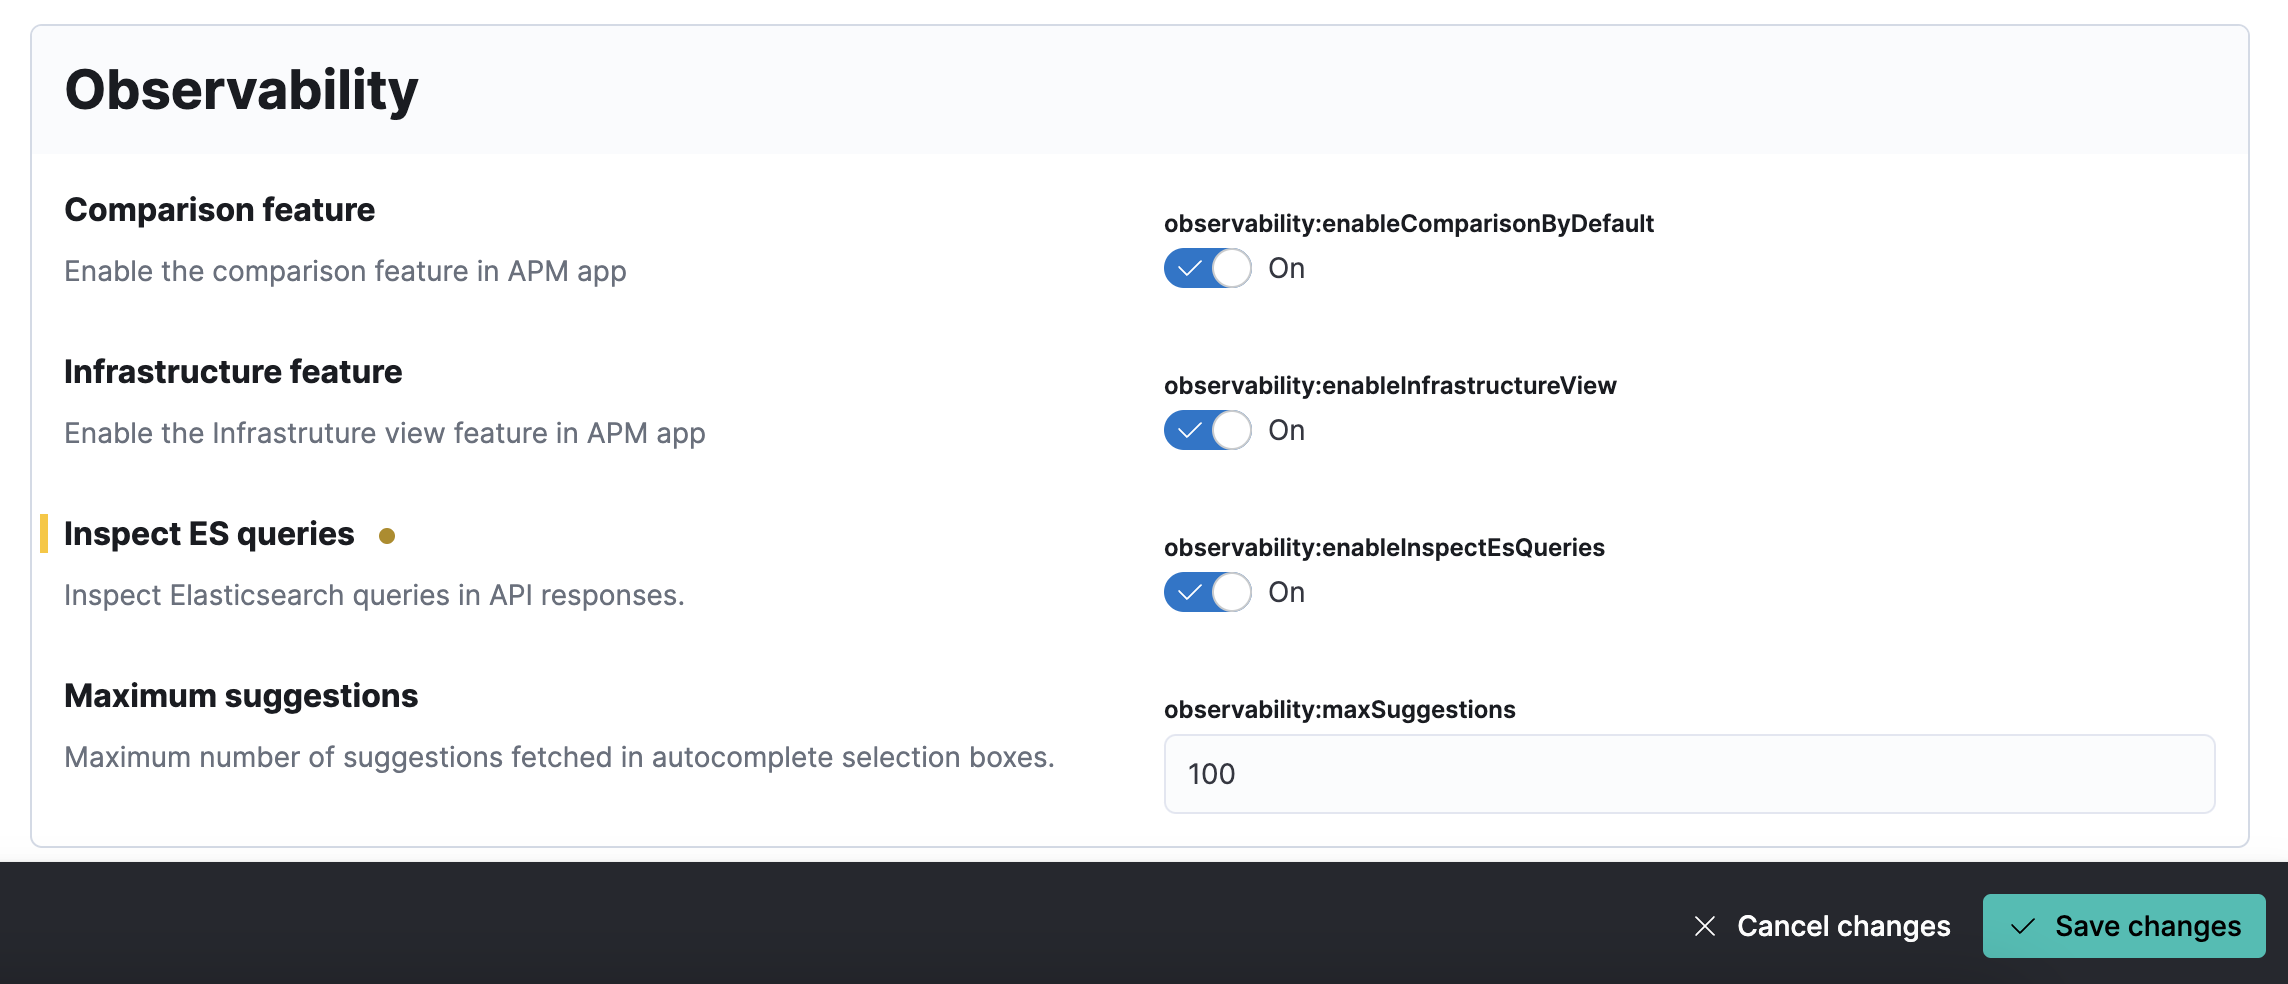
editTo enable inspect across apps:
- Go to Kibana’s Advanced Settings.
- Find the Observability section.
- Turn on the Inspect ES queries option.
- Click Save changes.
Inspect
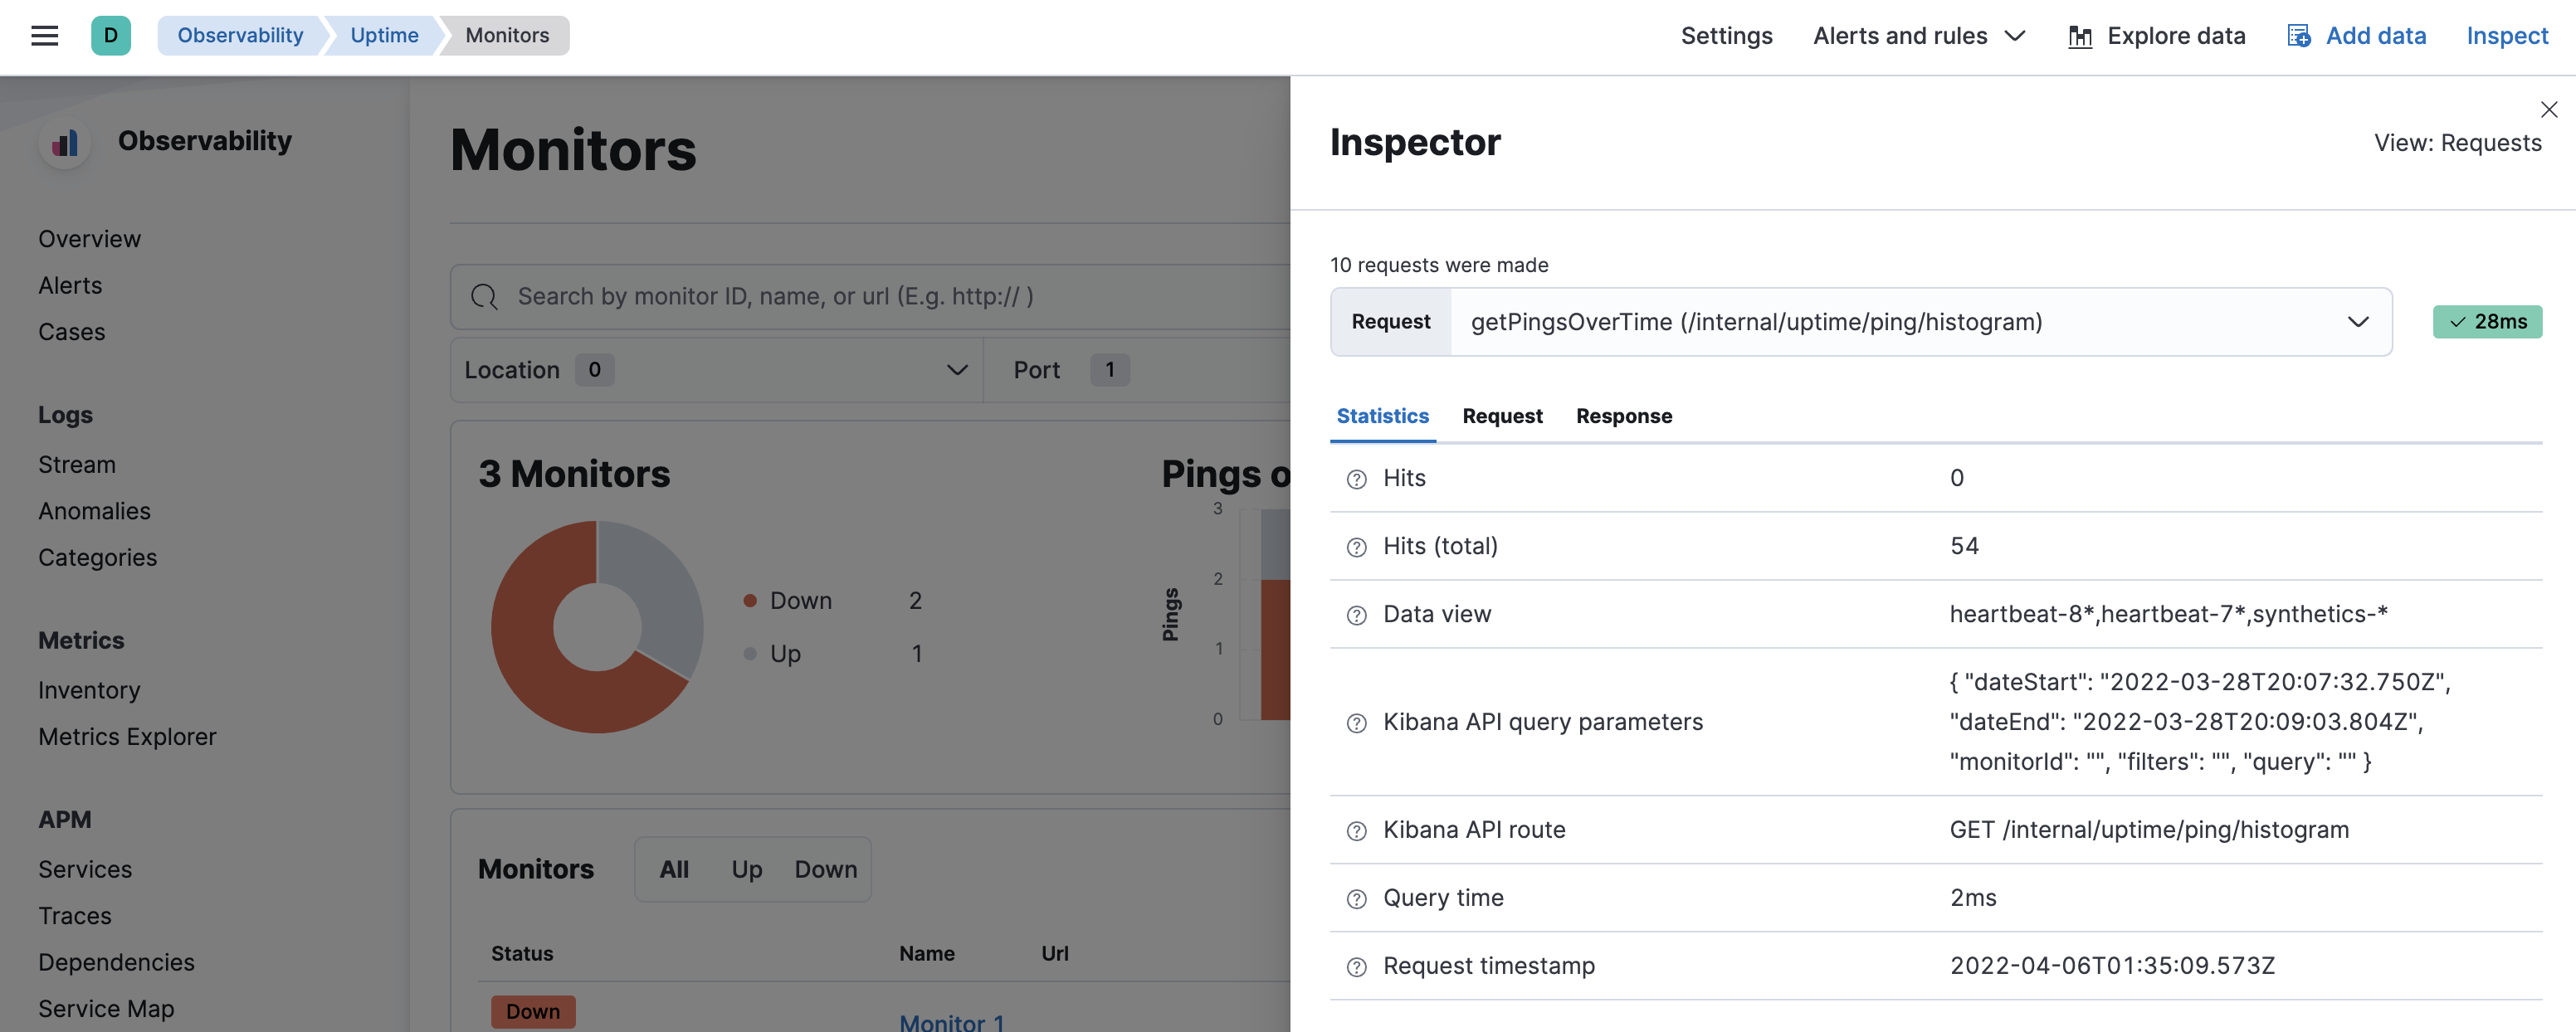
editOpen the inspect flyout by clicking Inspect in the top bar.
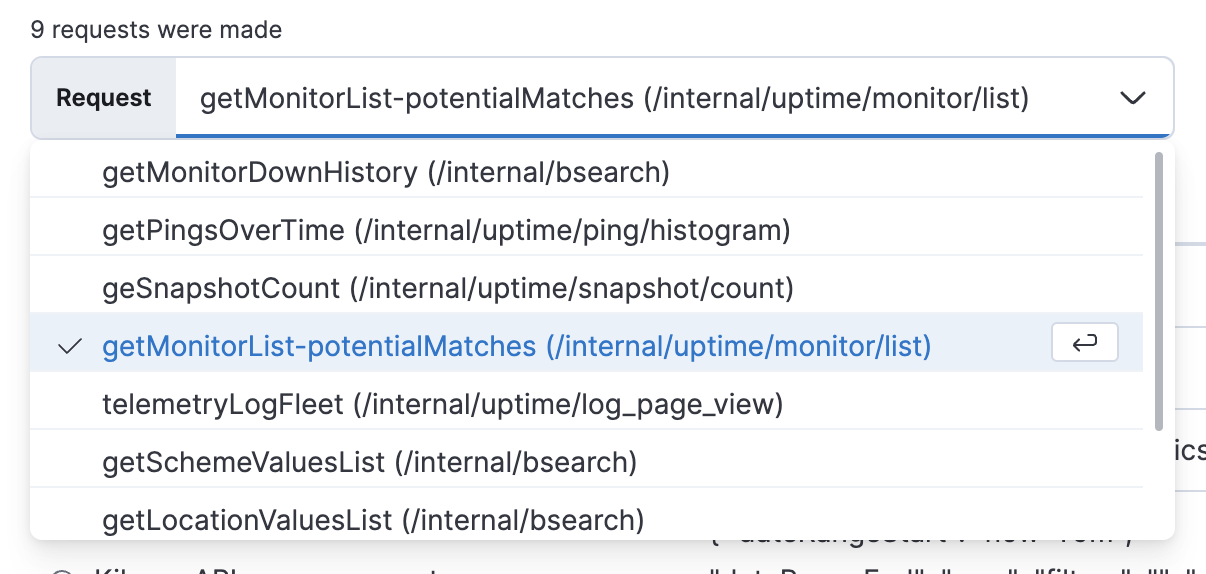
Click the Request dropdown to see all the requests used to make the current page work. Select one to see information about the request below.
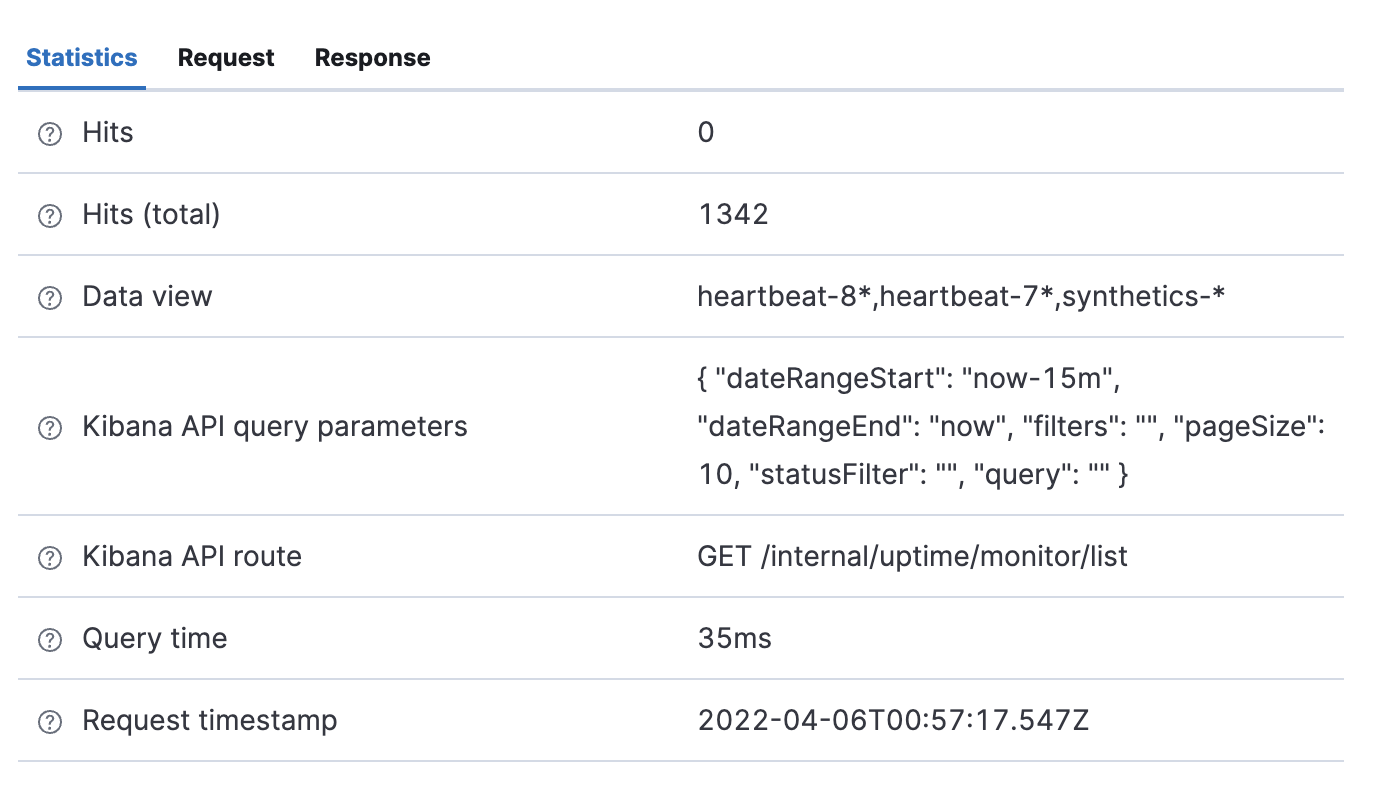
Toggle between the Statistics, Request, and Response tabs to see details for a single request.
The Statistics tab provides information about the request including:
|
Hits |
The number of documents returned by the query. |
|
Hits (total) |
The number of documents that match the query. |
|
Data view |
The data view that connected to the Elasticsearch indices. |
|
Kibana API query parameters |
The query parameters used in the Kibana API request that initiated the Elasticsearch request. |
|
Kibana API route |
The route of the Kibana API request that initiated the Elasticsearch request. |
|
Query time |
The time it took to process the query. Does not include the time to send the request or parse it in the browser. |
|
Request timestamp |
Time when the start of the request has been logged. |
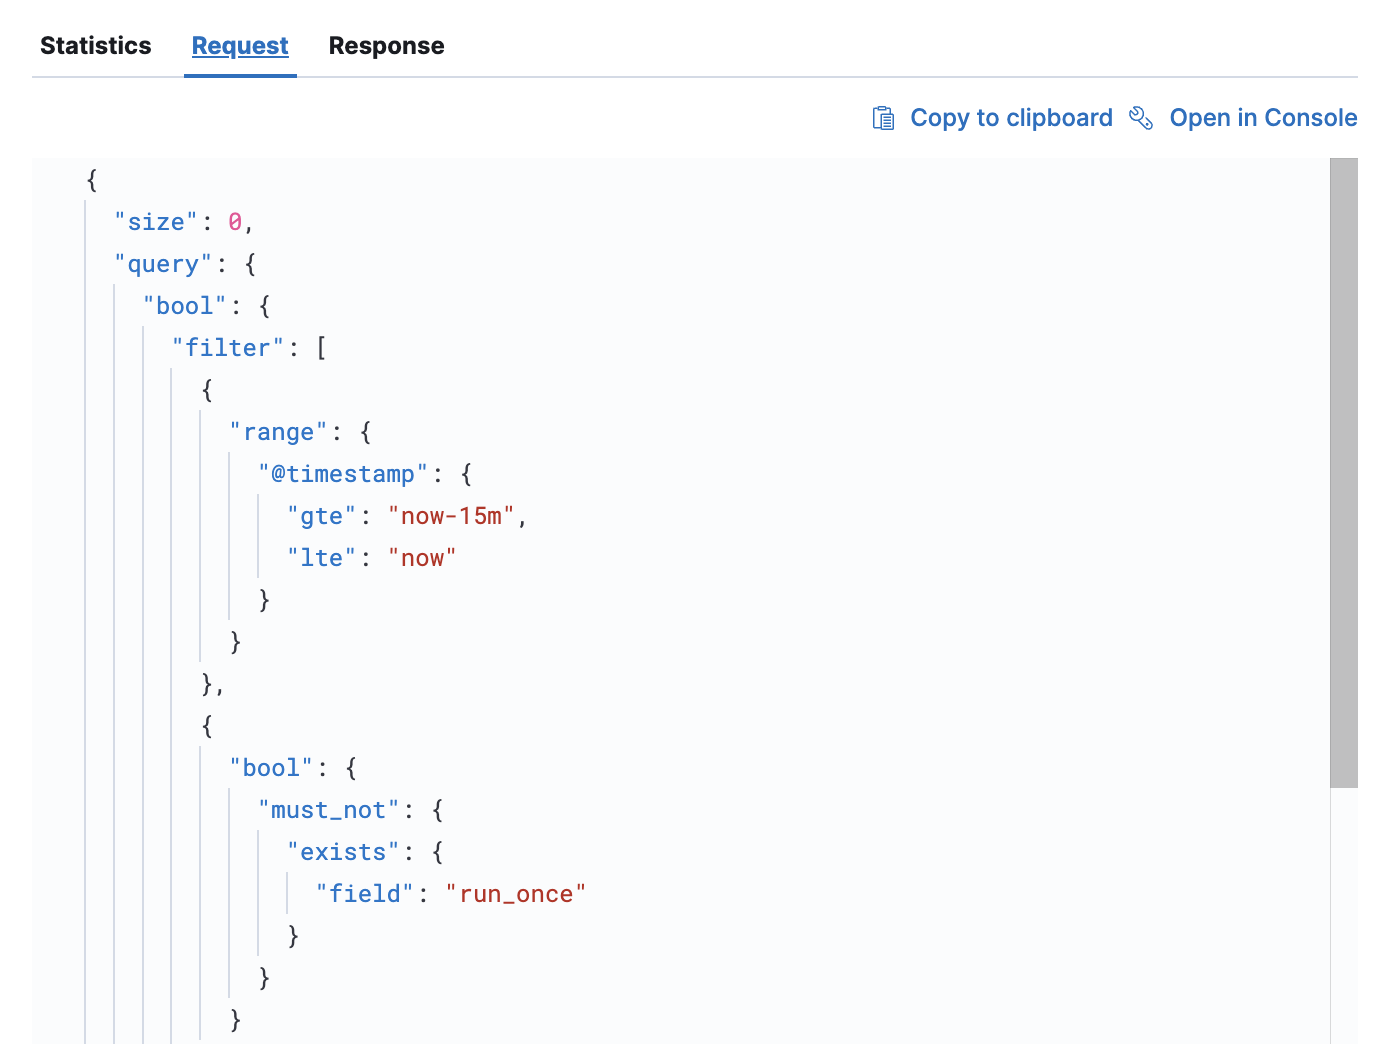
The Request tab shows the exact syntax used in the request. You can click Copy to clipboard to copy the request or Open in Console to open it in the Kibana console.
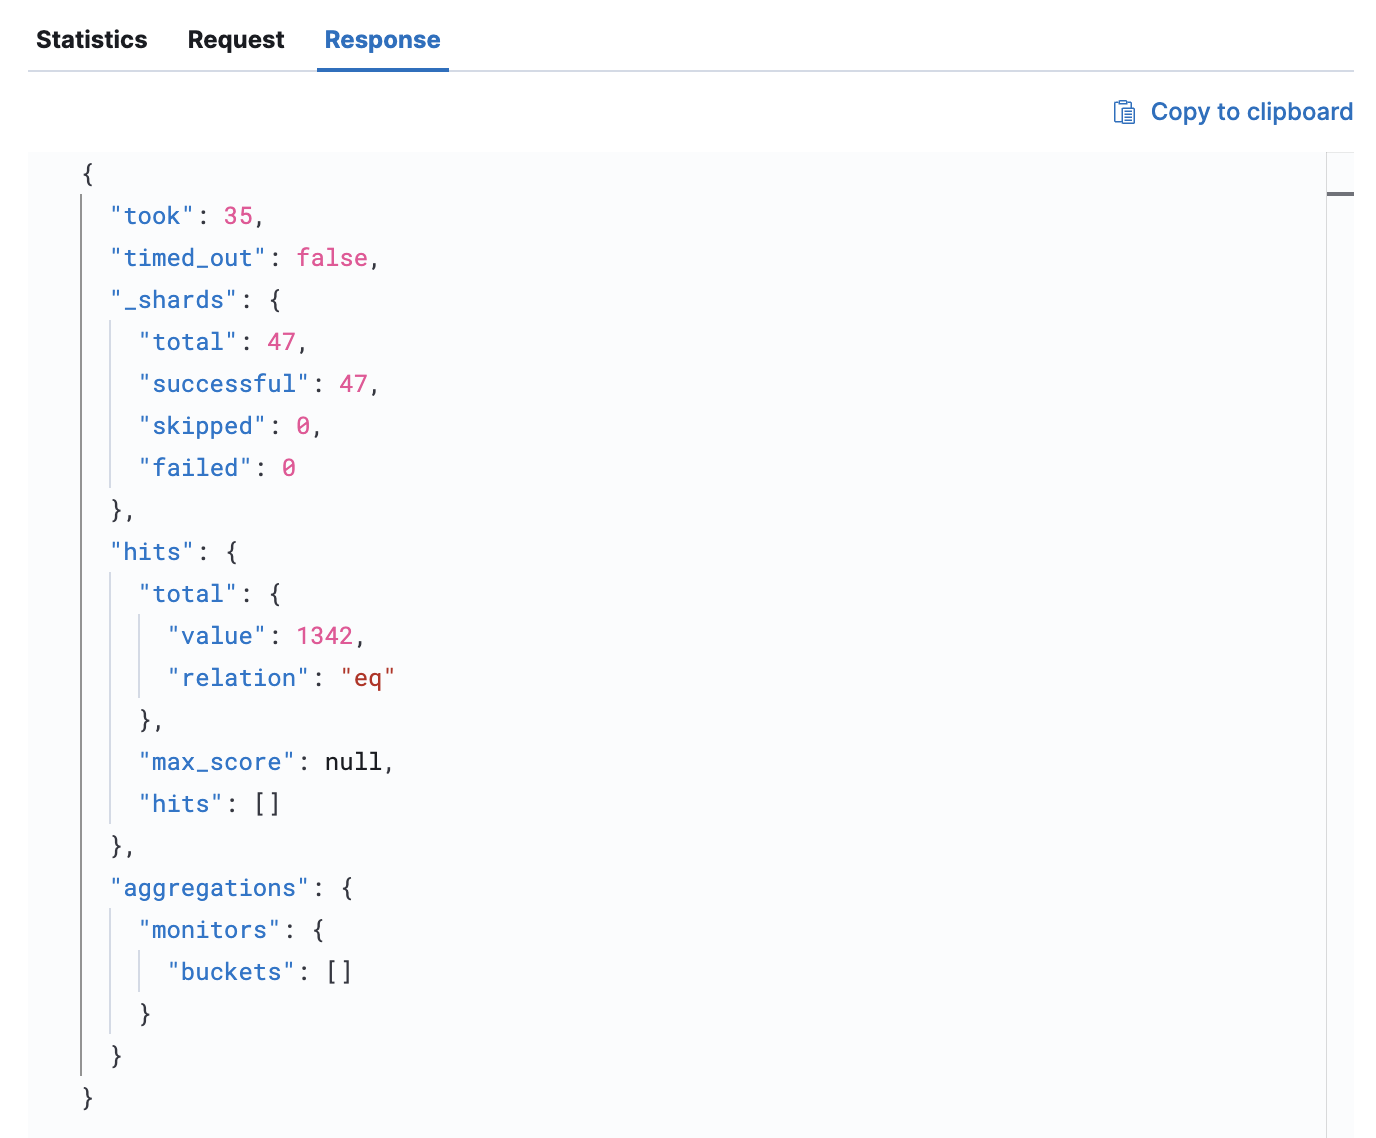
The Response tab shows the exact response used in the visualizations on the page. You can click Copy to clipboard to copy the response.