CI/CD observability
editCI/CD observability
editTo help administrators monitor and troubleshoot their CI/CD platform and help developers increase the speed and reliability of their CI/CD pipelines, Elastic Observability provides visibility in Continuous Integration and Continuous Delivery (CI/CD) processes.
To provide monitoring dashboards, alerting, and root cause analysis on pipelines, Elastic works with the communities of the most popular CI/CD platforms to instrument tools with OpenTelemetry.
CI/CD observability architectures
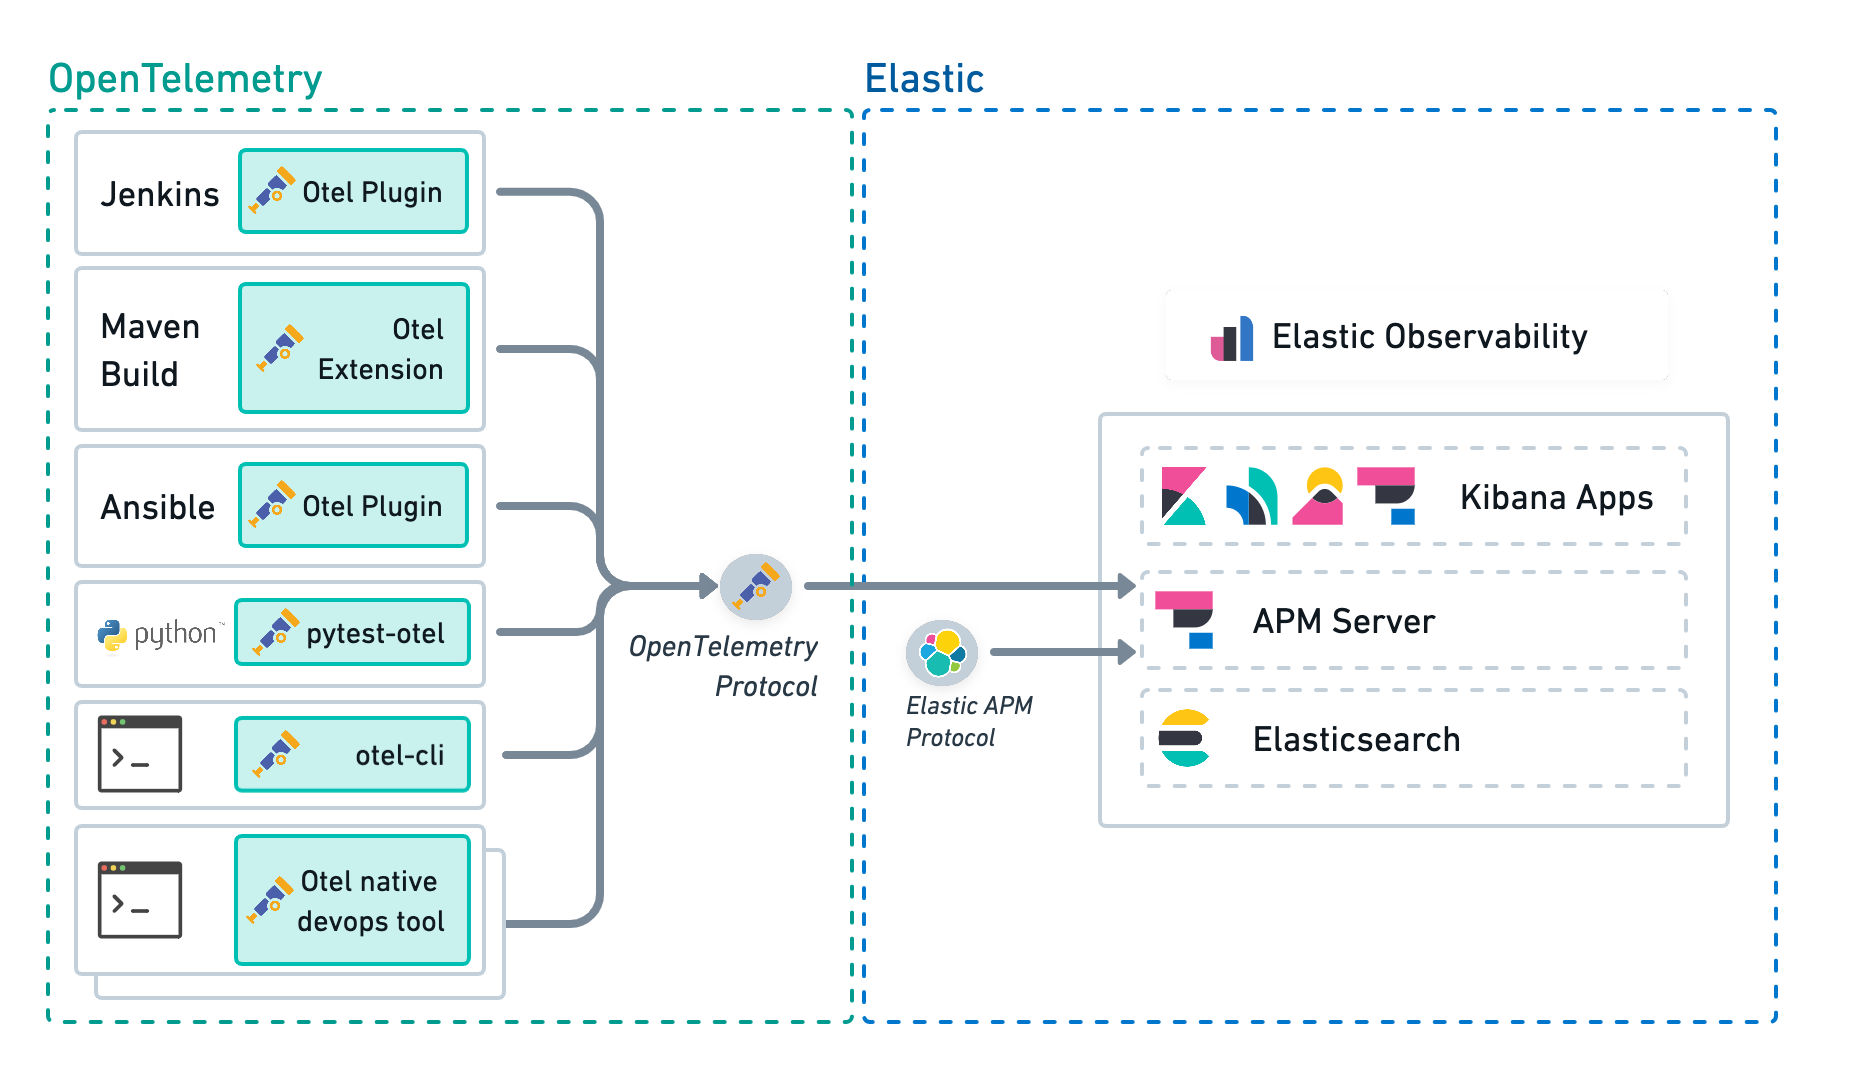
editUsing the APM Server, connect all your OpenTelemetry native CI/CD tools directly to Elastic Observability.
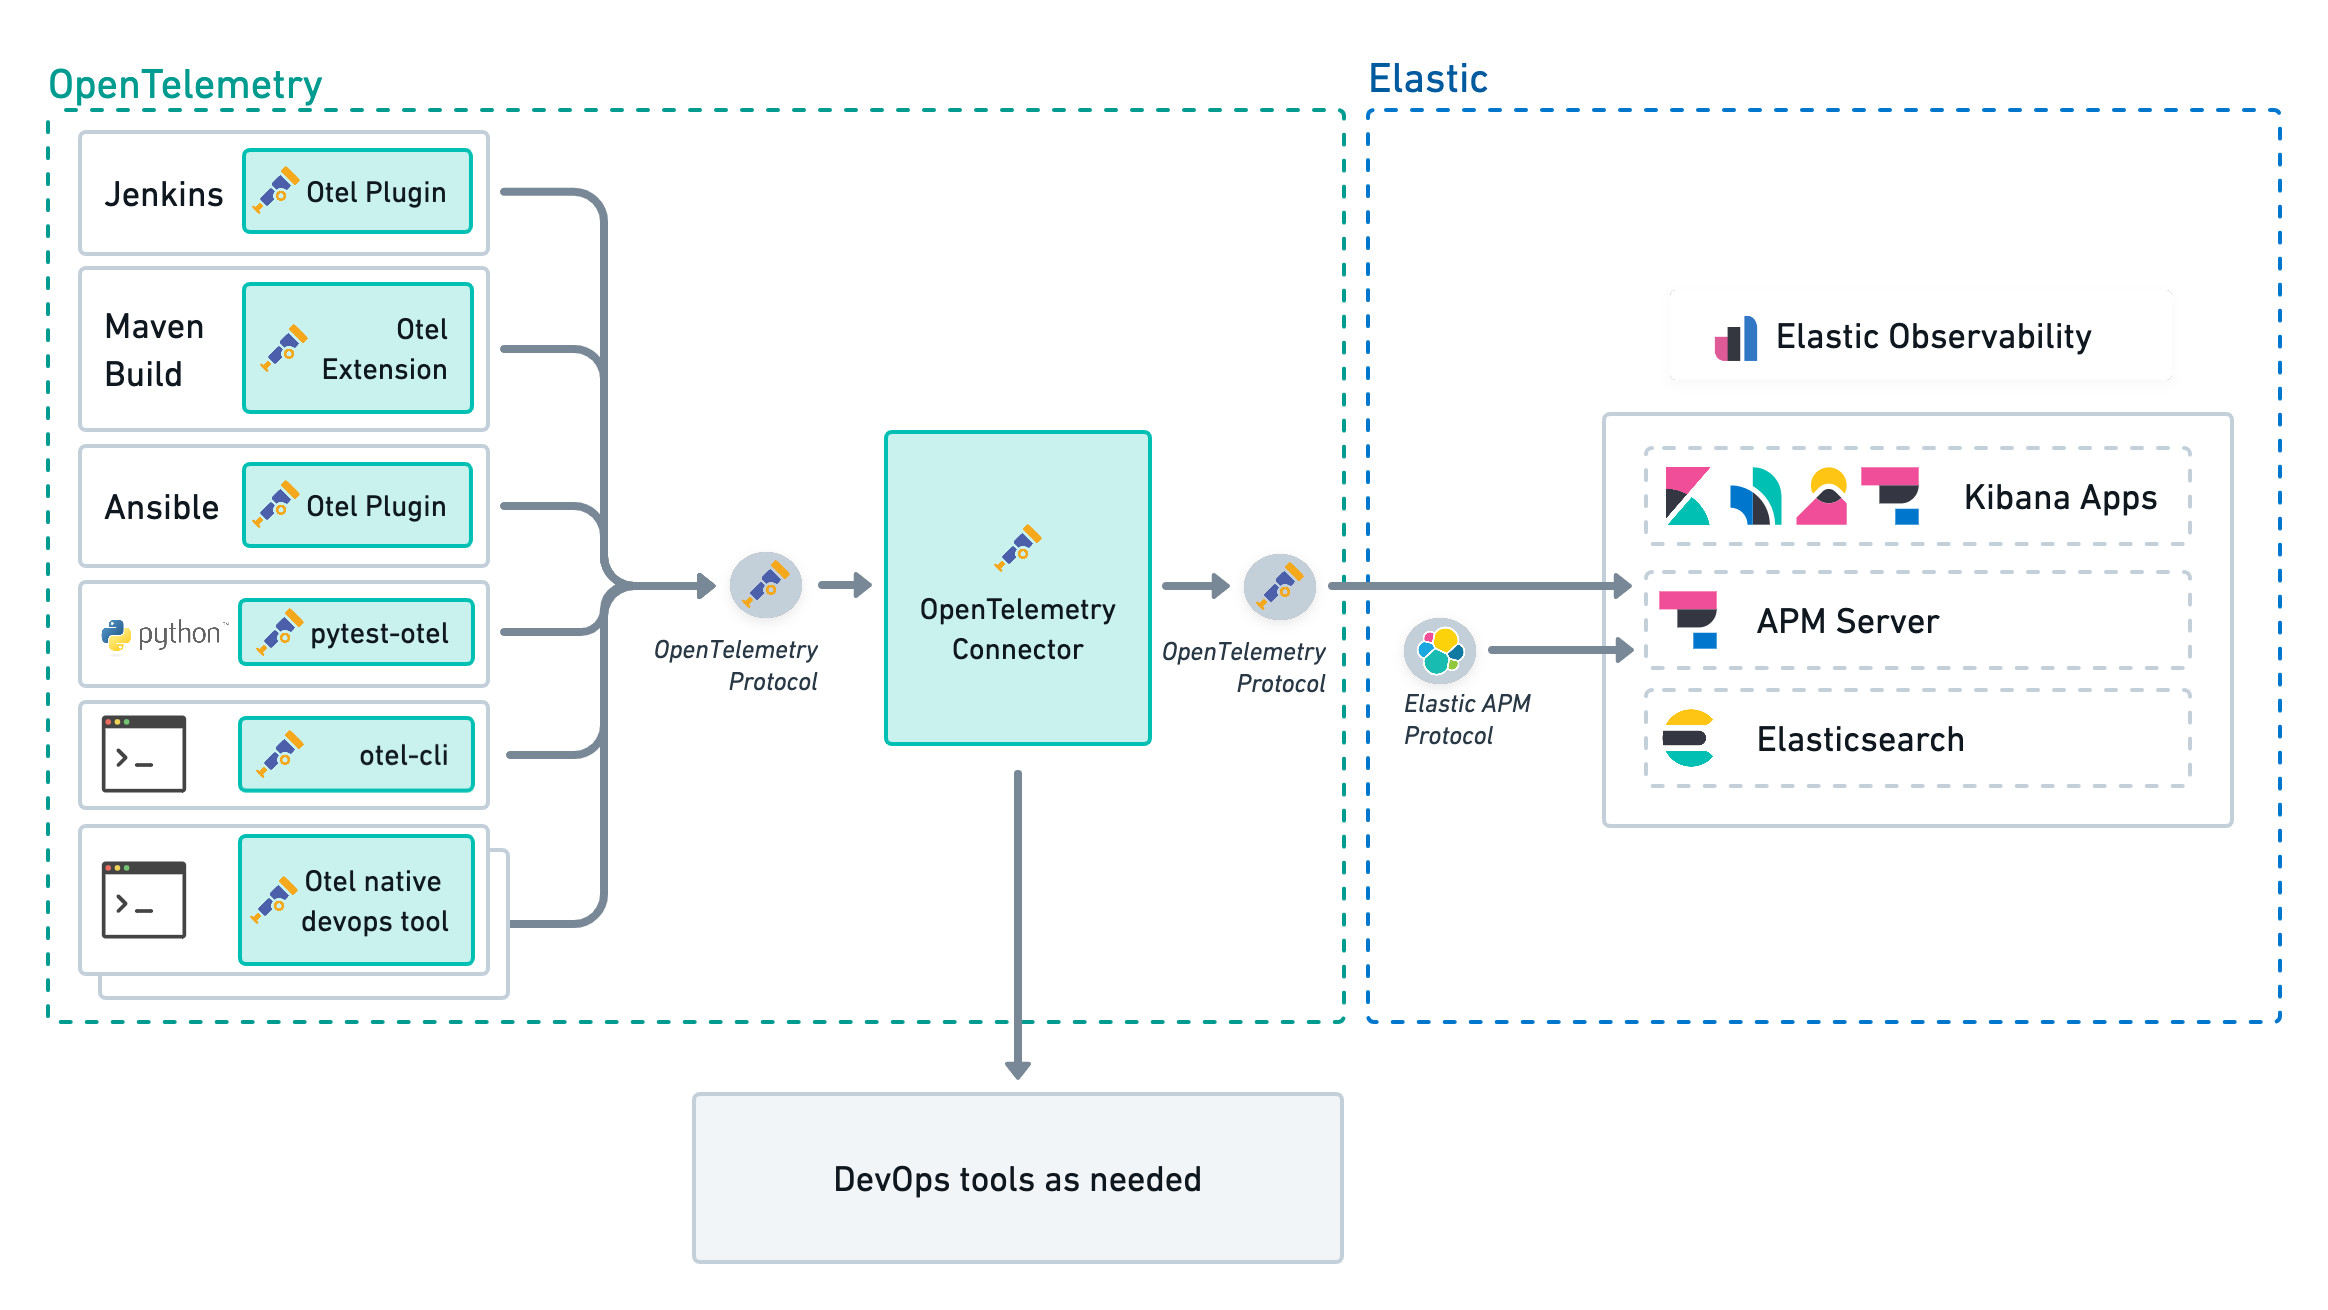
A more advanced CI/CD observability architecture includes an OpenTelemetry Collector deployed on the edge, next to the CI/CD tools. This architecture provides the following:
- Low latency between the CI/CD tools and the collector is particularly beneficial to ephemeral tools like the otel-cli.
- The ability to route the observability signals to multiple backends in addition to Elastic Observability.
Observability for CI/CD administrators
editElastic Observability allows CI/CD administrators to monitor and troubleshoot CI/CD platforms and detect anomalies.
CI/CD platform monitoring and alerting
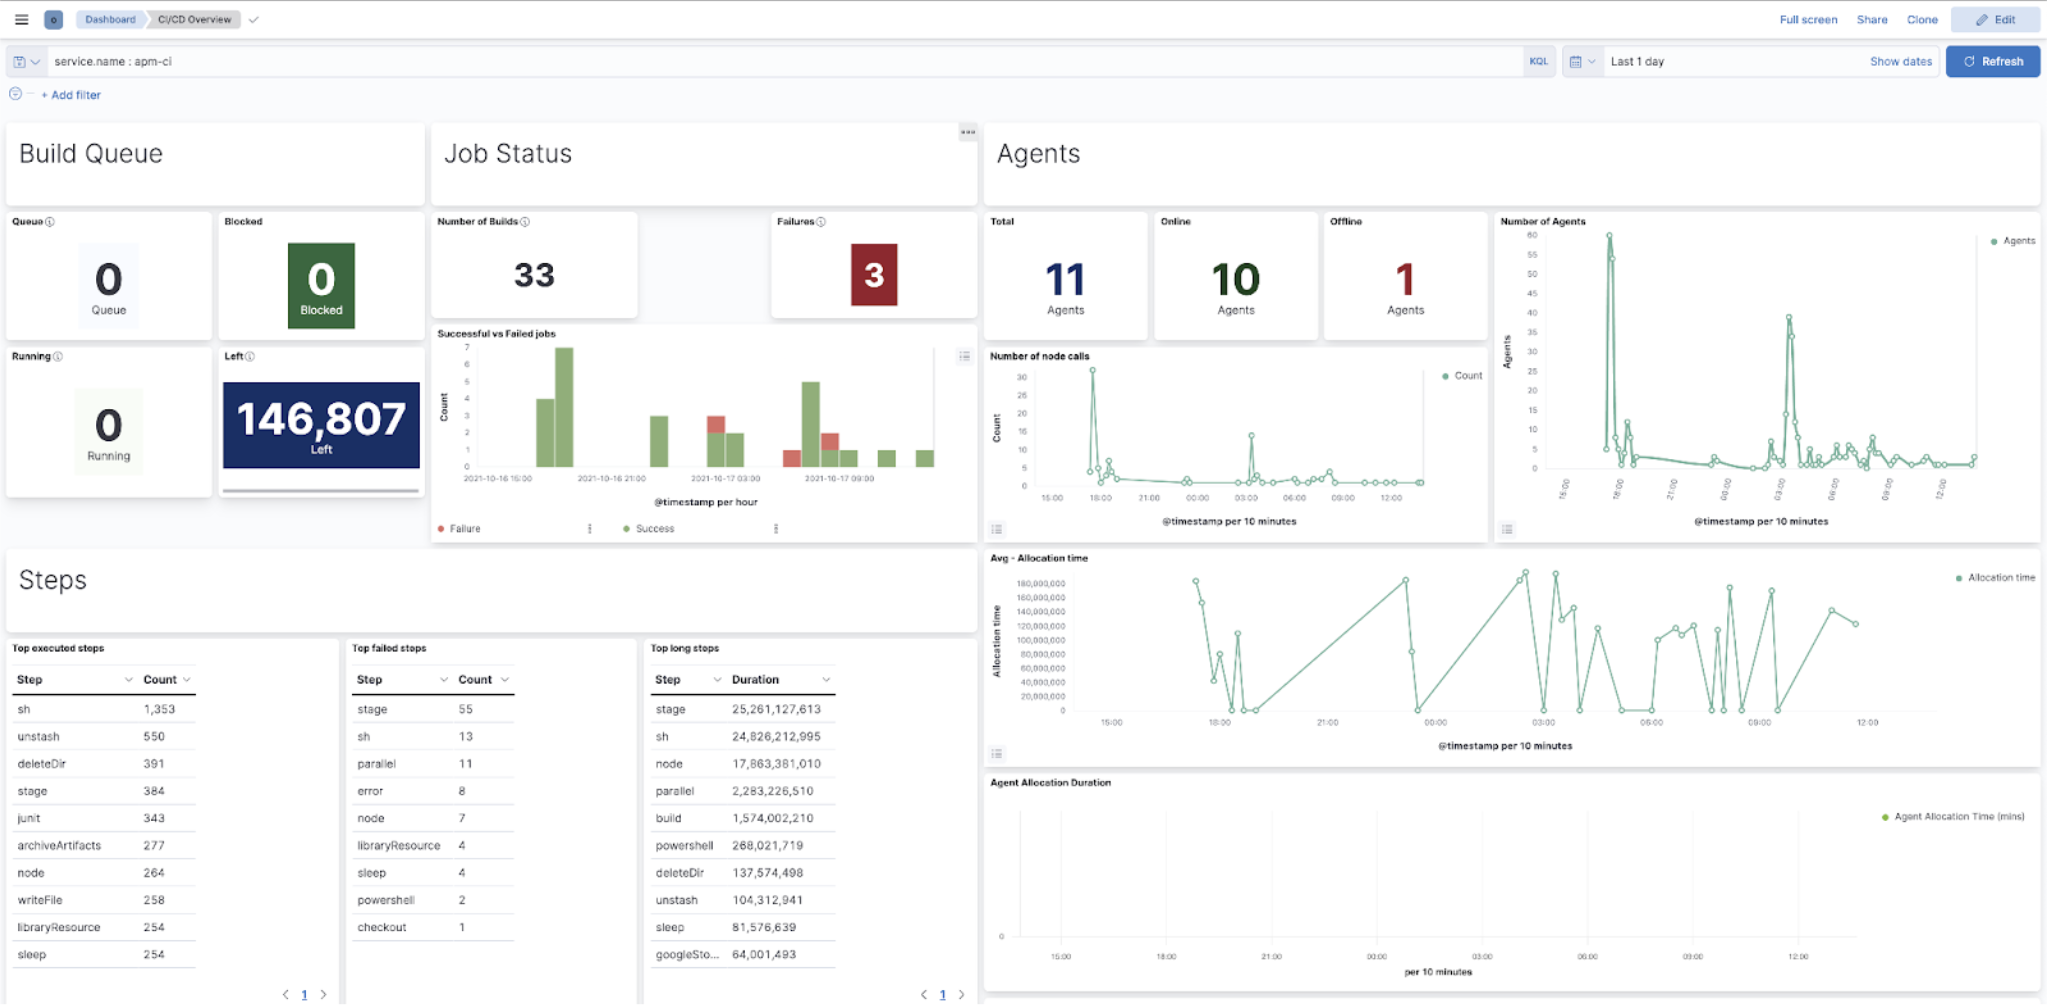
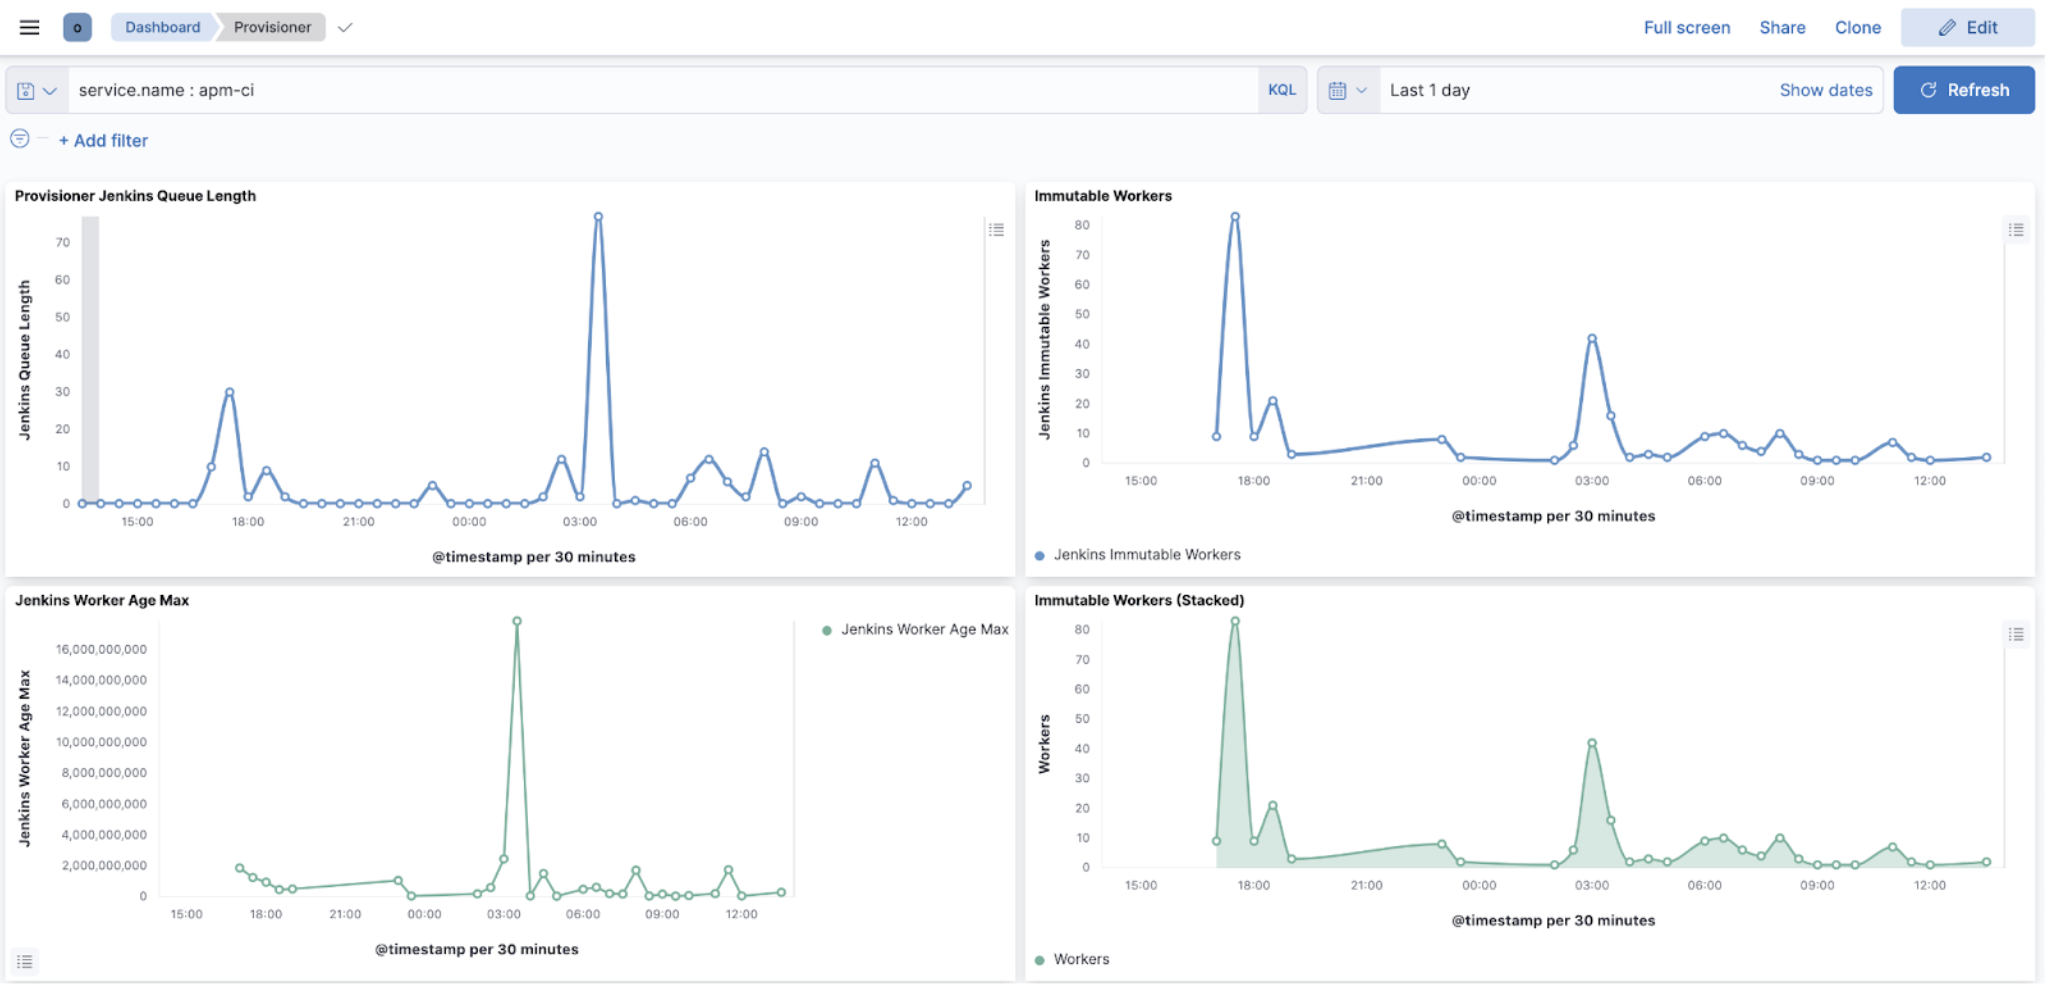
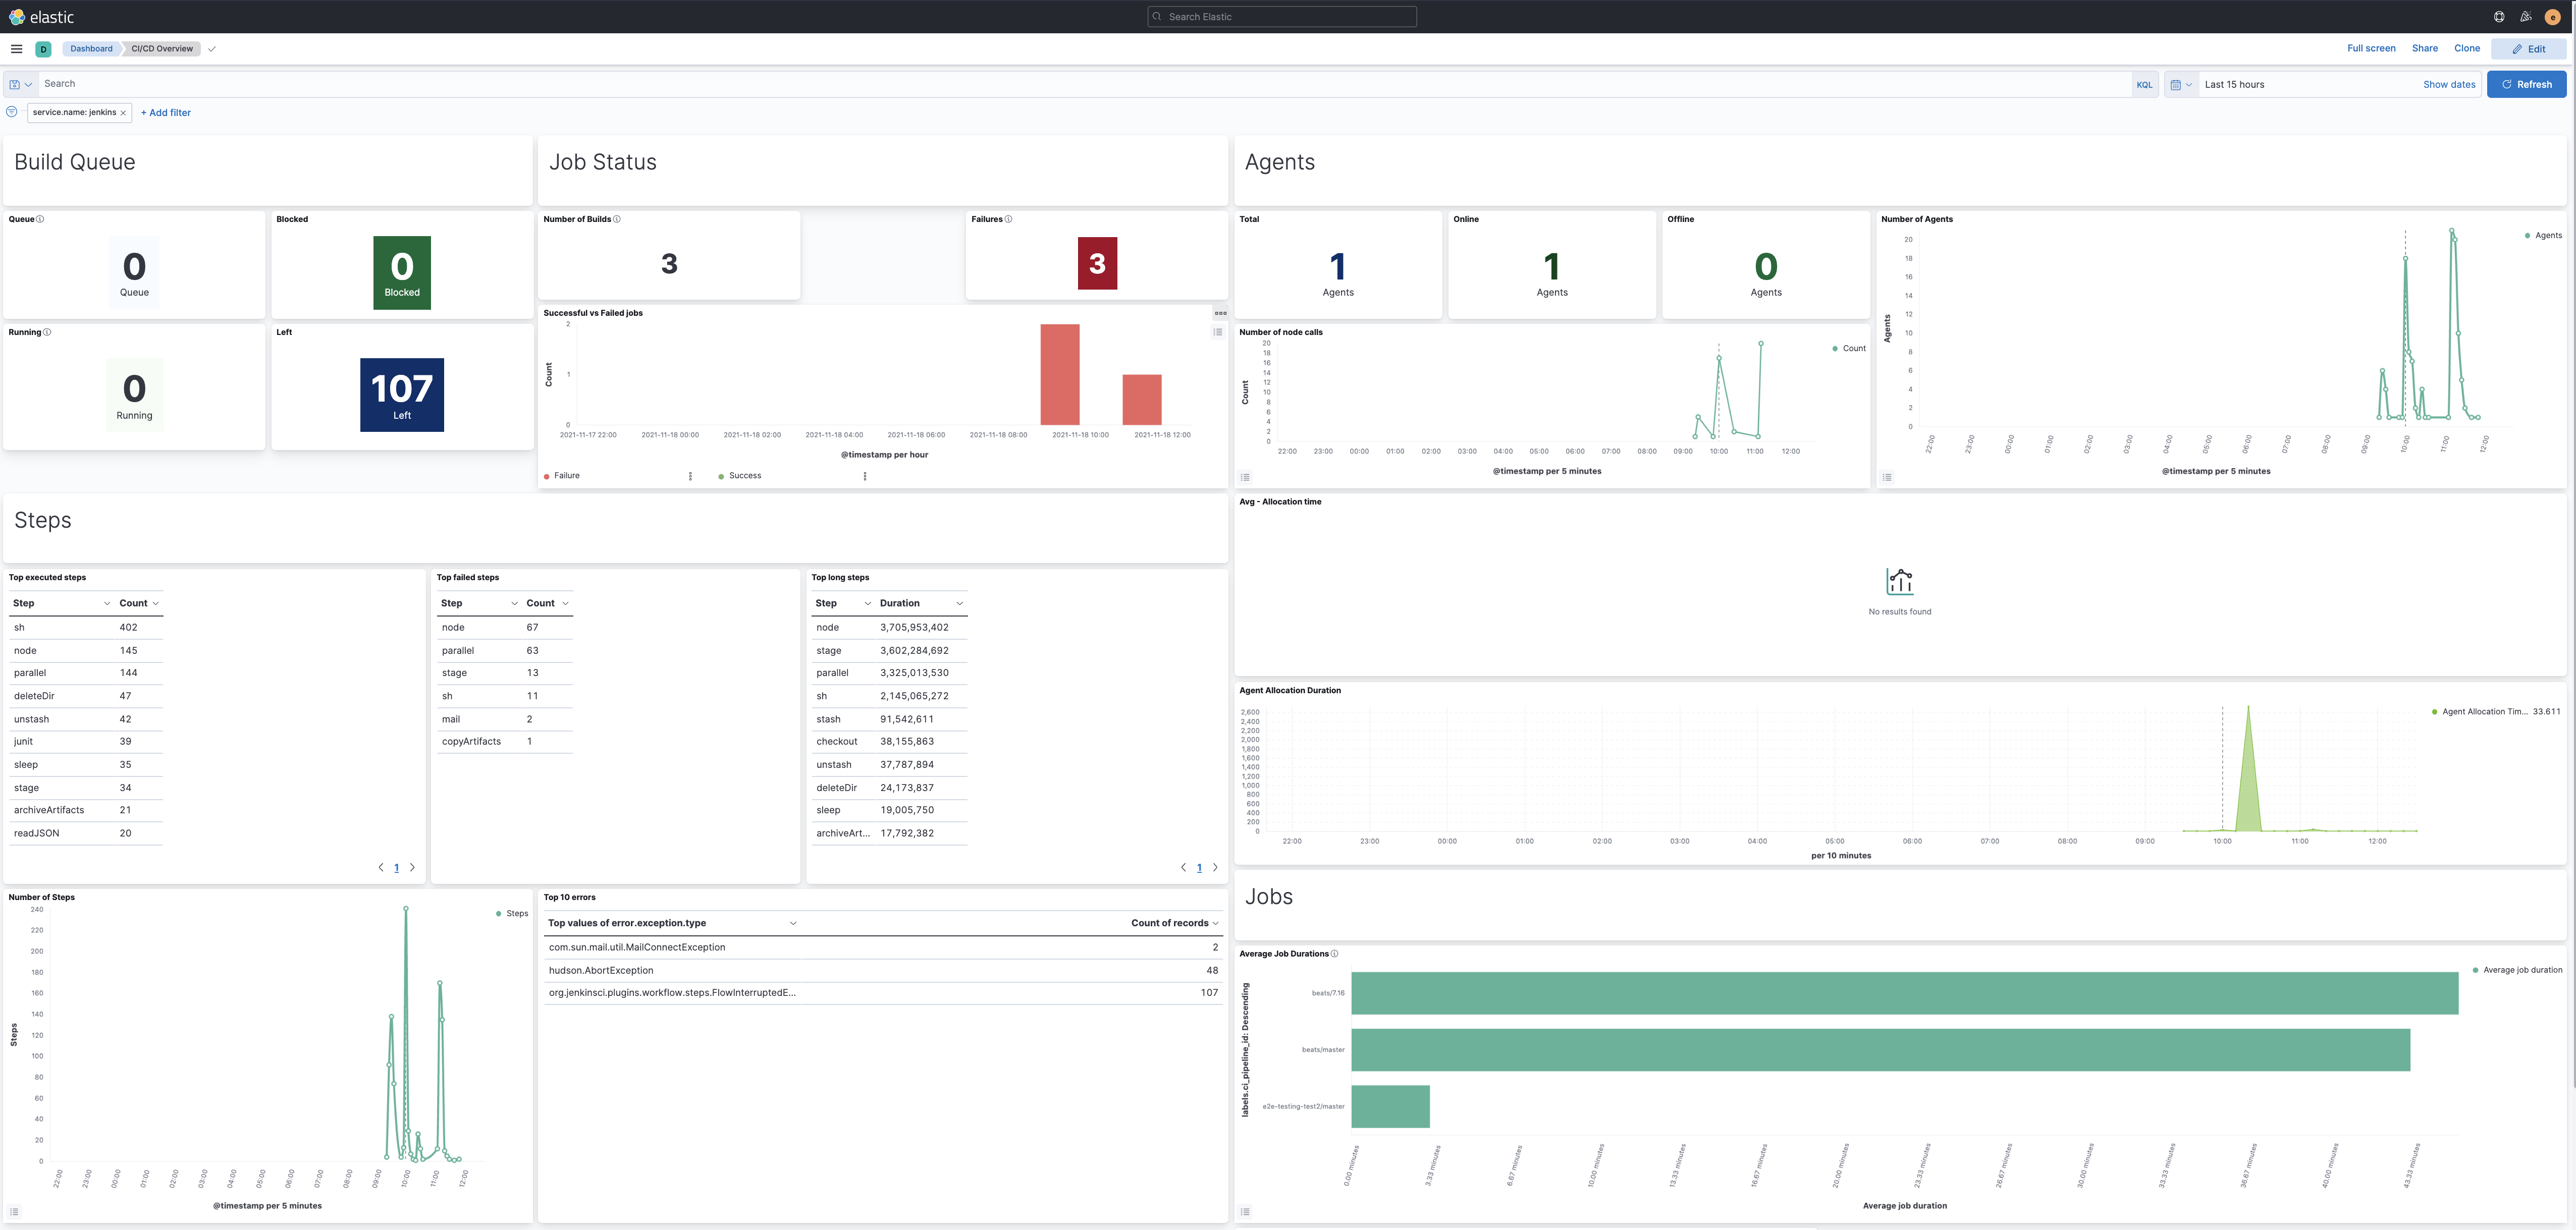
editElastic Observability helps CI/CD administrators monitor their platform by providing KPI dashboards of CI systems.
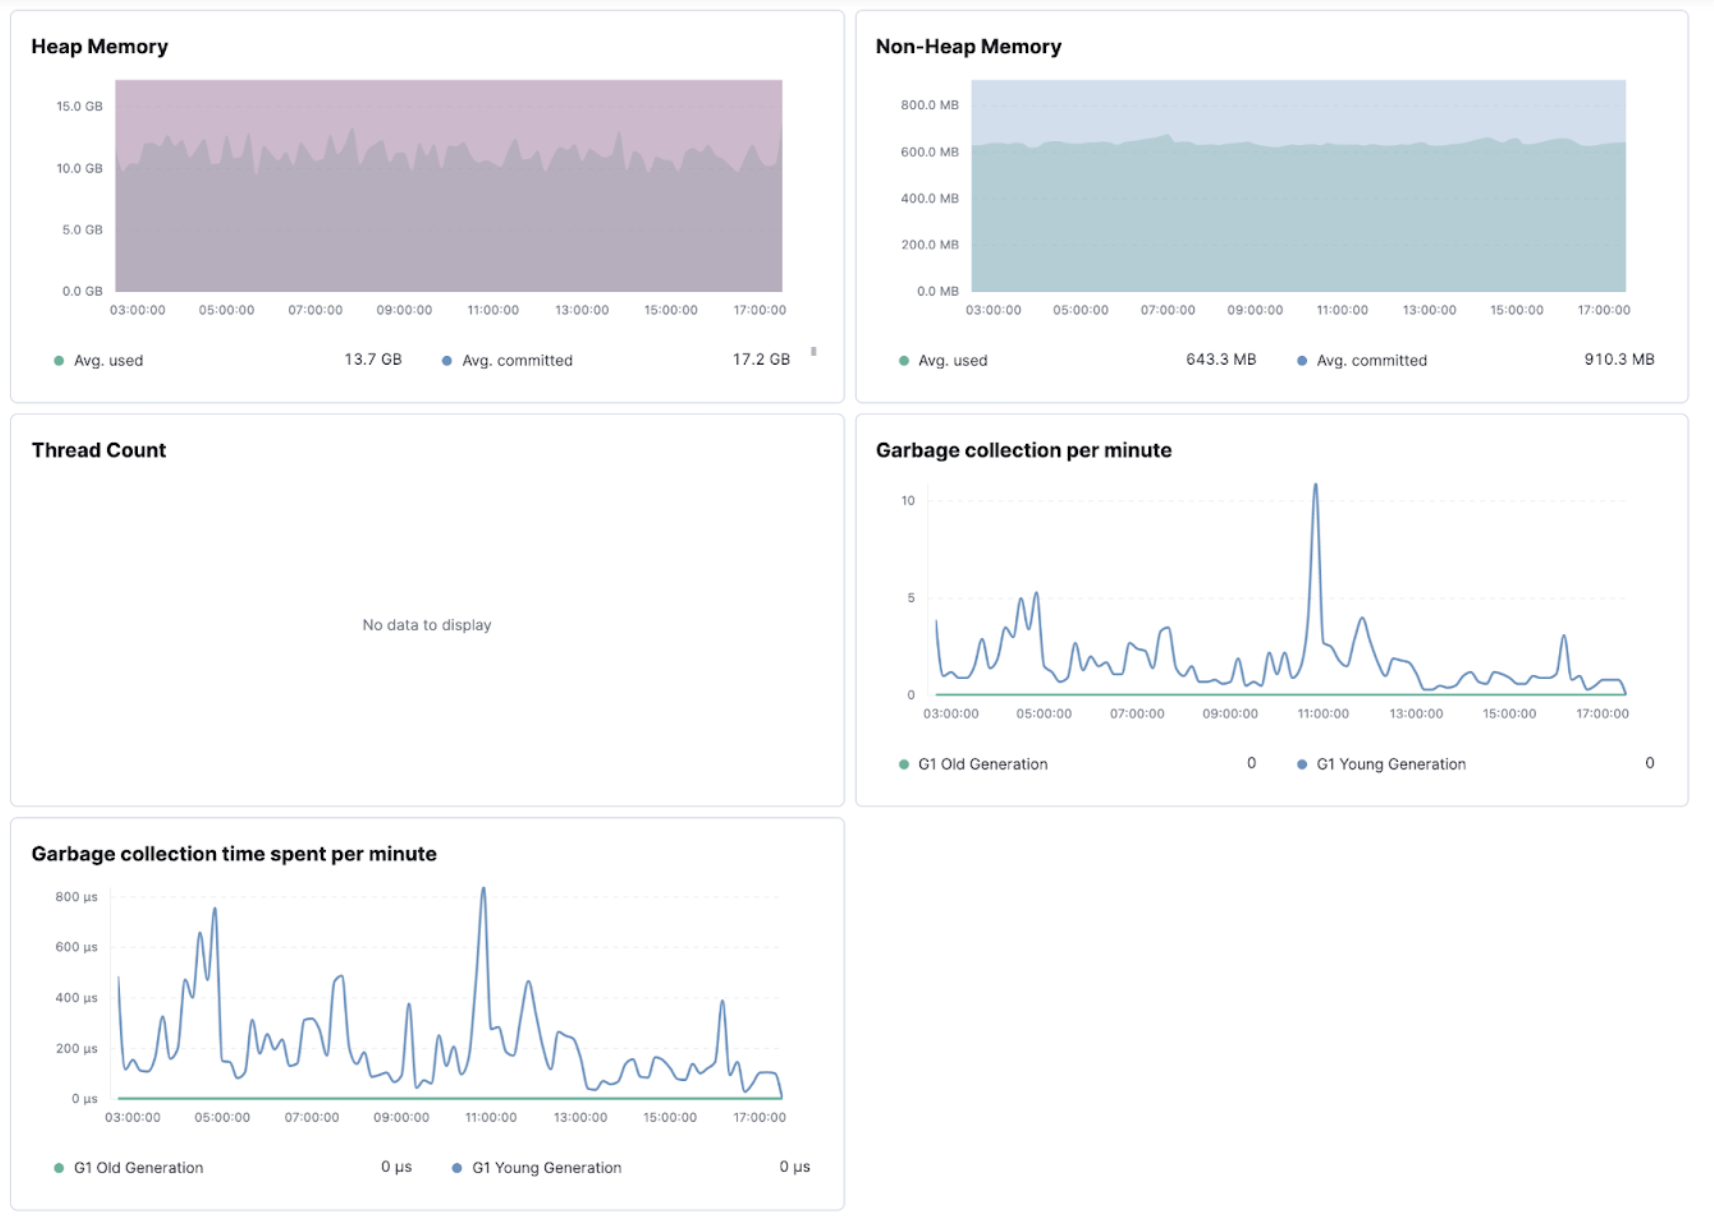
The Jenkins health dashboards provide insights on the build executions, the failures, the provisioning of build agents, the active and idle workers, or the JVM health.
CI/CD platform troubleshooting
editCI/CD administrators need to assess the impact of anomalies when troubleshooting platform problems quickly, whether troubleshooting just one pipeline to much broader outages impacting many pipelines or the entire CI/CD platform.
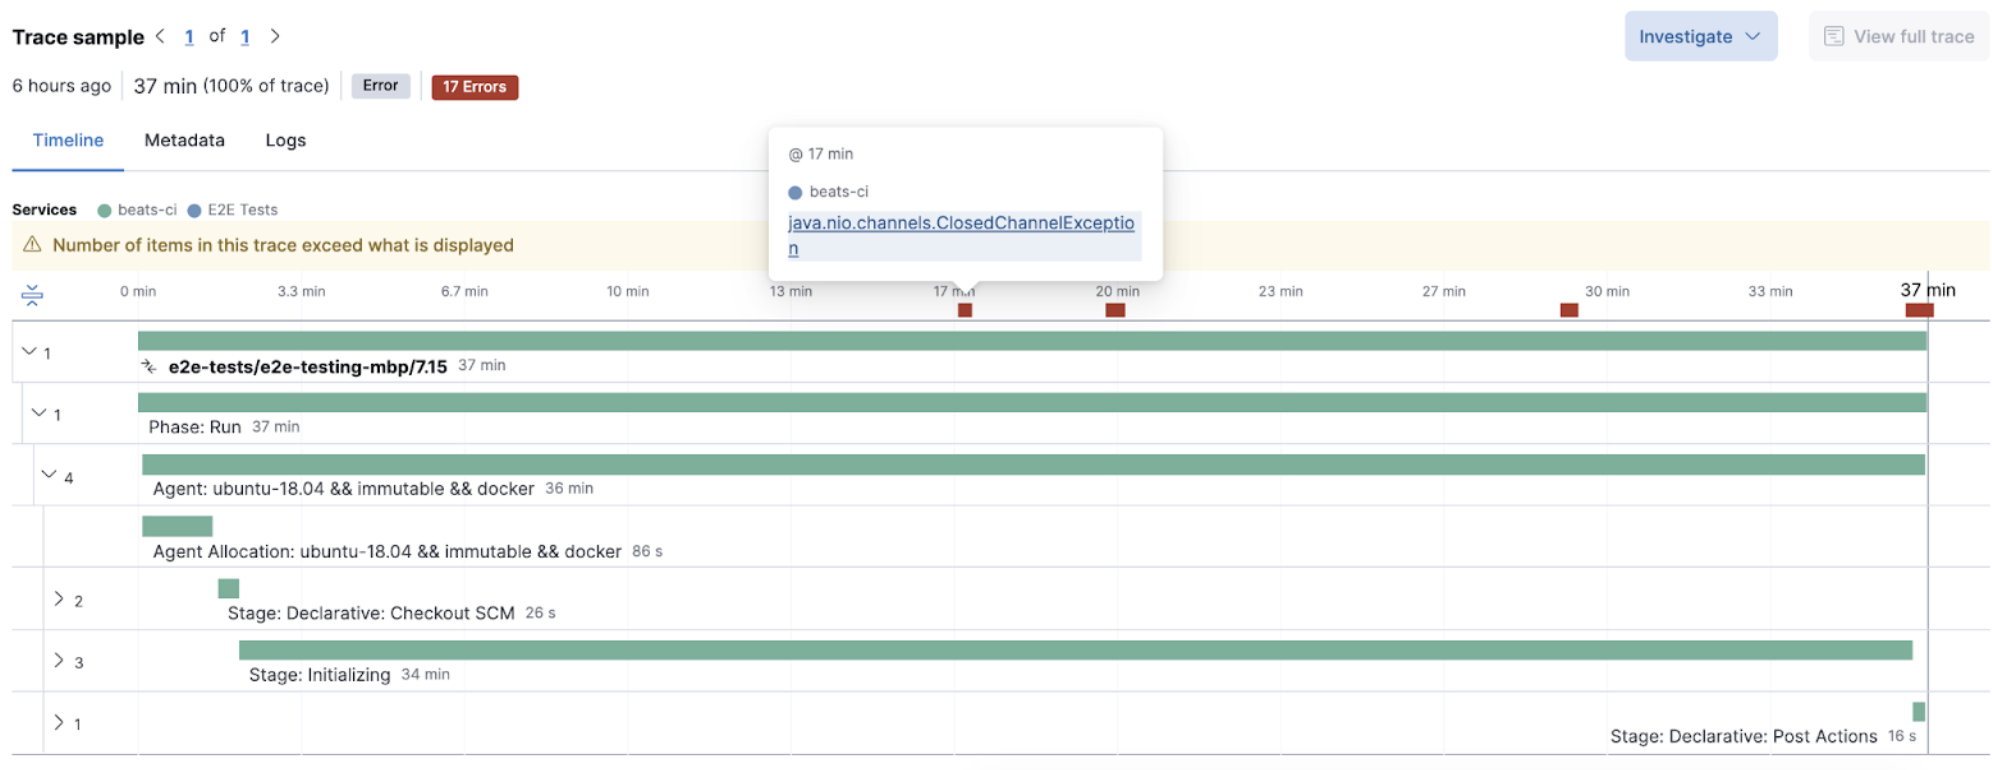
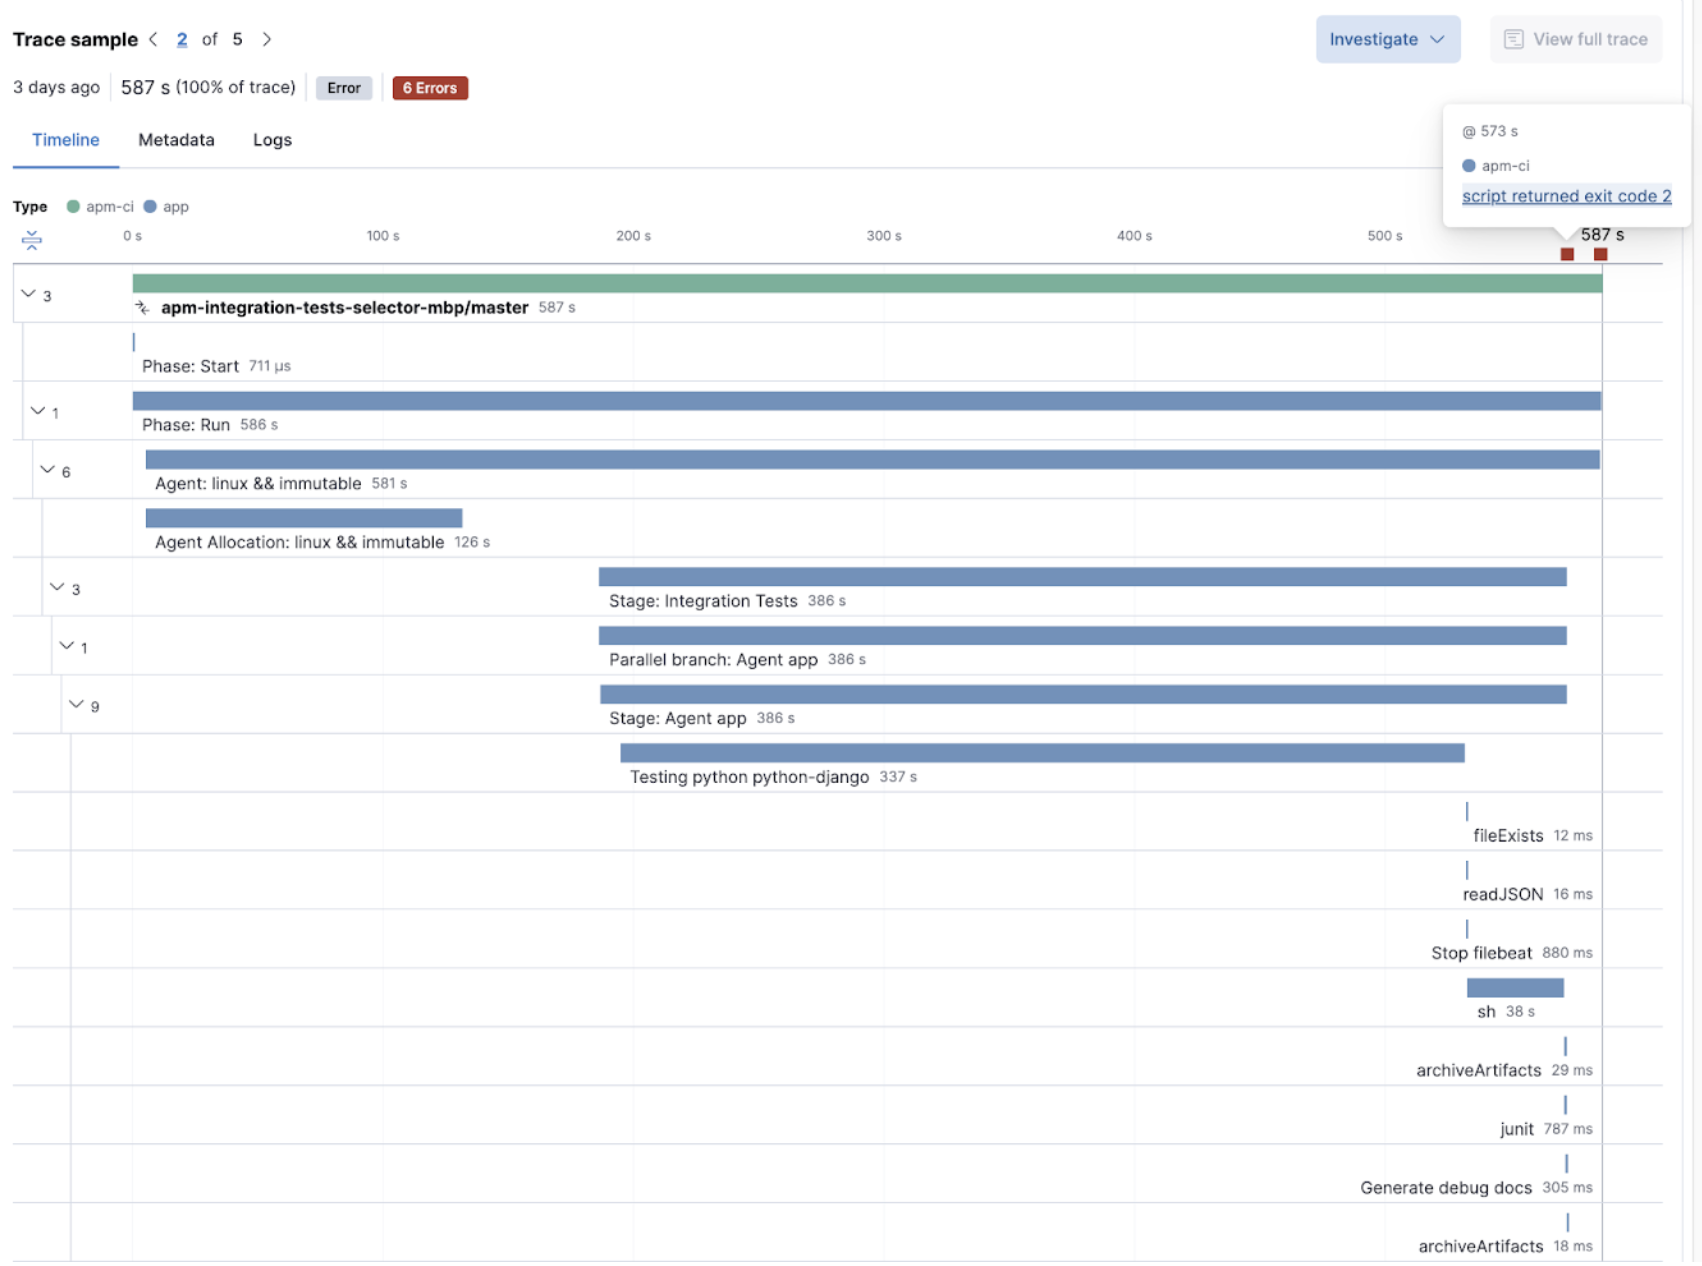
Elastic Observability enables troubleshooting CI platform outages by providing visualizations of pipeline executions as distributed traces, along with the capability to slice and dice pipeline executions in any dimension to assess the nature and the impact of the outage.
In the following image, a Jenkins CI build failed, and its exceptions are reported as errors. Select any of those errors to view the specific information. In this case, it’s errors relating to the CI agent that stopped.
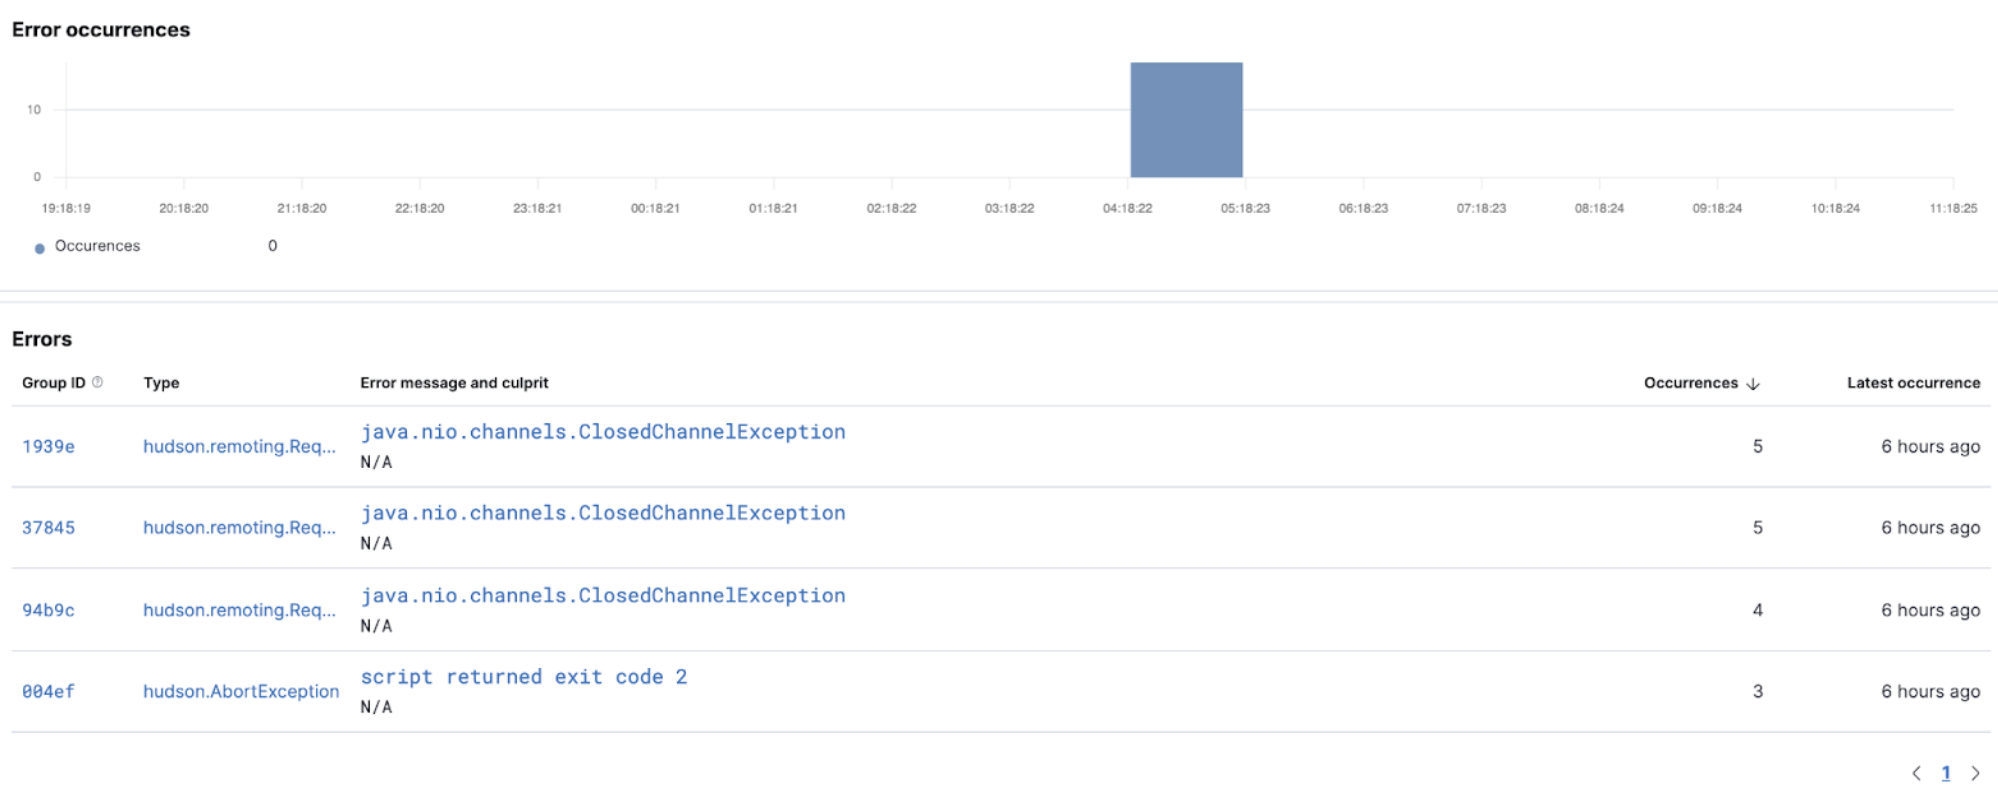
The Errors overview screen provides a high-level view of the exceptions that CI builds catch. Similar errors are grouped to quickly see which ones are affecting your services and allow you to take action to rectify them.
Observability for developers
editDevelopment teams need to continuously optimize their ever-changing CI/CD pipelines to improve their reliability while chasing faster pipelines. Visualizations of pipelines as distributed traces help to document what’s happening and improve performance and reliability (flaky tests and pipelines).
Integrating with many popular CI/CD and DevOps tools like Maven or Ansible using OpenTelemetry, Elastic Observability solves these problems by providing deep insights into the execution of CI/CD pipelines.
CI/CD pipeline visibility
editThe visualization of CI/CD pipelines as distributed traces in Elastic Observability provides documentation and health indicators of all your pipelines.
The APM Service view in Elastic Observability provides a view of all your instrumented CI/CD servers with insights on their KPIs.
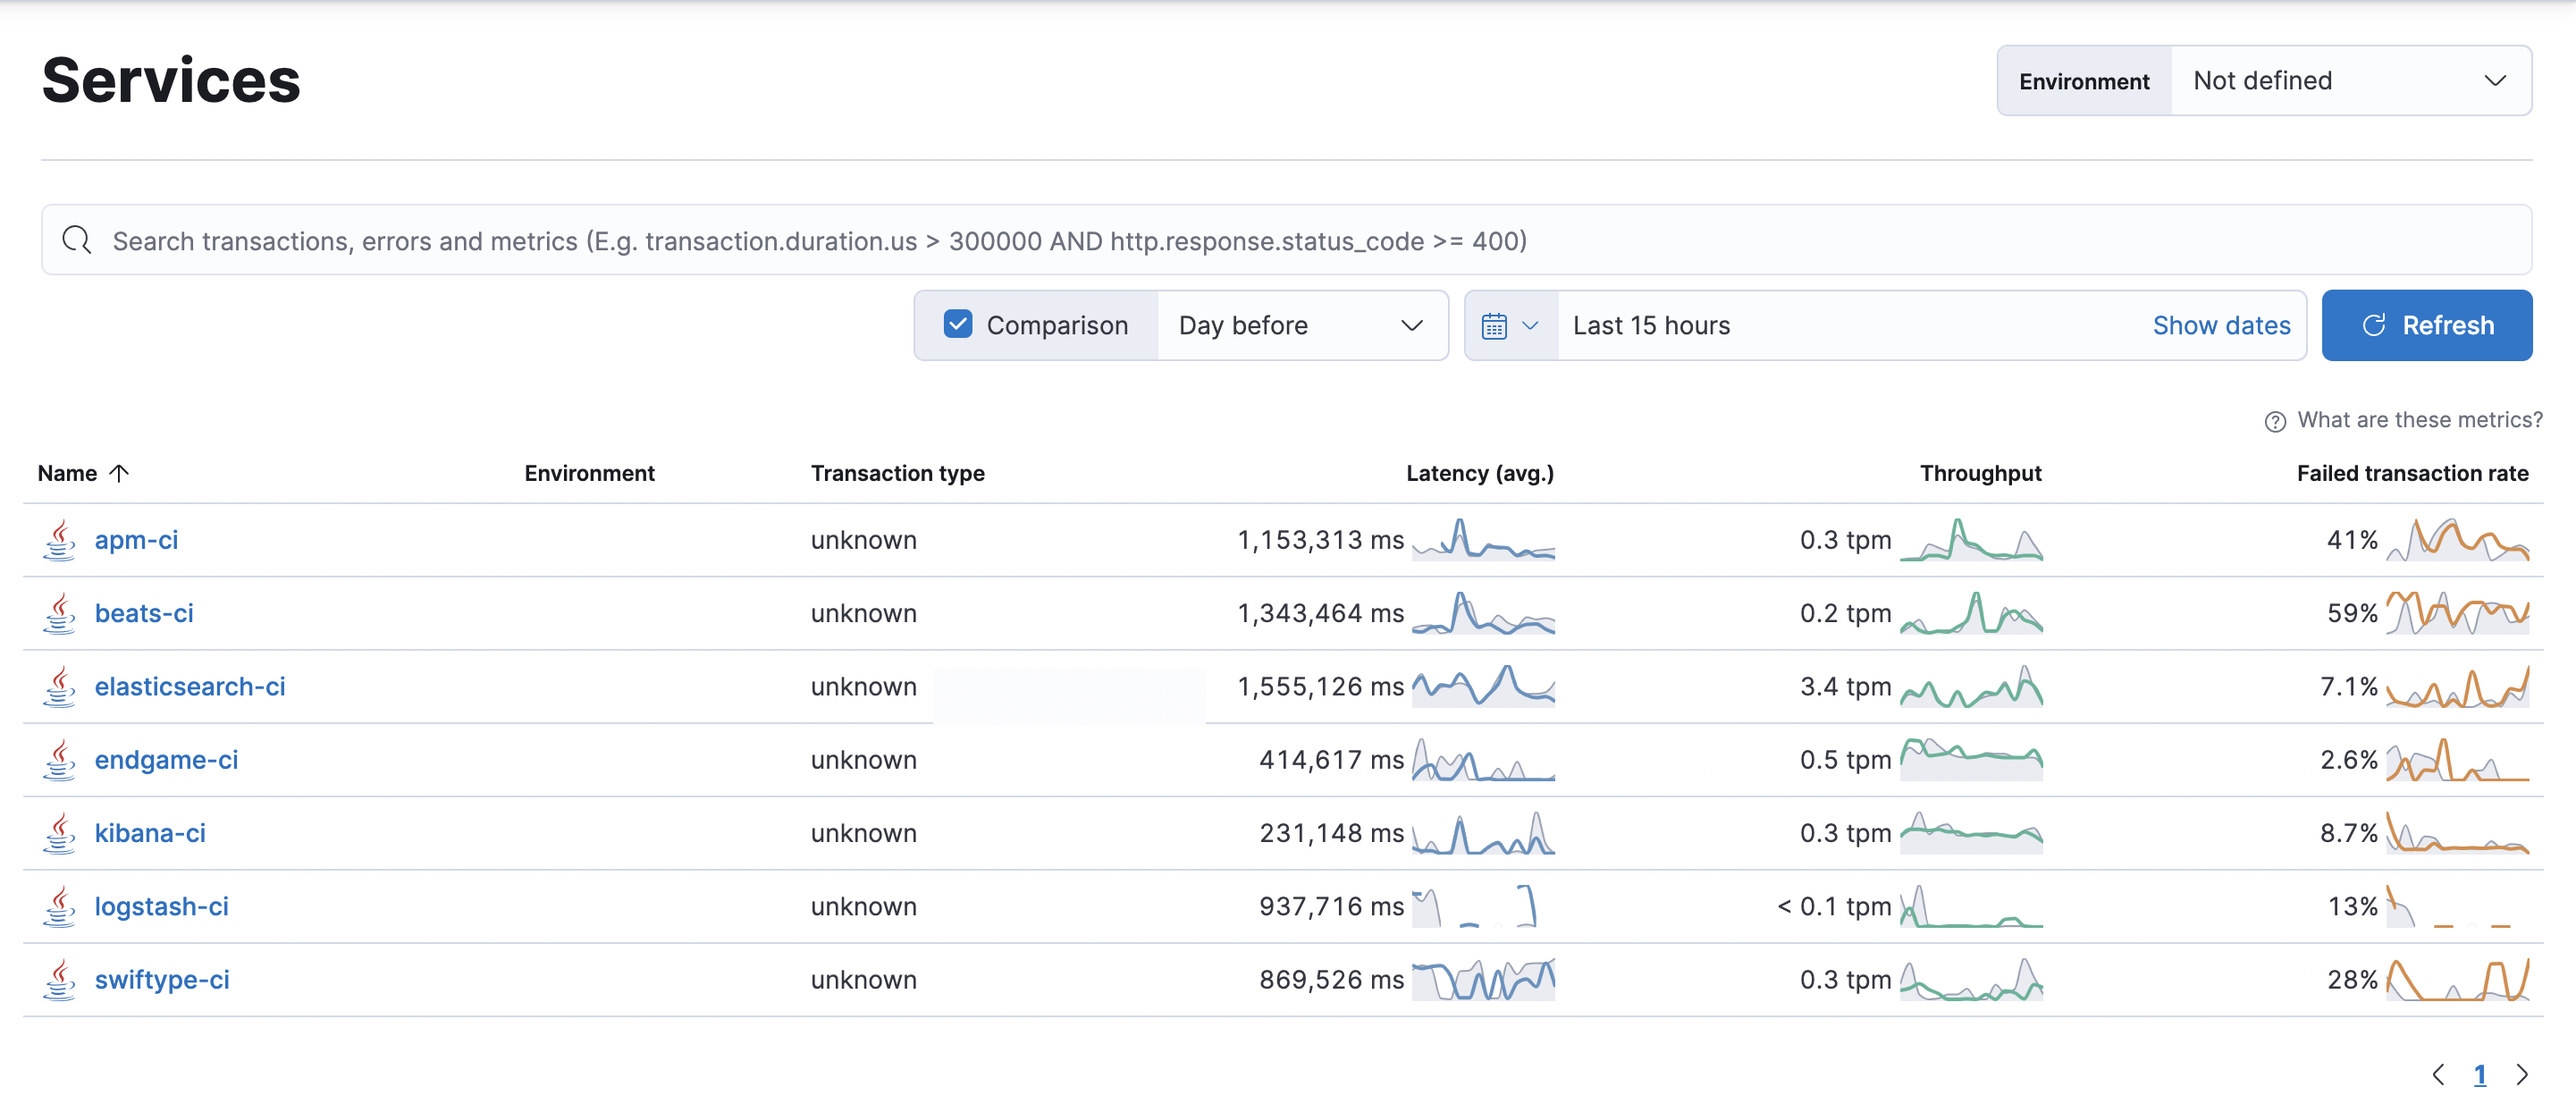
The Service page provides more granular insights into your CI/CD workflows by breaking down health and performance metrics by pipeline. To quickly view which pipelines experience the most errors, are the most frequently executed, or are the slowest, you can sort and filter the list.
Individual pipeline visibility
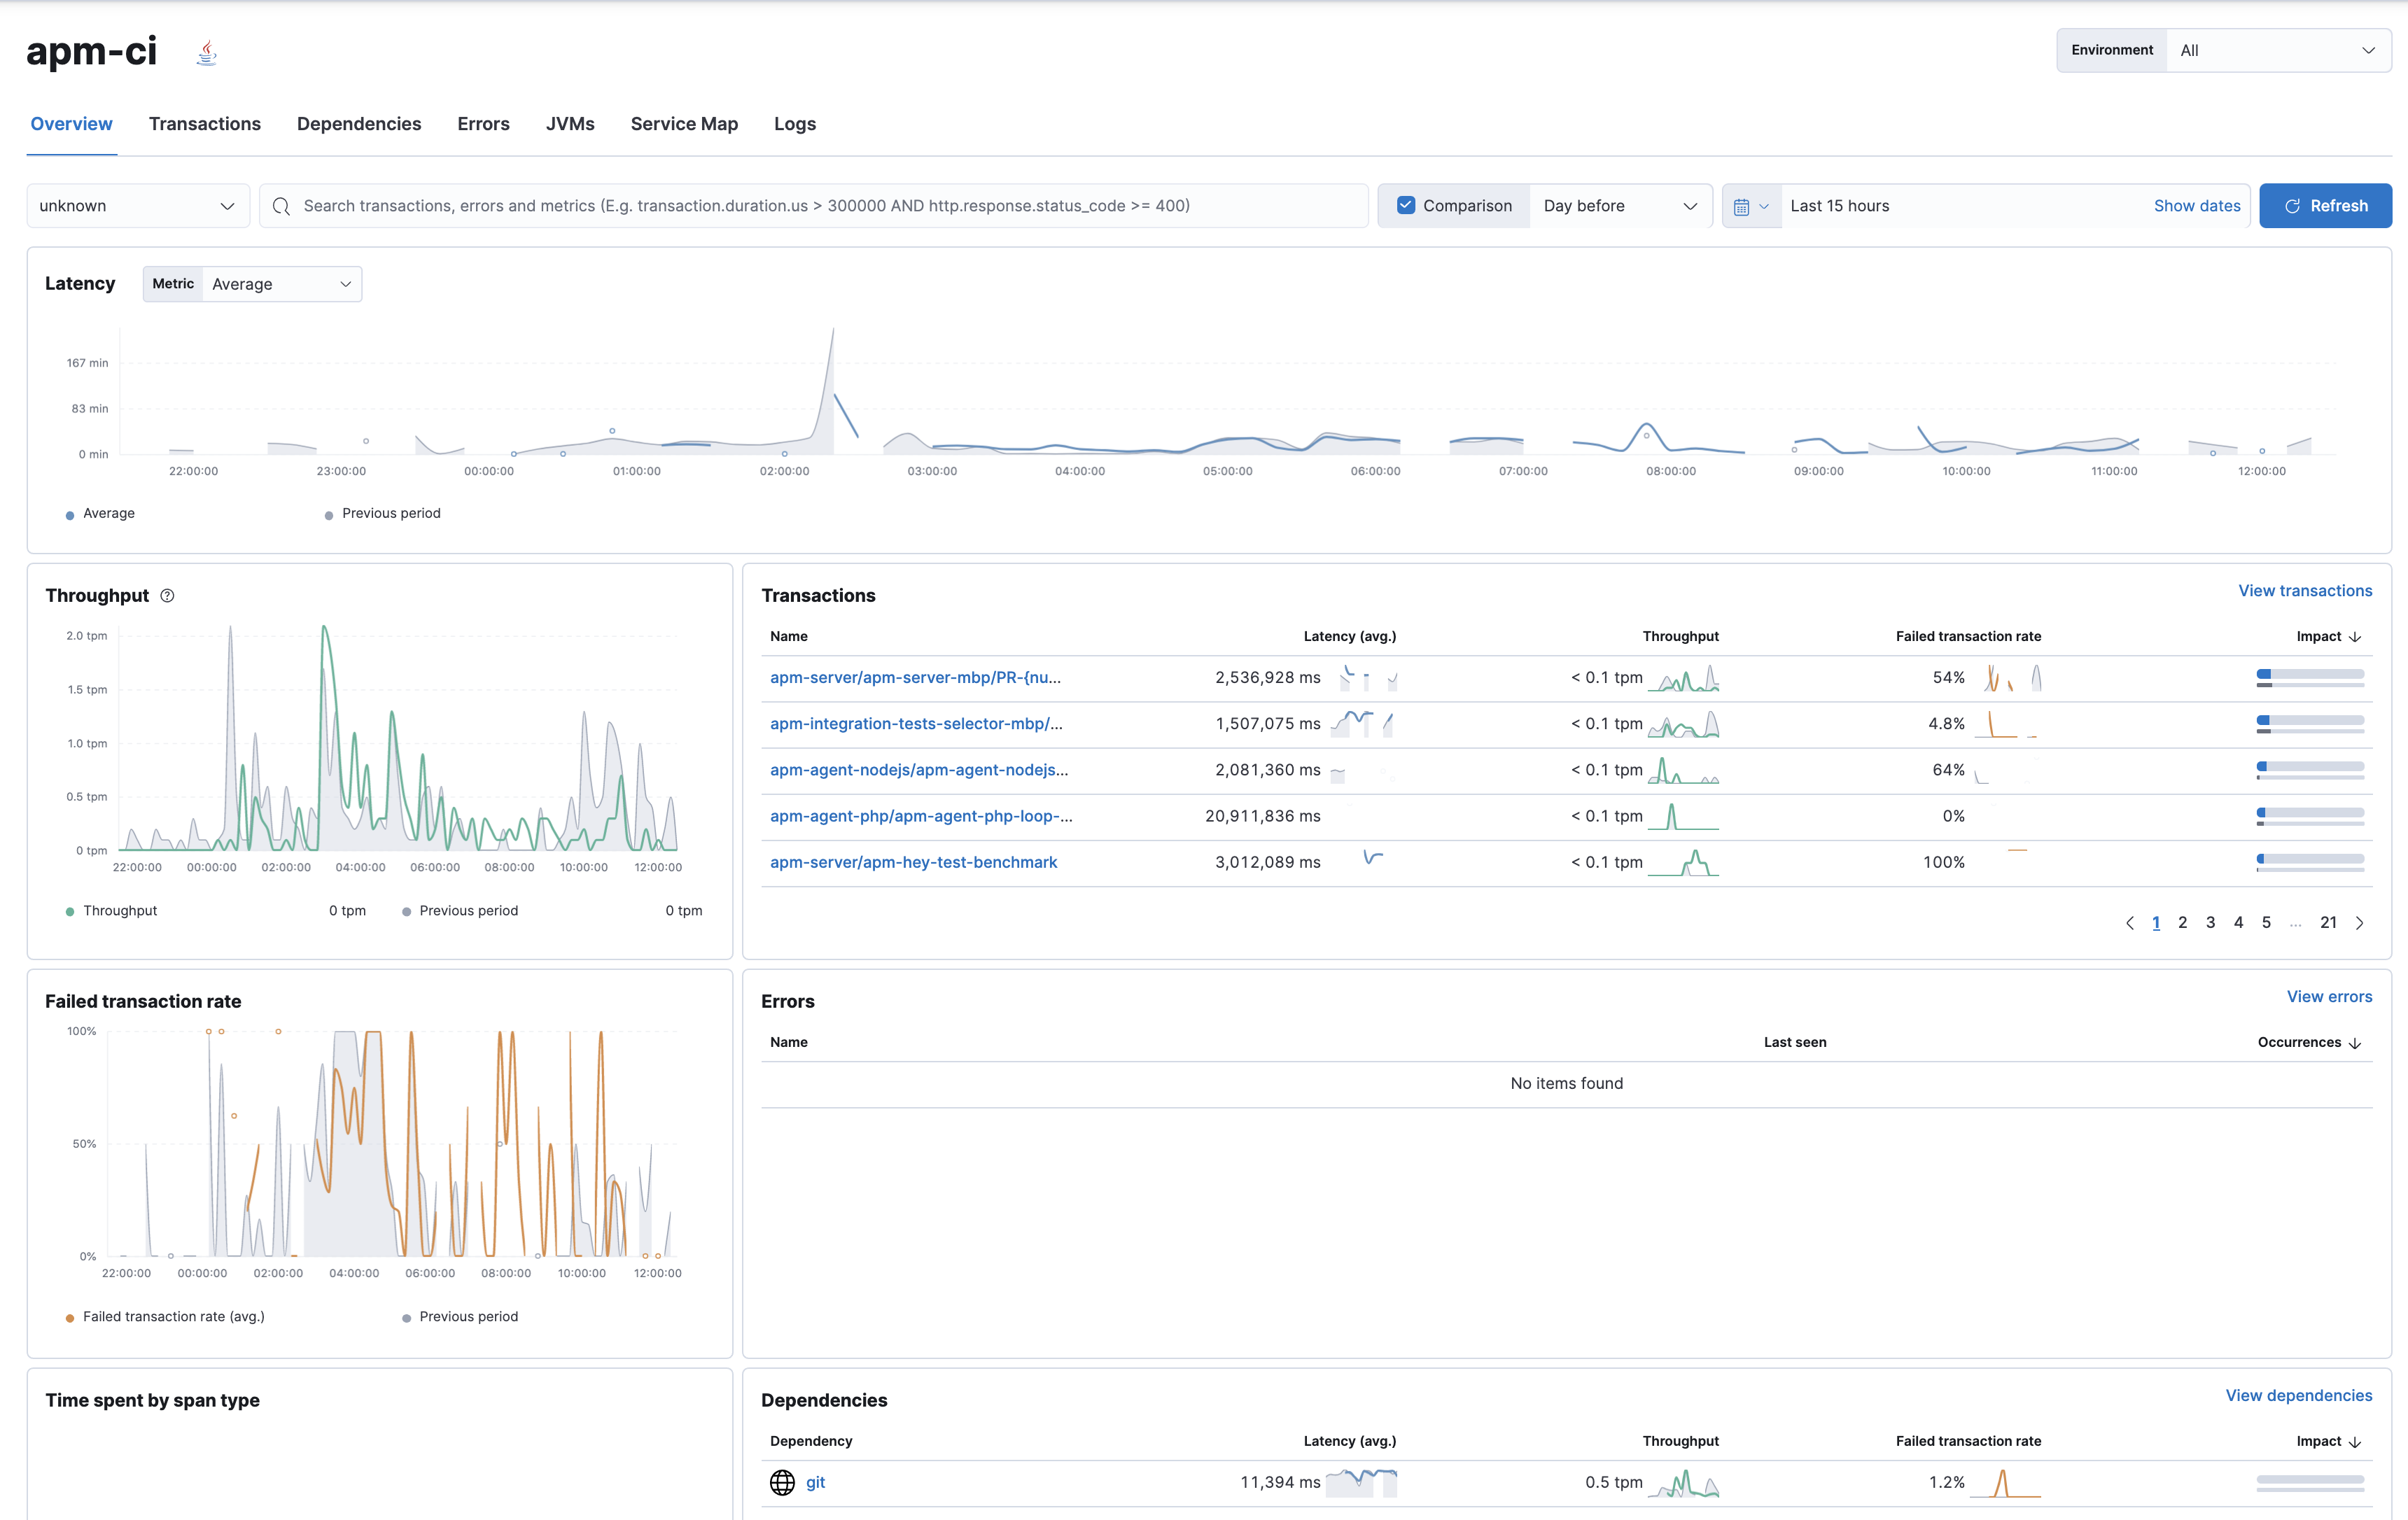
editOnce you’ve identified the pipeline you want to troubleshoot, you can drill down to get more detailed information about its performance over time. The pipeline summary shows a breakdown of duration and failure rates across the pipeline’s individual builds and jobs to spot slowdowns or failures.
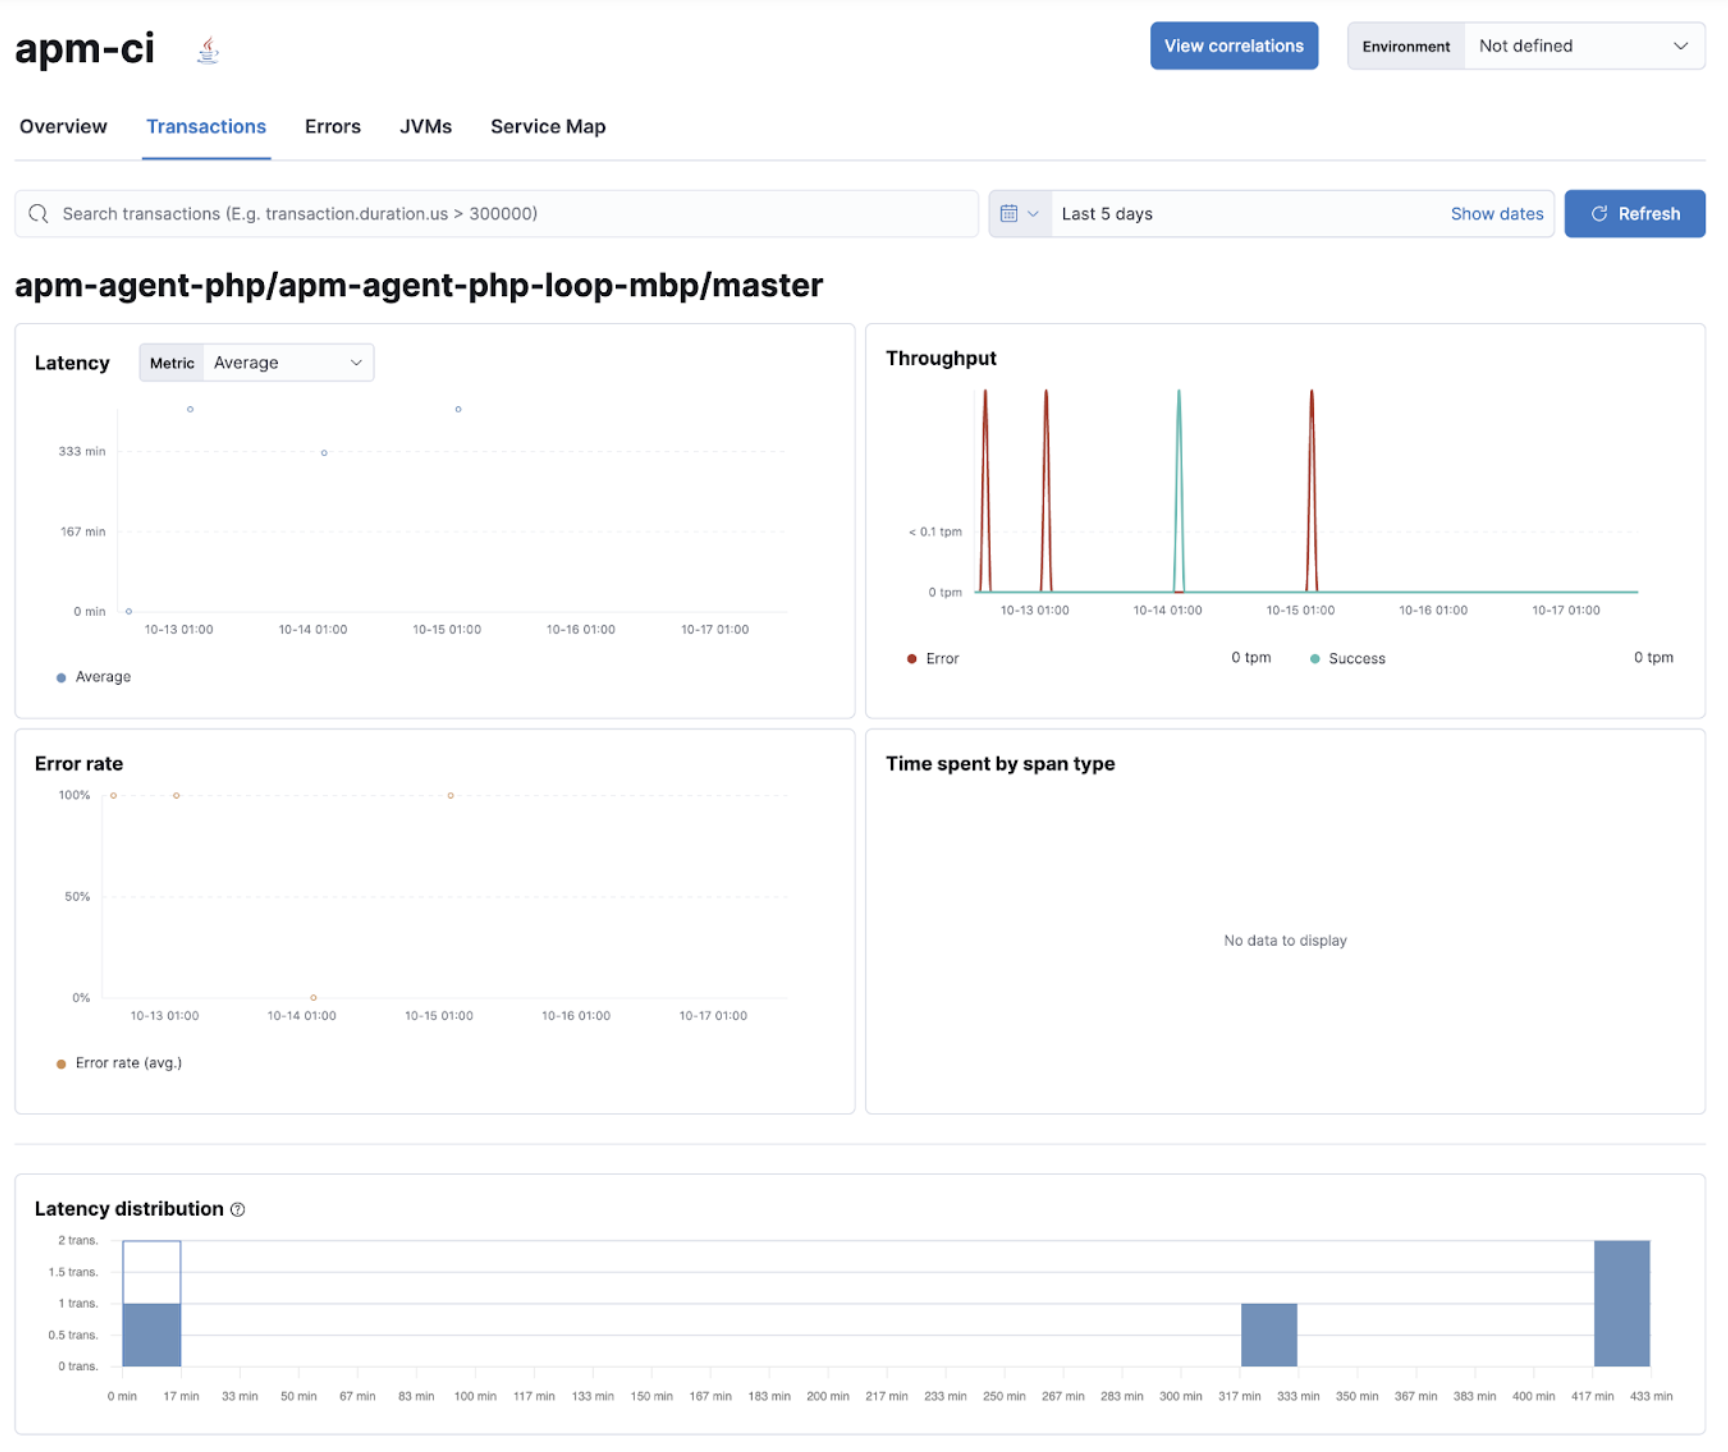
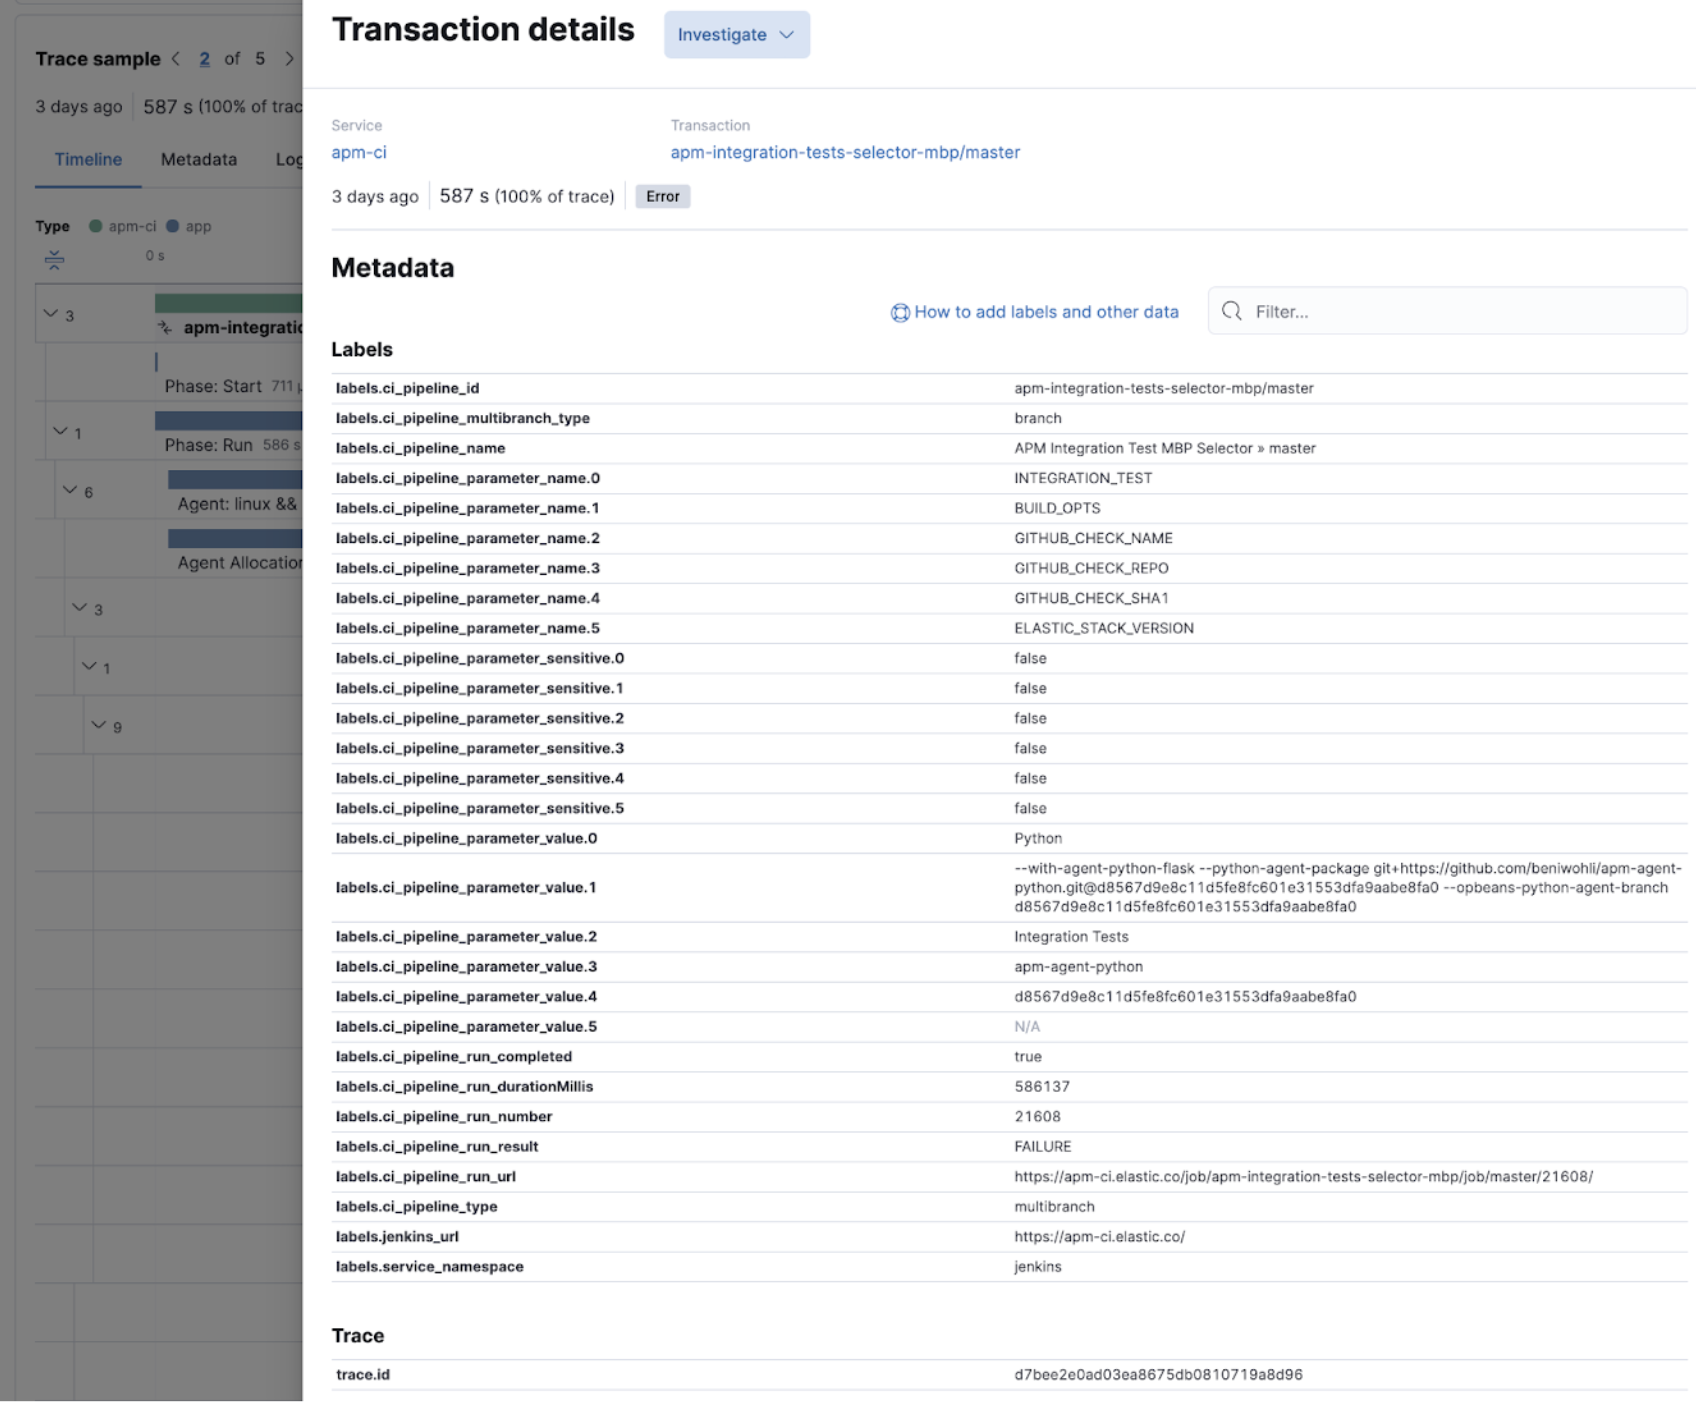
The pipelines and traditional jobs are instrumented automatically. If you spot a slow or failing build and need to understand what’s happening, you can drill into the trace view of the build to look for the high duration jobs or jobs with errors. You can then dig into the details to understand the source of the error.
To investigate further, you can view the details of the build captured as labels.
Store Jenkins pipeline logs in Elastic
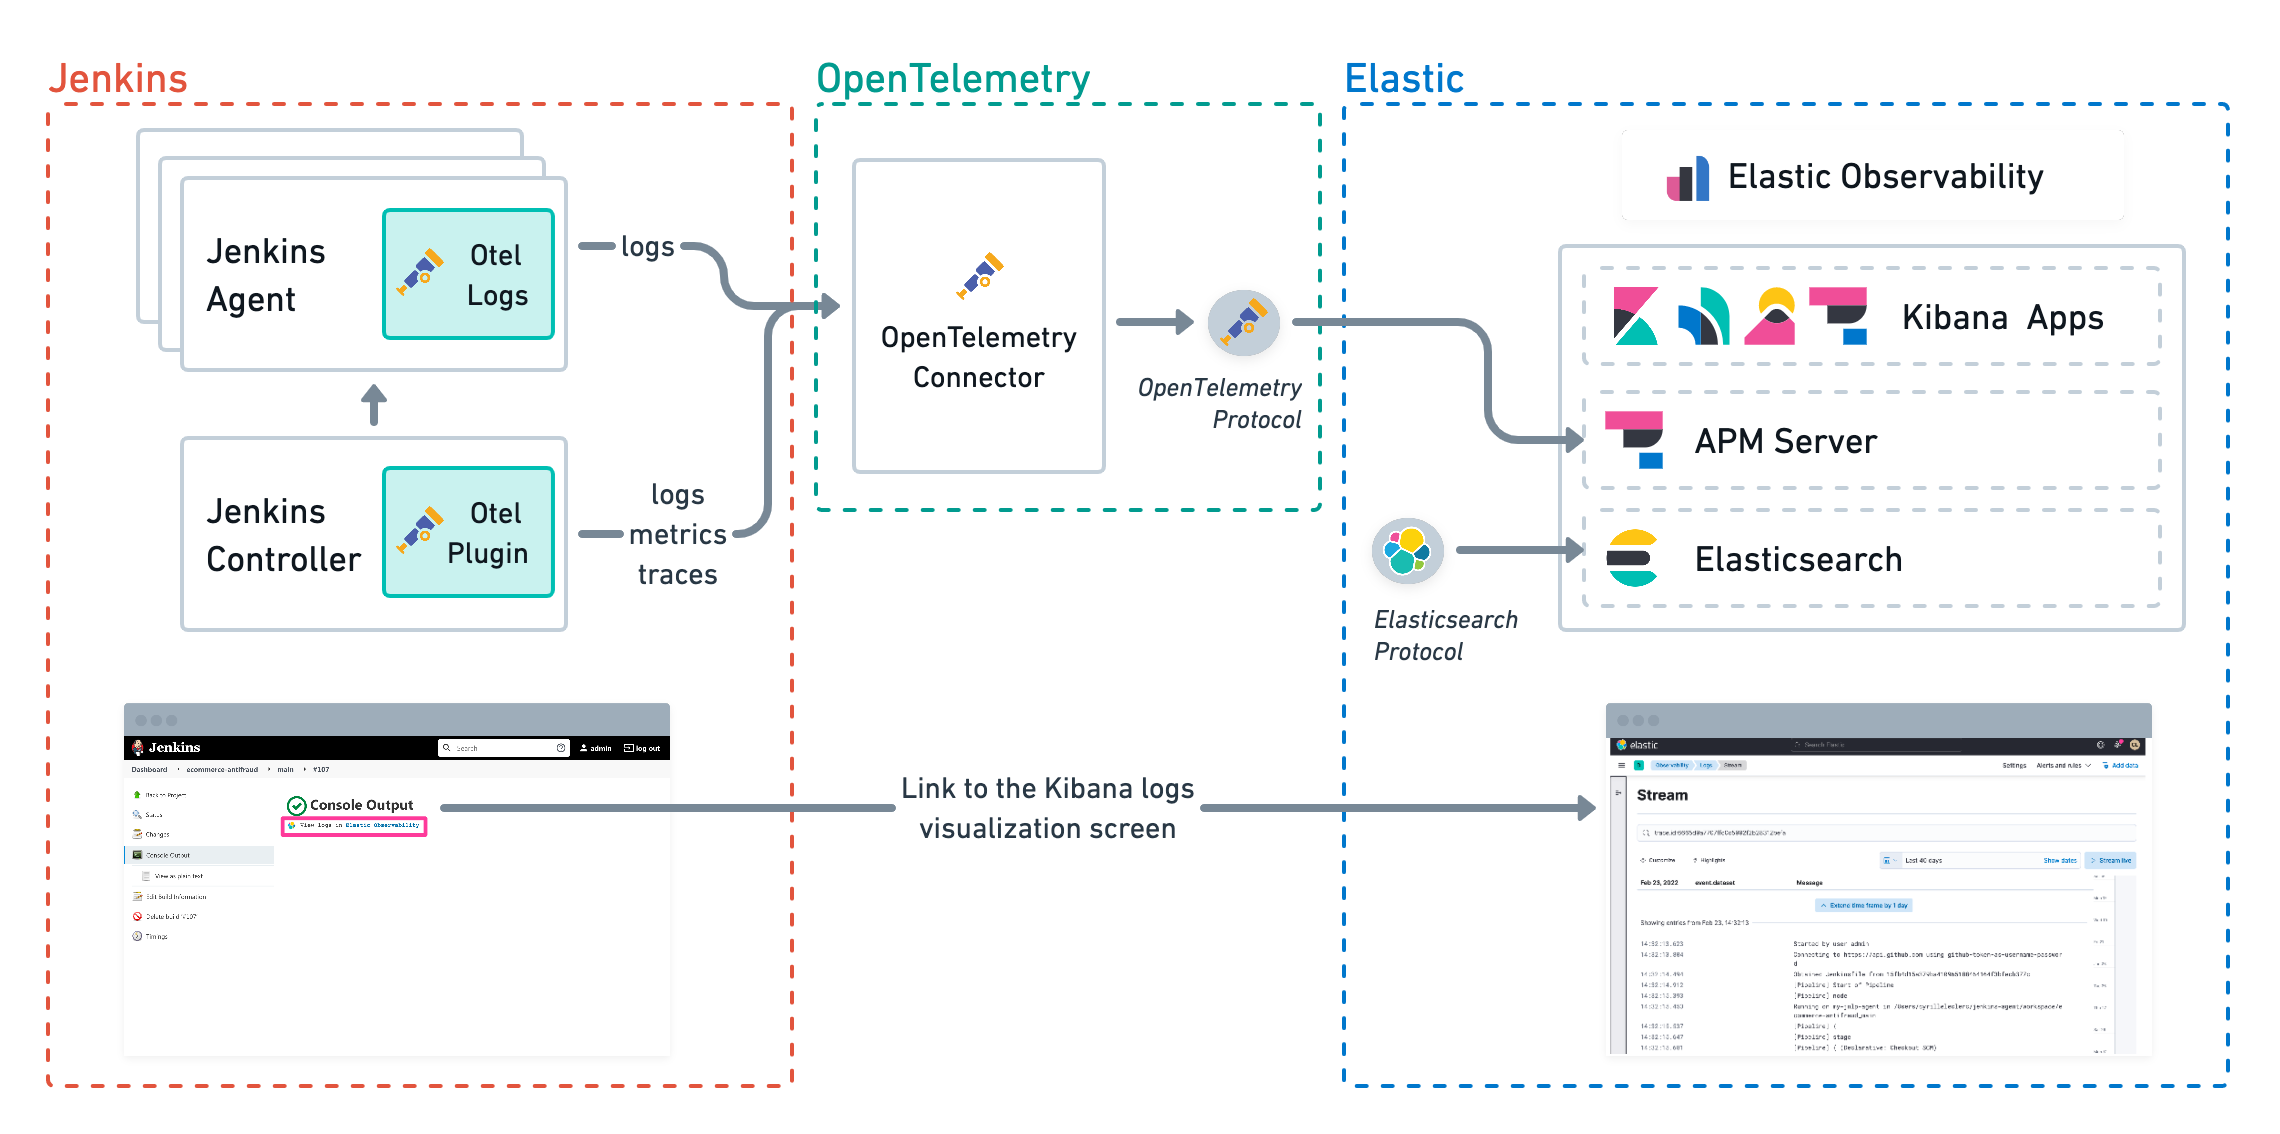
editJenkins pipeline logs can be sent through the OpenTelemetry Protocol (OTLP) to be stored in an observability backend alongside the traces of the pipeline builds and Jenkins health metrics. Storing logs in an observability backend provides several benefits including:
- Better observability, monitoring, alerting, and troubleshooting of the Jenkins instance thanks to the unification of all the signals in the observability backend.
- Better traceability and long term storage for builds so you can more easily audit the Software Delivery Lifecycle.
- Better scalability and reliability of Jenkins by greatly reducing the quantity of data stored in Jenkins and limiting the well known file system performance challenges of Jenkins when storing a large history of builds.
Requirements and configuration
editStoring Jenkins pipeline logs in Elastic requires:
- Elastic Observability version 8.1 or higher.
- The OpenTelemetry Protocol endpoint configured on the Jenkins OpenTelemetry Plugin to be reachable from the Jenkins Agents (i.e. don’t specify a localhost OTLP endpoint unless OpenTelemetry collectors are also deployed on the Jenkins Agents).
- When using OpenTelemetry Collectors, to set up a logs pipeline in addition to the traces and metrics pipelines.
To store pipeline logs in Elastic:
- Navigate to the OpenTelemetry section of the Jenkins configuration screen.
- Set the OTLP Endpoint.
- Use the Add Visualisation Observability Backend drop-down to select the Elastic Observability option.
- Set the Kibana base URL.
-
Click the Advanced button to choose a storage integration strategy. There are two options for storing pipeline logs in Elastic Observability:
- Store pipeline logs in Elastic and visualize logs both in Elastic and through Jenkins, which means you can view logs stored in Elastic on demand in the Jenkins UI. Read more in Visualize logs in both Kibana and Jenkins below.
- Store pipeline logs in Elastic and visualize logs exclusively in Elastic, which means logs will no longer be visible through the Jenkins UI. Read more in Visualize logs exclusively in Kibana below.
Visualizing logs both in Elastic and through Jenkins is recommended because it provides a more seamless user experience by continuing to render the logs in the Jenkins UI while allowing you to verify the Elasticsearch setup.
Visualize logs in both Kibana and Jenkins
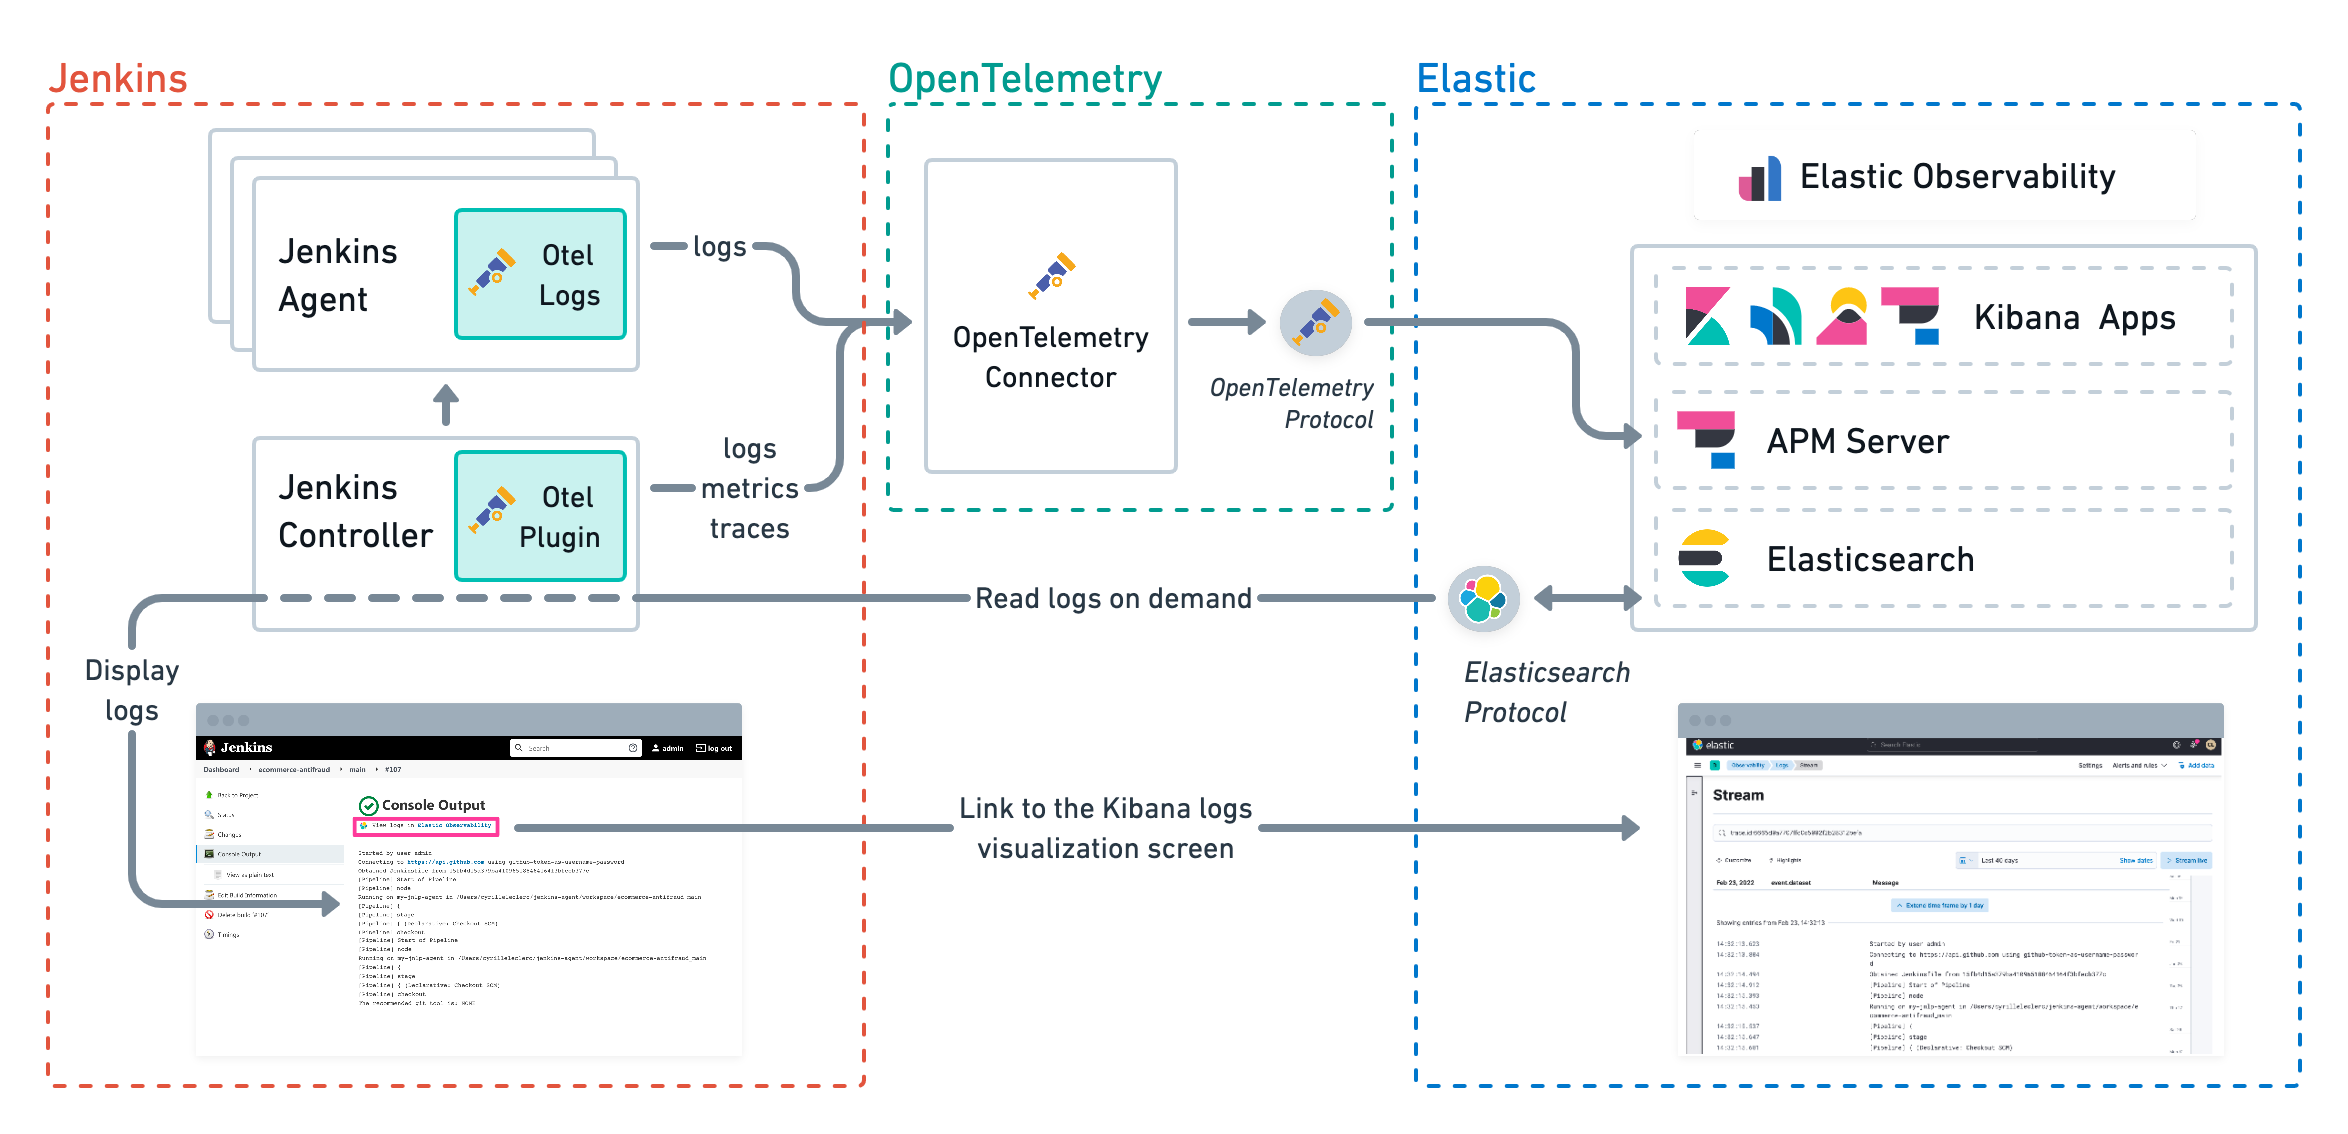
editThe Jenkins OpenTelemetry Plugin provides pipeline log storage in Elasticsearch while enabling you to visualize the logs in Kibana and continue to display them through the Jenkins pipeline build console.
This more advanced setup requires connecting the Jenkins Controller to Elasticsearch with read permissions
on the logs-apm.app and preferably on the Metadata of the ILM policy of this index template
(by default it’s the logs-apm.app_logs-default_policy policy).
Use "Validate Elasticsearch configuration" to verify the setup.
Visualize logs exclusively in Kibana
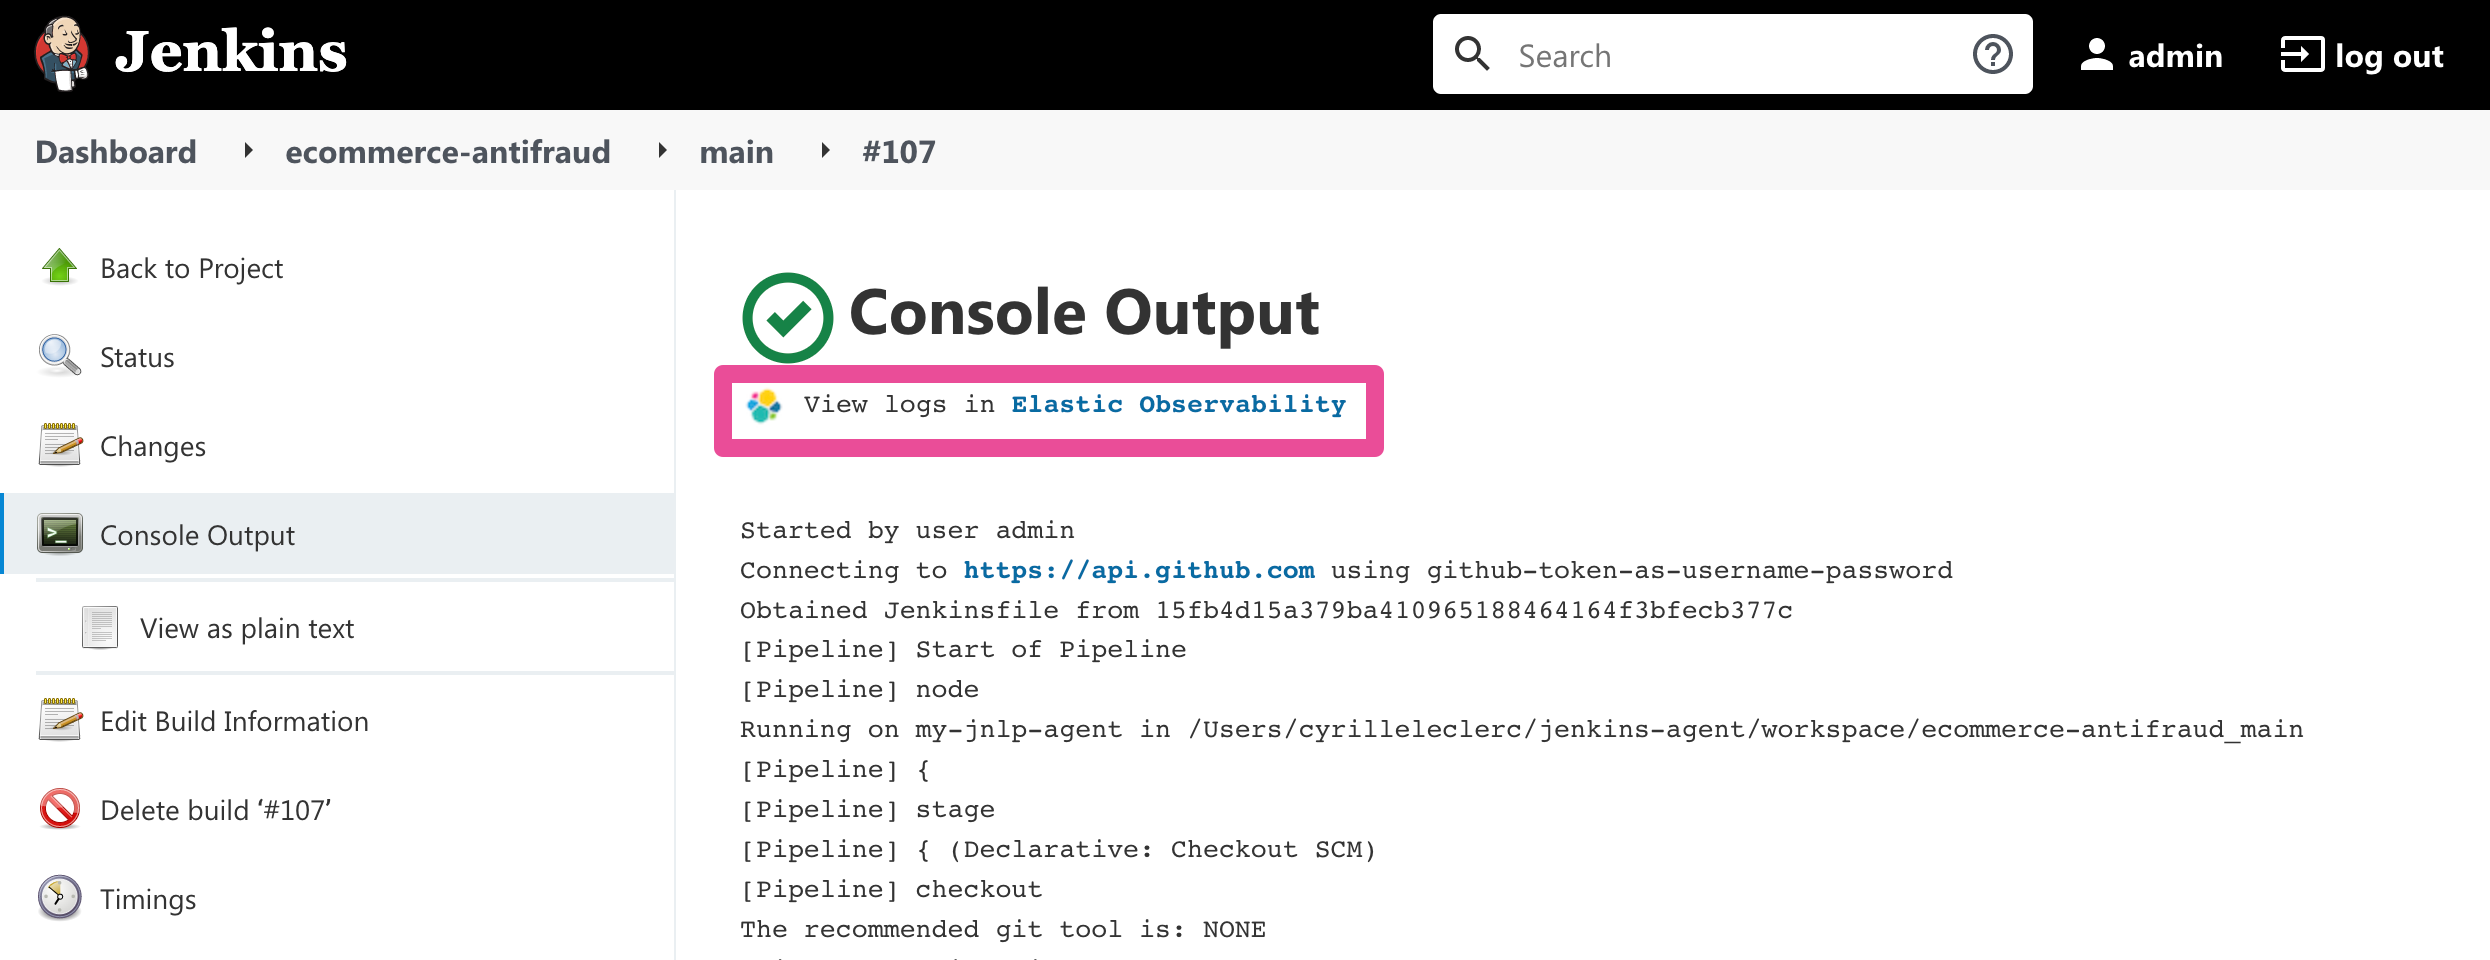
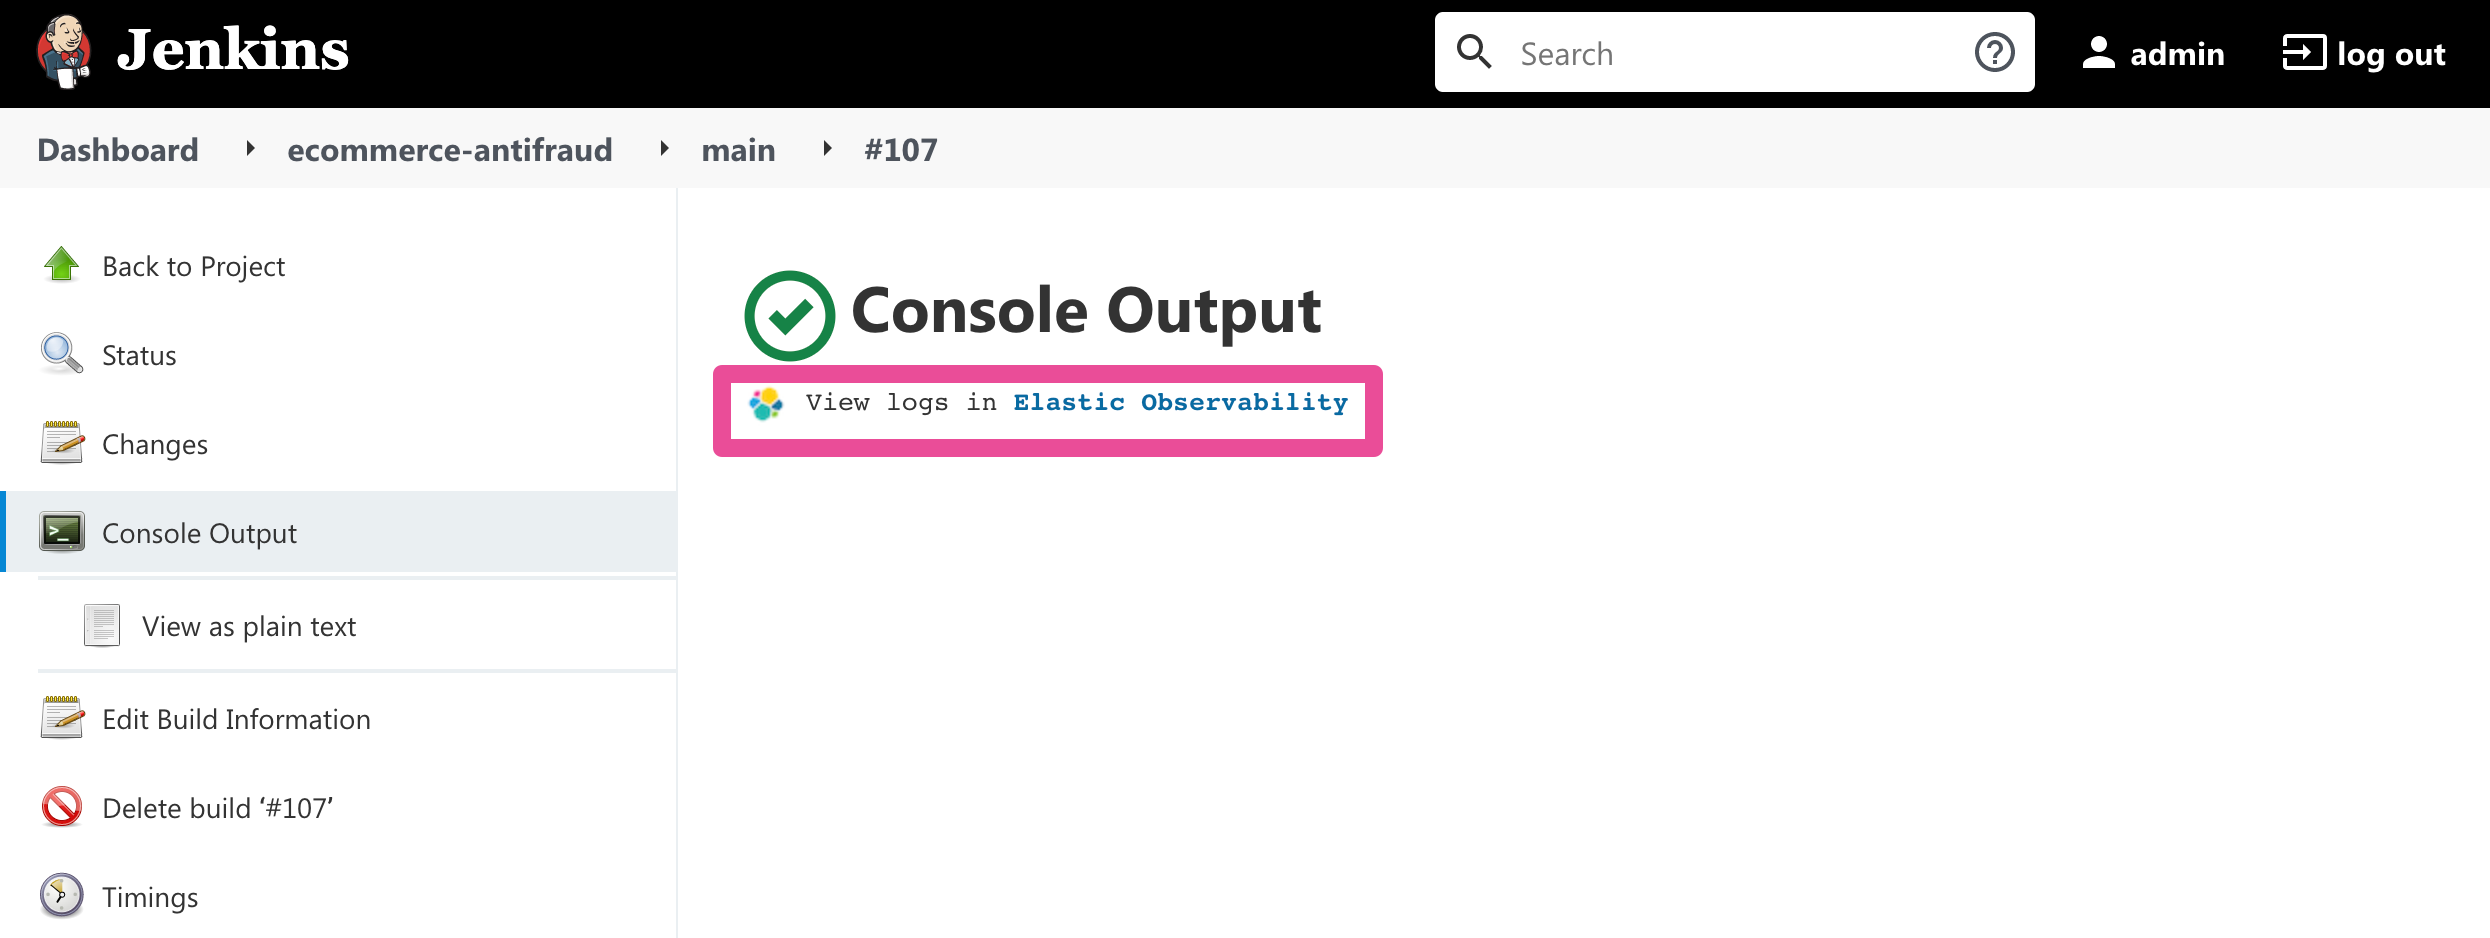
editVisualizing logs exclusively in Kibana involves a simpler setup that doesn’t require access to Elasticsearch from the Jenkins Controller. This is because the Jenkins pipeline build console displays a hyperlink to the Kibana logs visualization screen instead of displaying the logs in the Jenkins UI.
Instrument CI/CD pipelines
editObserving CI/CD pipelines is achieved by instrumenting the different CI/CD and DevOps tools. Elastic works with the Open Source communities leveraging OpenTelemetry to provide the best coverage.
Jenkins
editInstall the OpenTelemetry plugin
edit-
On the Jenkins UI, go to Manage Jenkins > Manage Plugins.
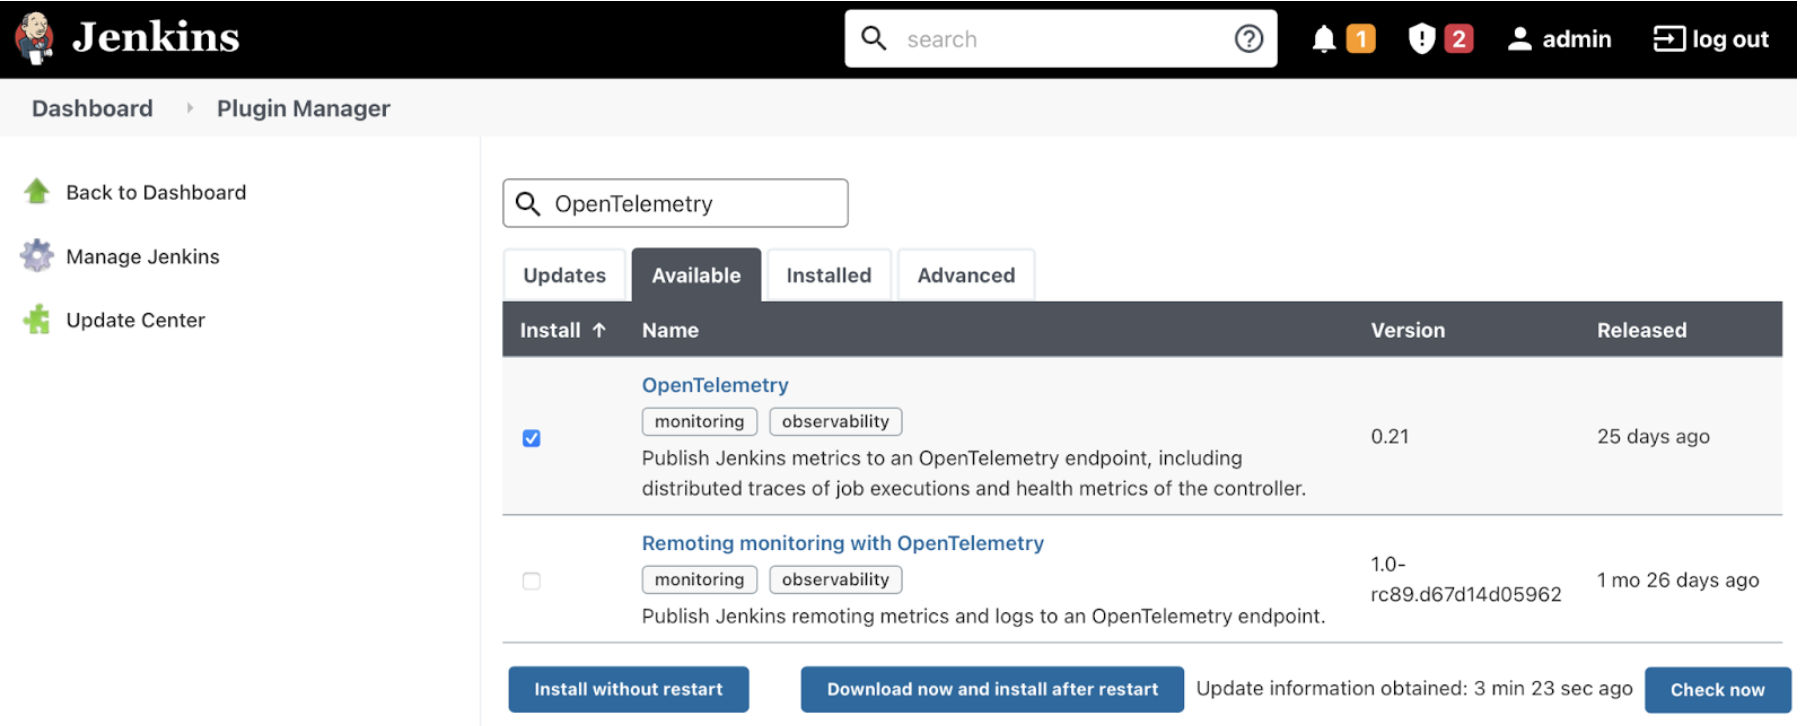
- Click the Available tab, and search for OpenTelemetry.
-
Select the OpenTelemetry checkbox and then click Download now and install after restart.
To verify that the plugin is installed, click the Installed tab, and search for OpenTelemetry Plugin.
Configure the OpenTelemetry plugin
editThe OpenTelemetry plugin needs to be configured to report data to an OpenTelemetry service. In addition, you will need the endpoint of the OpenTelemetry service, the type of authentication, and the access credentials.
- On the Jenkins UI, go to Manage Jenkins > Configure System.
- Go to the OpenTelemetry Plugin section.
-
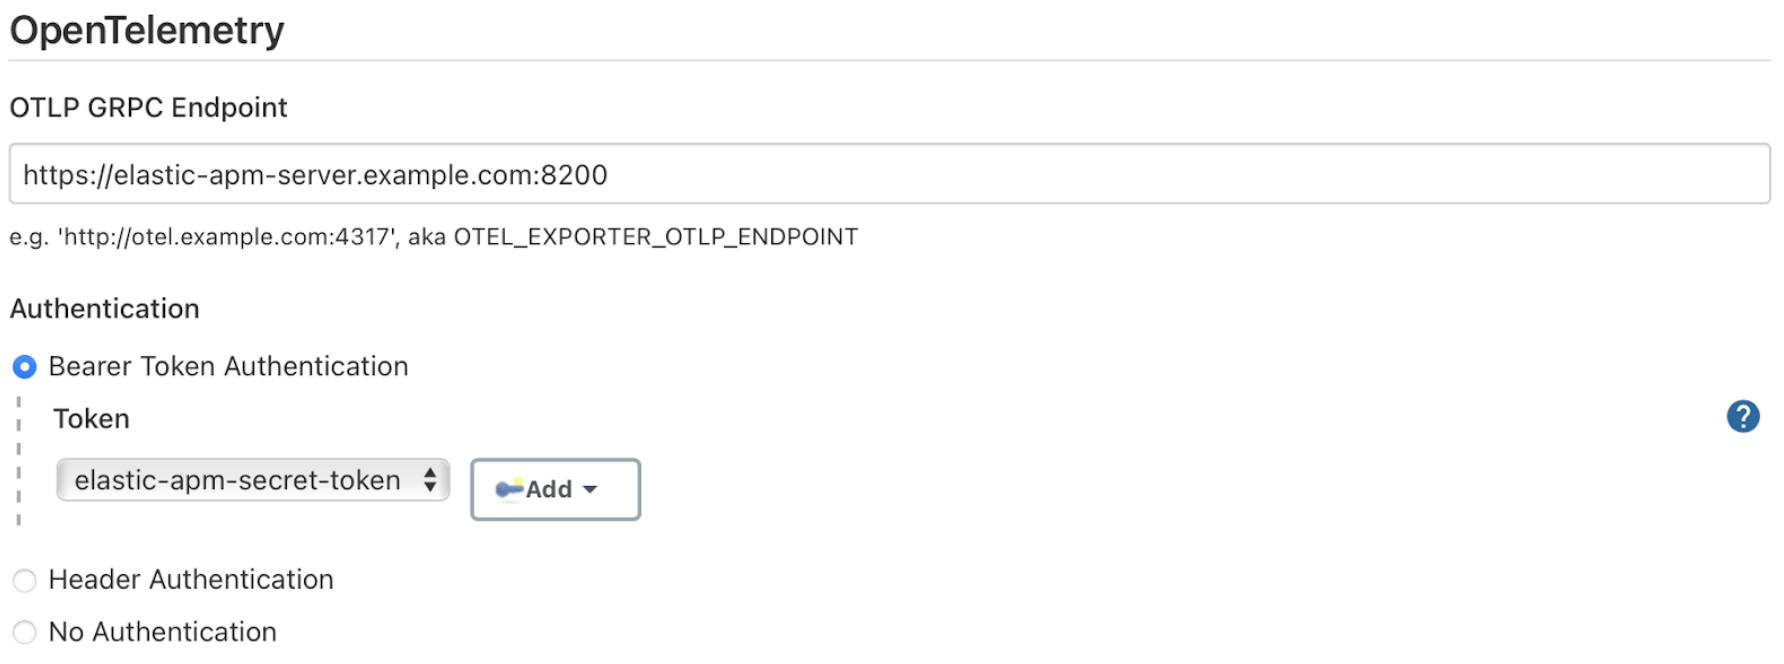
Configure your OpenTelemetry endpoint and authentication using the Elastic APM Server URL and the APM Server authentication:
-
If using the Elastic APM secret token authorization, select a Bearer Authentication Token, and add the token as a Jenkins secret text credential.
-
If using the Elastic API Key authorization, define the Header Authentications:
-
Header name:
"Authorization" -
Header value: a secret text credential with the value of
"ApiKey an_api_key"(an_api_keyis the value of the secret key)
-
Header name:
-
-
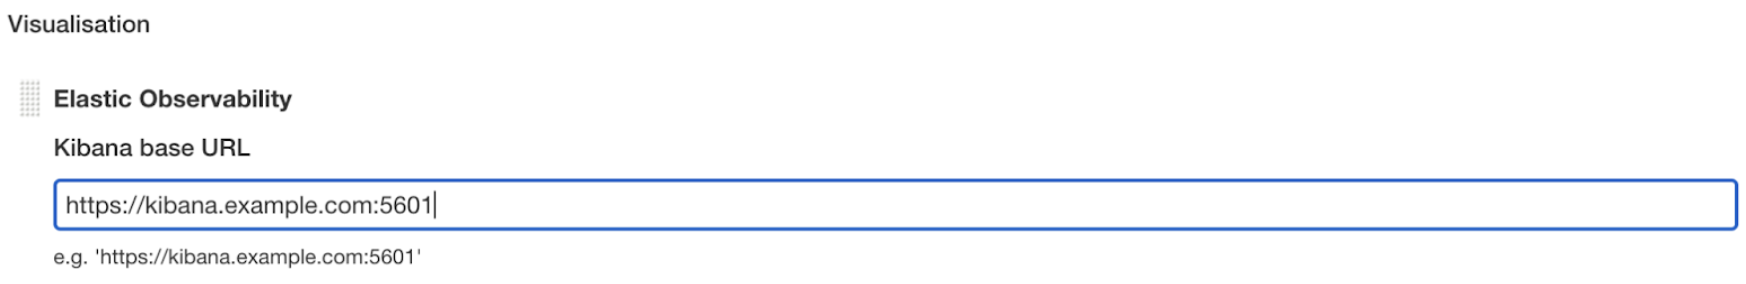
Go to Add Visualisation Observability Backend and define the URL for your Kibana server.
-
Finally, there are additional settings to configure:
- Endpoint certificates to use in communications.
- The service name and service namespace sent to the OpenTelemetry service.
- Timeouts and batch process times.
-
Any steps you may want to omit from the data you send.
You can export the OpenTelemetry configuration as environment variables to use them with other tools like otel-cli, Ansible Otel plugin, and so on. If you enable this option, consider that you can potentially expose the credentials in the console output.
To learn more about the integration of Jenkins with Elastic Observability, see OpenTelemetry.
Install Jenkins dashboards in Kibana
editThere are out of the box Kibana dashboards that help visualize some metrics for the CI/CD platform.
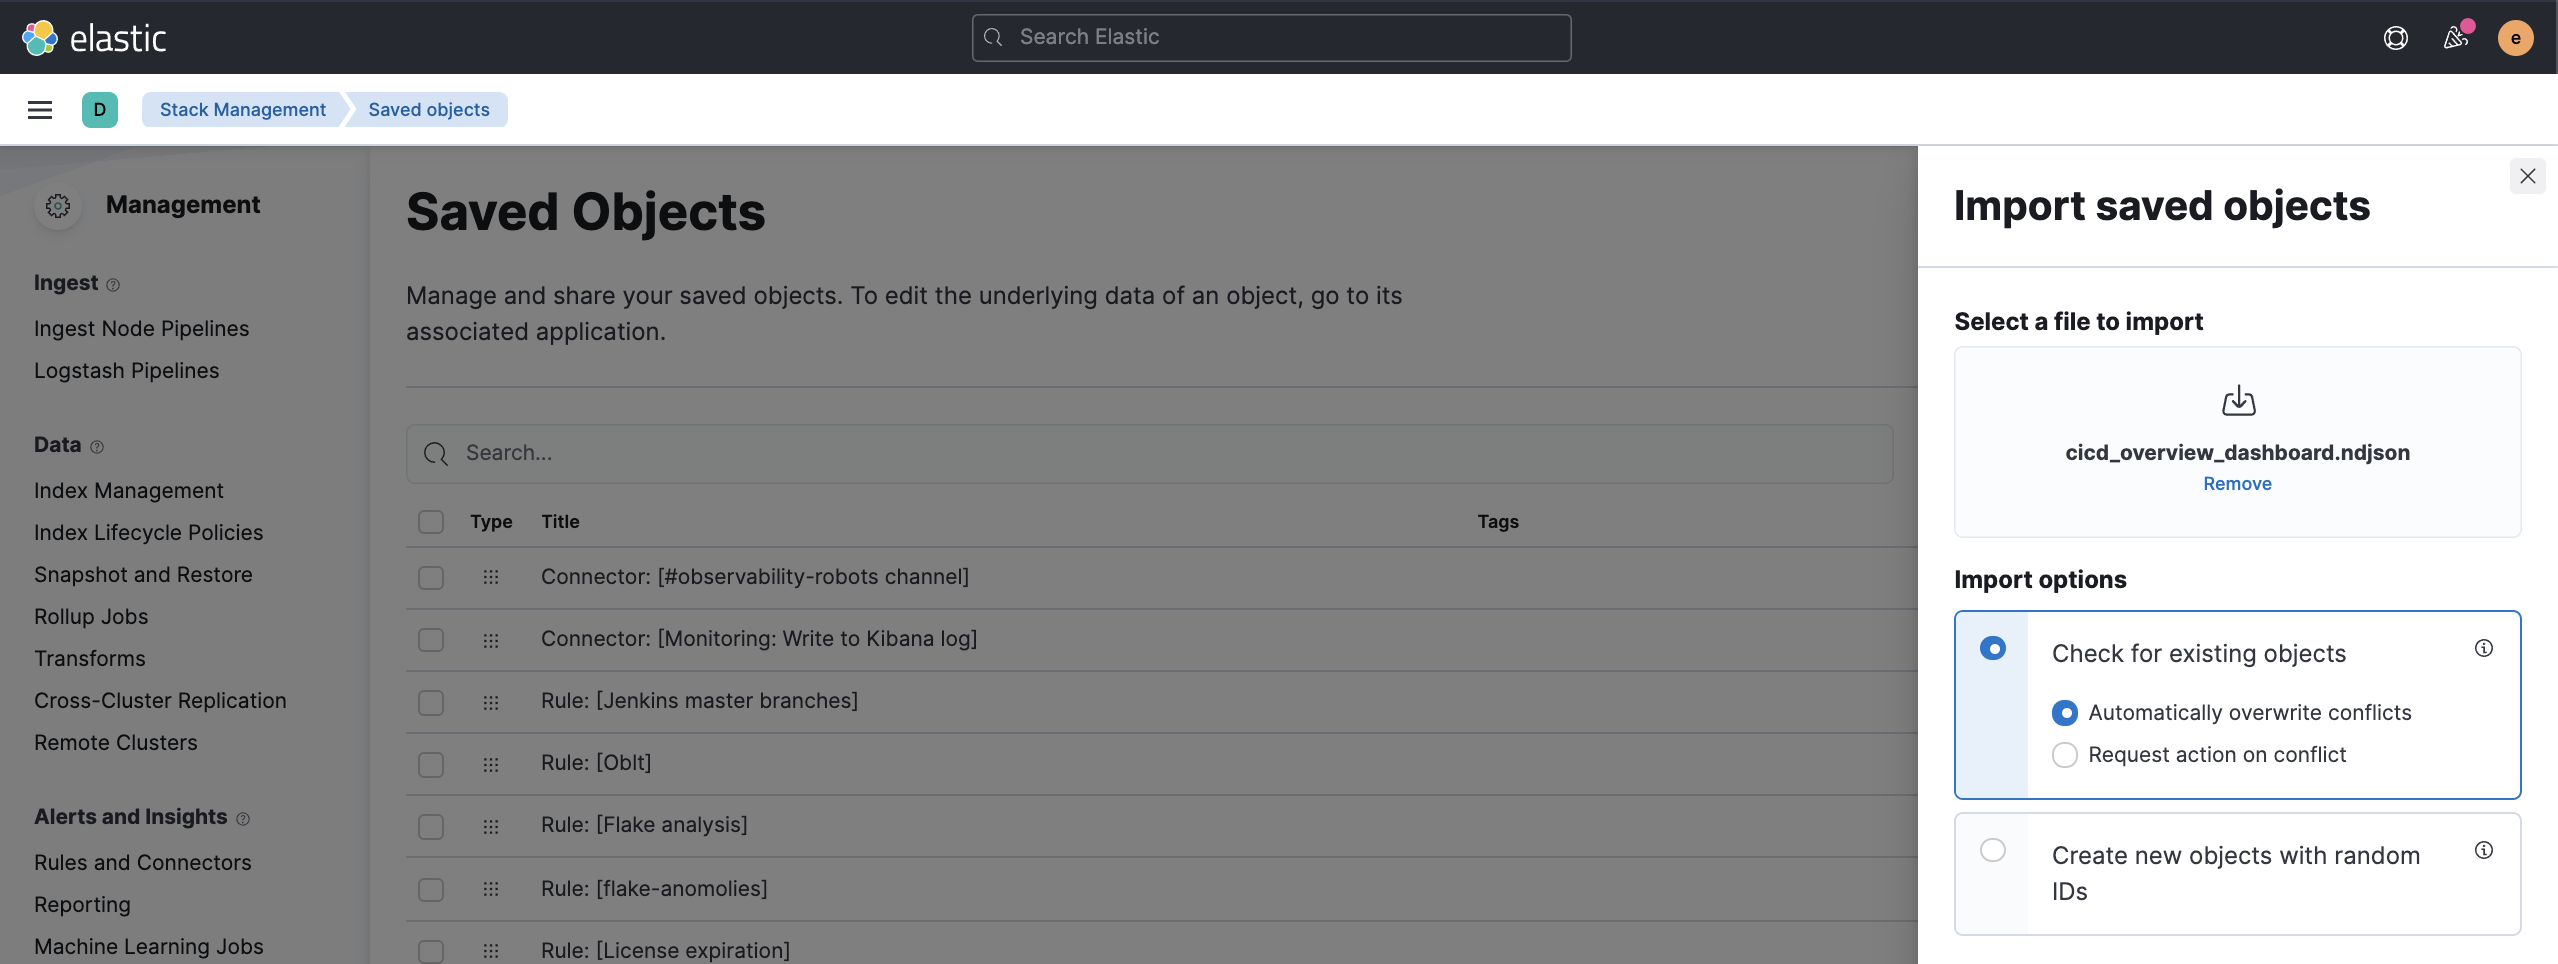
Using the Import API or the Kibana UI, you can install dashboards that are compatible with version 7.12 or higher.
For instance, you can follow the below steps:
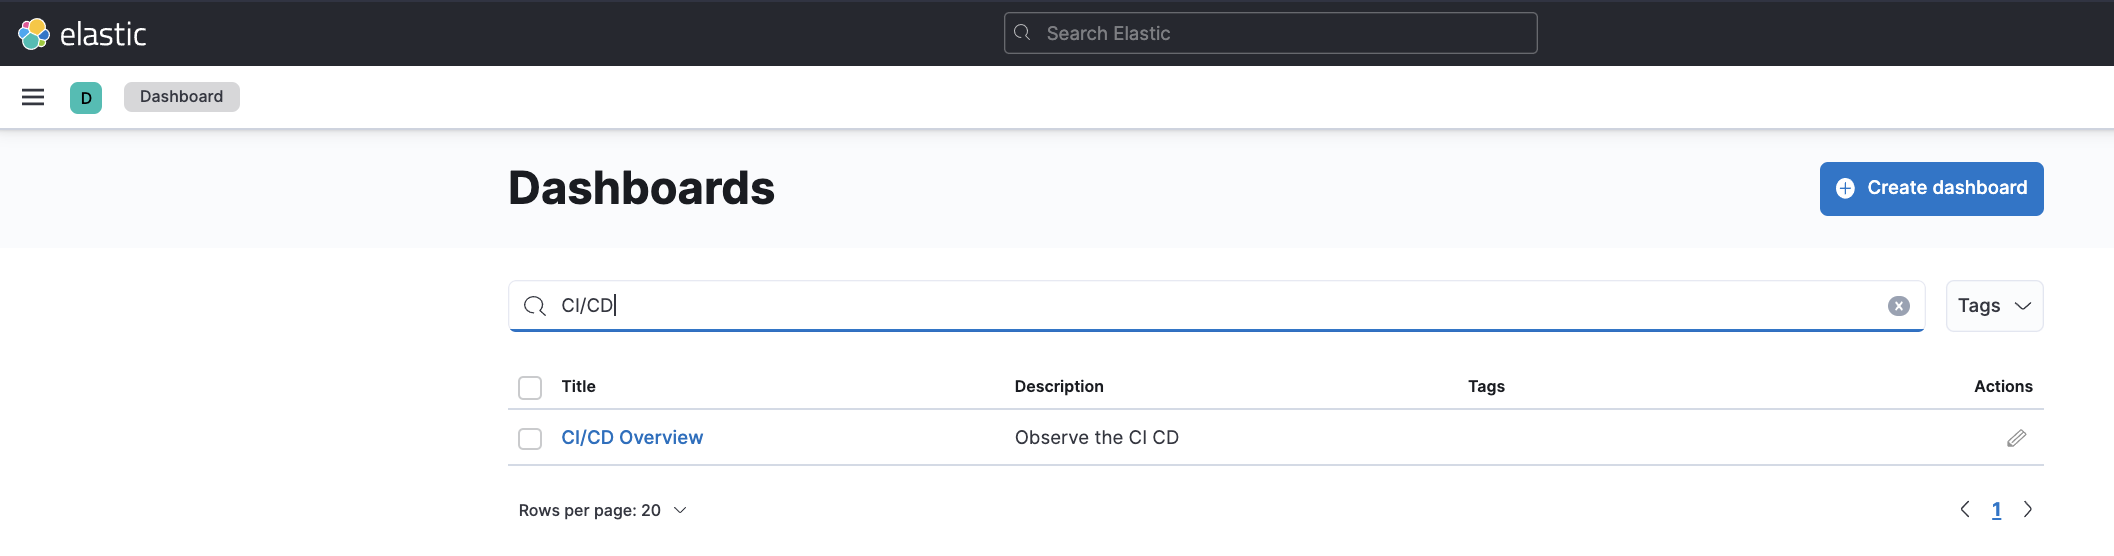
- Import the dashboard in the Kibana UI
- The new dashboard is now ready to be used:
Maven
editThe Maven OpenTelemetry extension integration provides comprehensive visibility into all of your Maven builds. The extension generates traces for each build and performance metrics to help you understand which Maven goals or Maven submodules are run the most, how often they fail, and how long they take to complete.
The context propagation from CI pipelines (Jenkins job or pipeline) is passed to the Maven build
through the TRACEPARENT and TRACESTATE environment variables that match the W3C Trace Context specification.
Therefore, everything that happens in the CI platform is also shown in the traces.
You can configure your Maven project with the Maven OpenTelemetry extension. For example, you can add the following snippet to your pom.xml file:
<project>
  ...
  <build>
    <extensions>
      <extension>
          <groupId>io.opentelemetry.contrib</groupId>
          <artifactId>opentelemetry-maven-extension</artifactId>
          <version>1.12.0-alpha</version>
      </extension>
    </extensions>
  </build>
</project>
You can now trigger to send the Maven build reporting performance data to Elastic Observability by passing the configuration details as environment variables:
export OTEL_EXPORTER_OTLP_ENDPOINT="<YOUR_APM_SERVER_URL>:8200"
export OTEL_EXPORTER_OTLP_HEADERS="Authorization=Bearer an_apm_secret_token"
export OTEL_TRACES_EXPORTER="otlp"

mvn verify
You can instrument Maven builds without modifying the pom.xml file using the Maven command line argument “-Dmaven.ext.class.path=…”
export OTEL_EXPORTER_OTLP_ENDPOINT="<YOUR_APM_SERVER_URL>:8200"
export OTEL_EXPORTER_OTLP_HEADERS="Authorization=Bearer an_apm_secret_token"
export OTEL_TRACES_EXPORTER="otlp"

mvn -Dmaven.ext.class.path=path/to/opentelemetry-maven-extension.jar verify
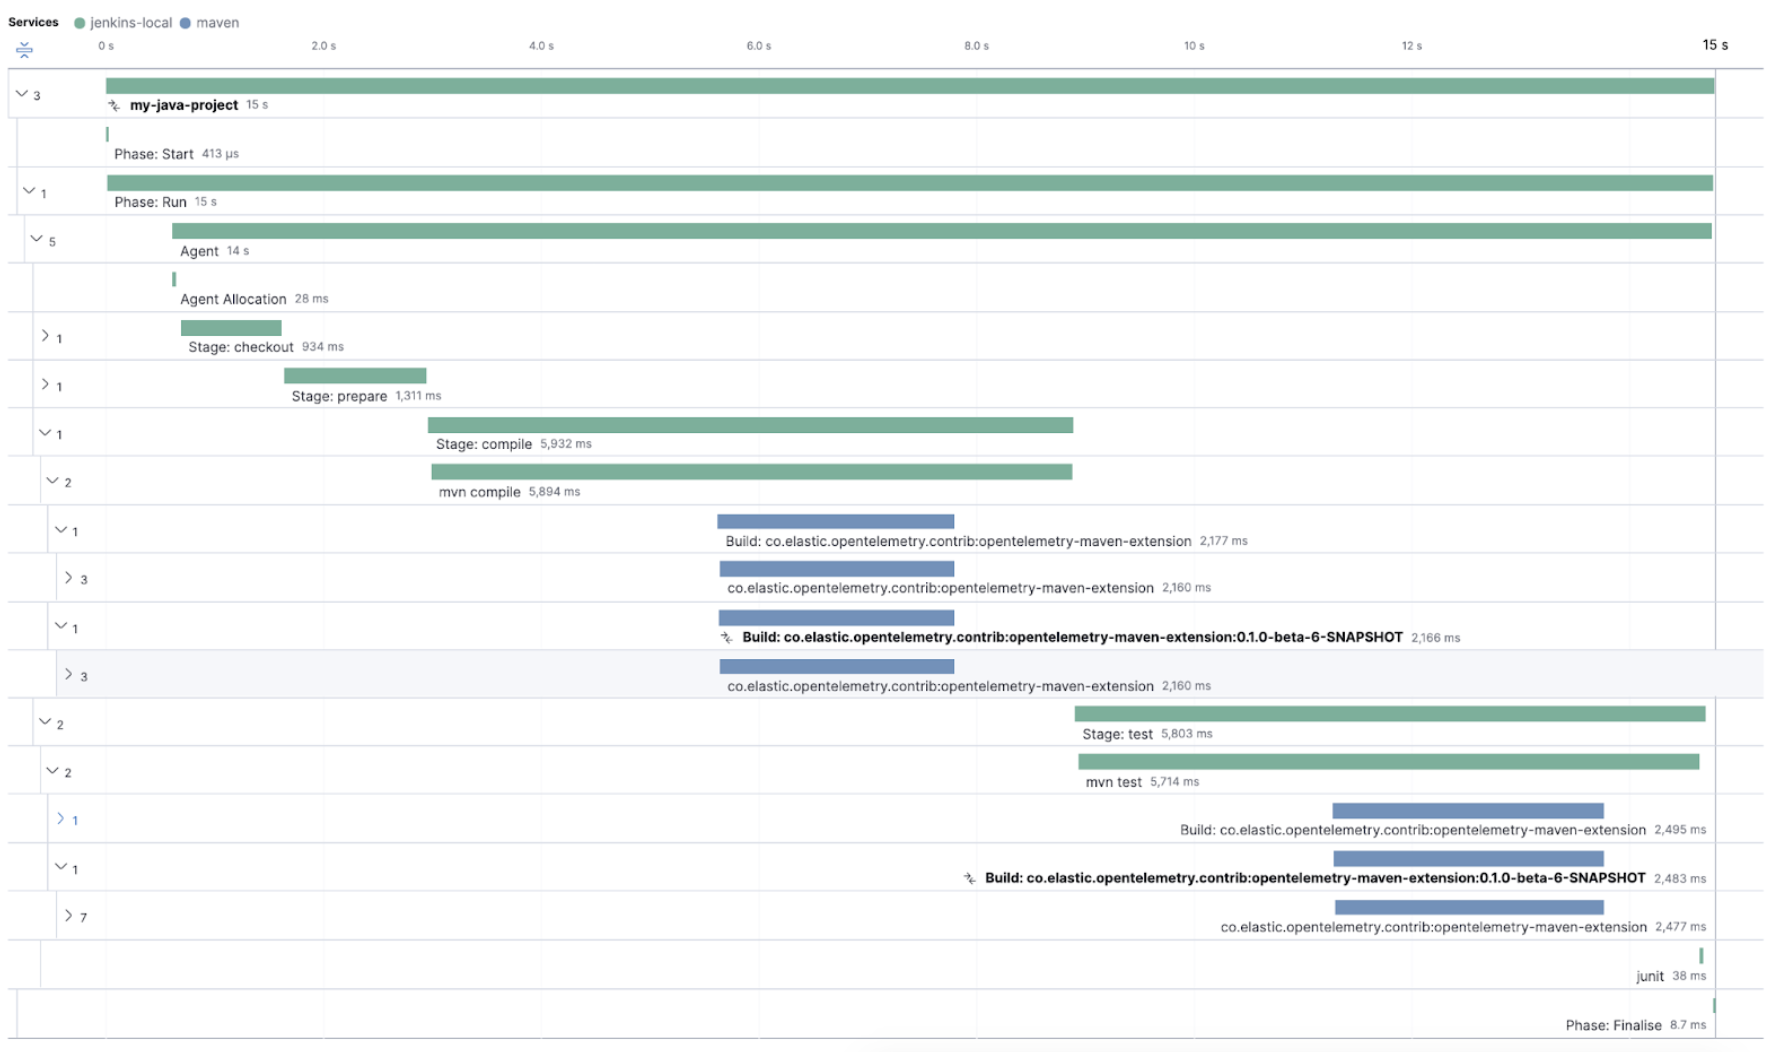
You can also trigger your Maven builds from the CI platform and visualize the end-to-end pipeline execution in Elastic Observability, including the detailed steps of your CI pipeline and the Maven build.
When invoking Maven builds with Jenkins, it’s unnecessary to use environment variables
to configure the Maven build (OTEL_EXPORTER_OTLP_ENDPOINT…) to rely on the Jenkins capability
to inject OpenTelemetry configuration as environment variables. For more details, refer to Install the OpenTelemetry plugin.
To learn more, see the integration of Maven builds with Elastic Observability.
Ansible
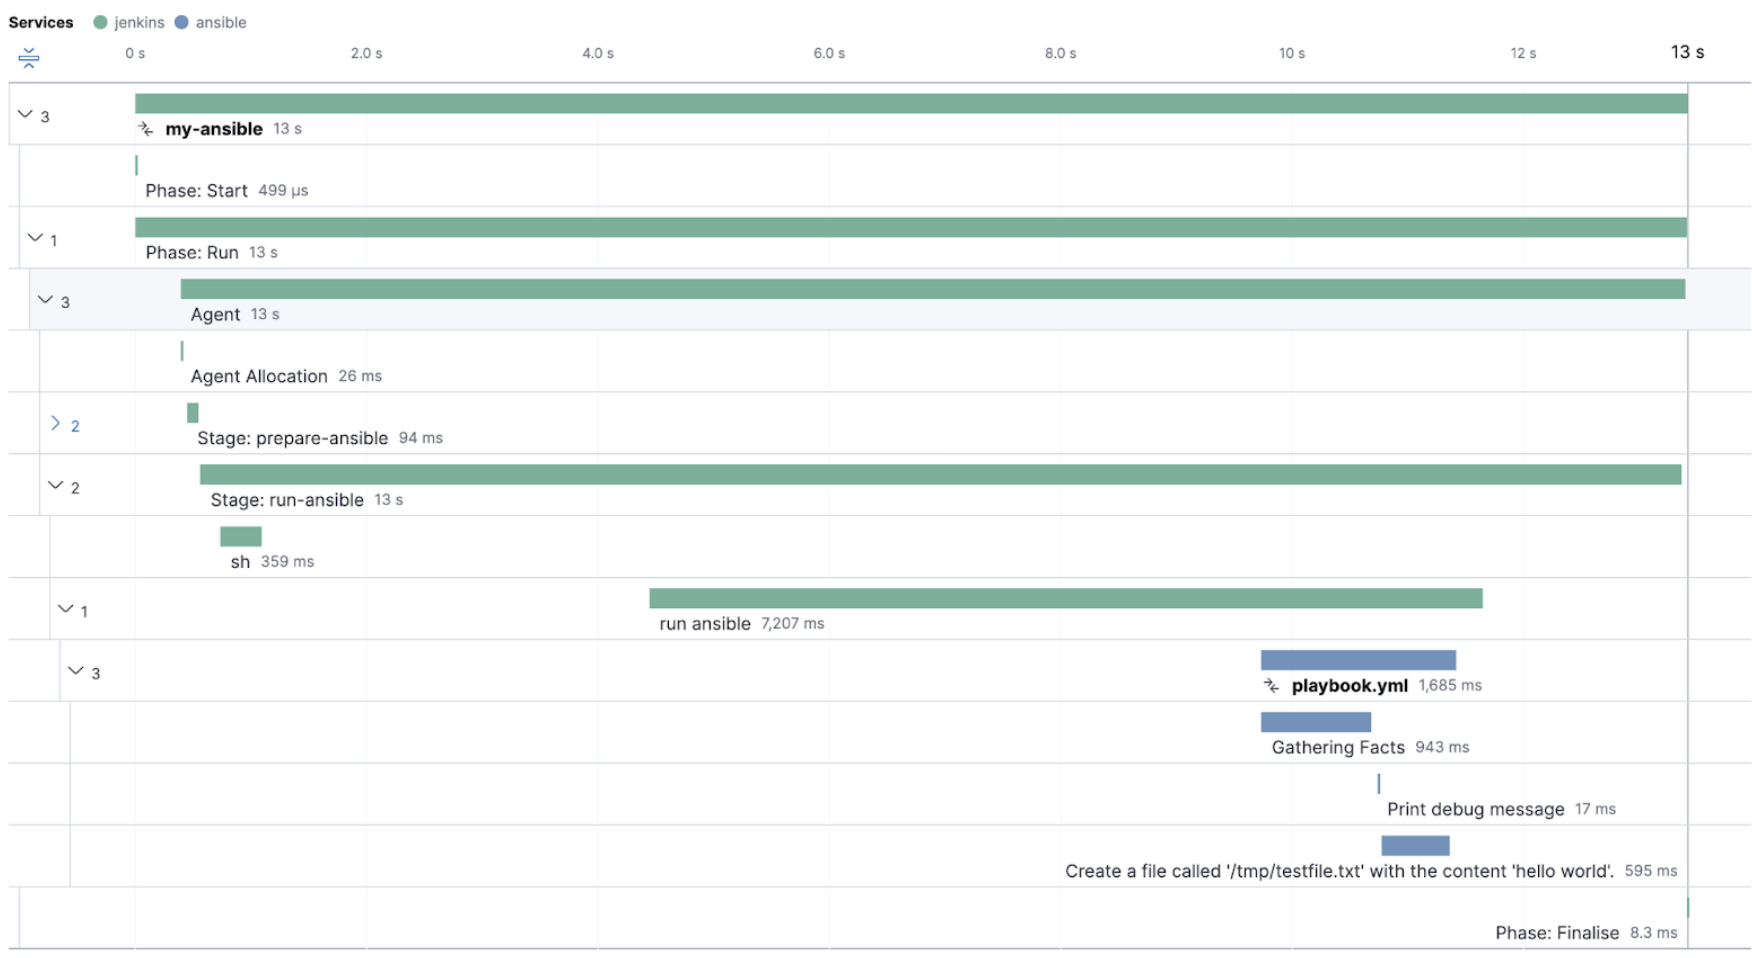
editThe Ansible OpenTelemetry plugin integration provides visibility into all your Ansible playbooks. The plugin generates traces for each run and performance metrics to help you understand which Ansible tasks or roles are run the most, how often they fail, and how long they take to complete.
You can configure your Ansible playbooks with the Ansible OpenTelemetry callback plugin. It’s required to install the OpenTelemetry python libraries and configure the callback as stated in the examples section.
The context propagation from the Jenkins job or pipeline is passed to the Ansible run. Therefore, everything that happens in the CI is also shown in the traces.
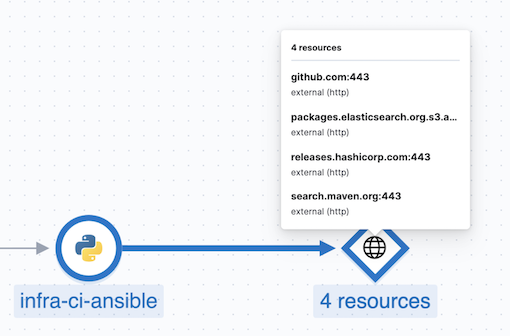
This integration feeds, out of the box, the Service Map with all the services that are connected to the Ansible Playbook. All of these features can help you quickly and visually assess your services used in your provisioning and Continuous Deployment.
Otel CLI
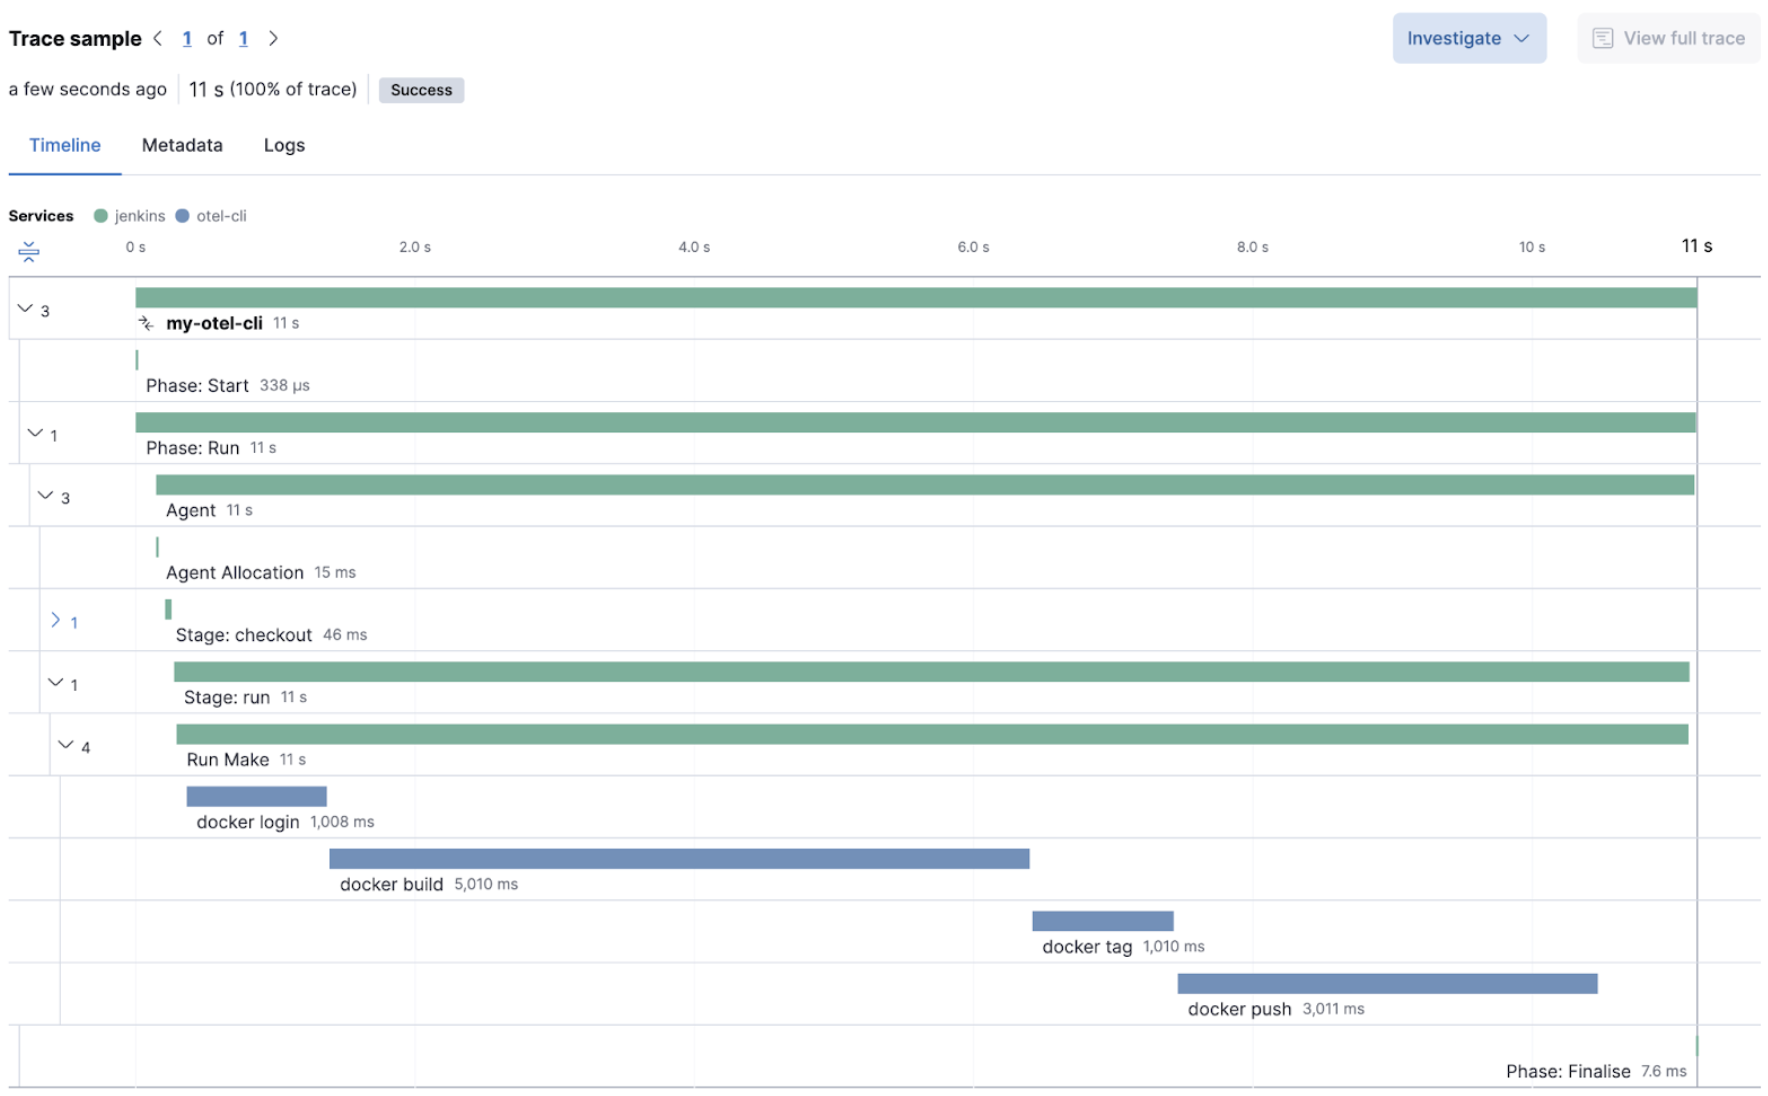
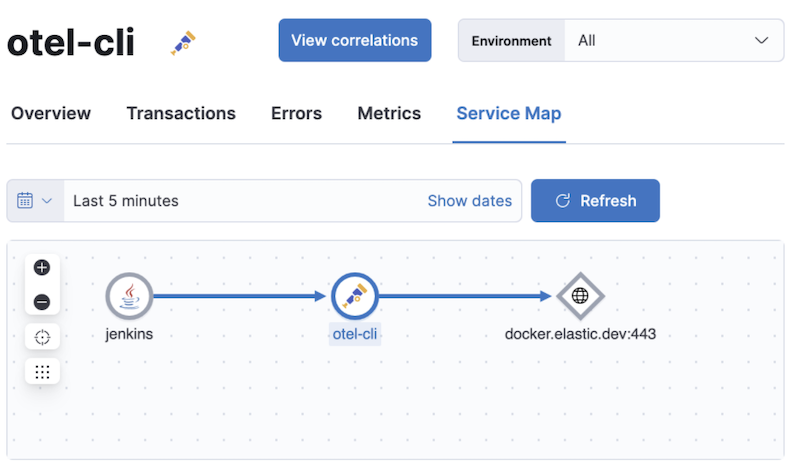
editotel-cli is a command-line tool for sending OpenTelemetry traces, which is useful if instrumenting your scripts explicitly when no other implicit integration is in place.
Using the otel-cli wrapper, you can configure your build scripts implemented in shell, make, or another scripting language. For example, instrumenting the Makefile below with otel-cli helps visualize every command in each goal as spans.
# see https://blog.container-solutions.com/tagging-docker-images-the-right-way

NAME   := acmecorp/foo
TAG    := $$(git log -1 --pretty=%!H(MISSING))
IMG    := ${NAME}:${TAG}
LATEST := ${NAME}:latest

build:
  @otel-cli exec \
    --name 'docker build' \
    docker build -t ${IMG} .
  @otel-cli exec \
    --name 'docker tag' \
    docker tag ${IMG} ${LATEST}

push:
  @otel-cli exec \
    --name 'docker push' \
    --attrs "http.url=https://docker.elastic.dev" \
    docker push ${NAME}

login:
  @otel-cli exec \
    --name 'docker login' \
    --attrs 'rpc.system=grpc' \
    docker login -u ${DOCKER_USER} -p ${DOCKER_PASS}
To invoke shell scripts that use otel-cli for tracing:
export OTEL_EXPORTER_OTLP_ENDPOINT="elastic-apm-server.example.com:8200"
export OTEL_EXPORTER_OTLP_HEADERS="Authorization=Bearer an_apm_secret_token"
export OTEL_TRACES_EXPORTER="otlp"

make login build push
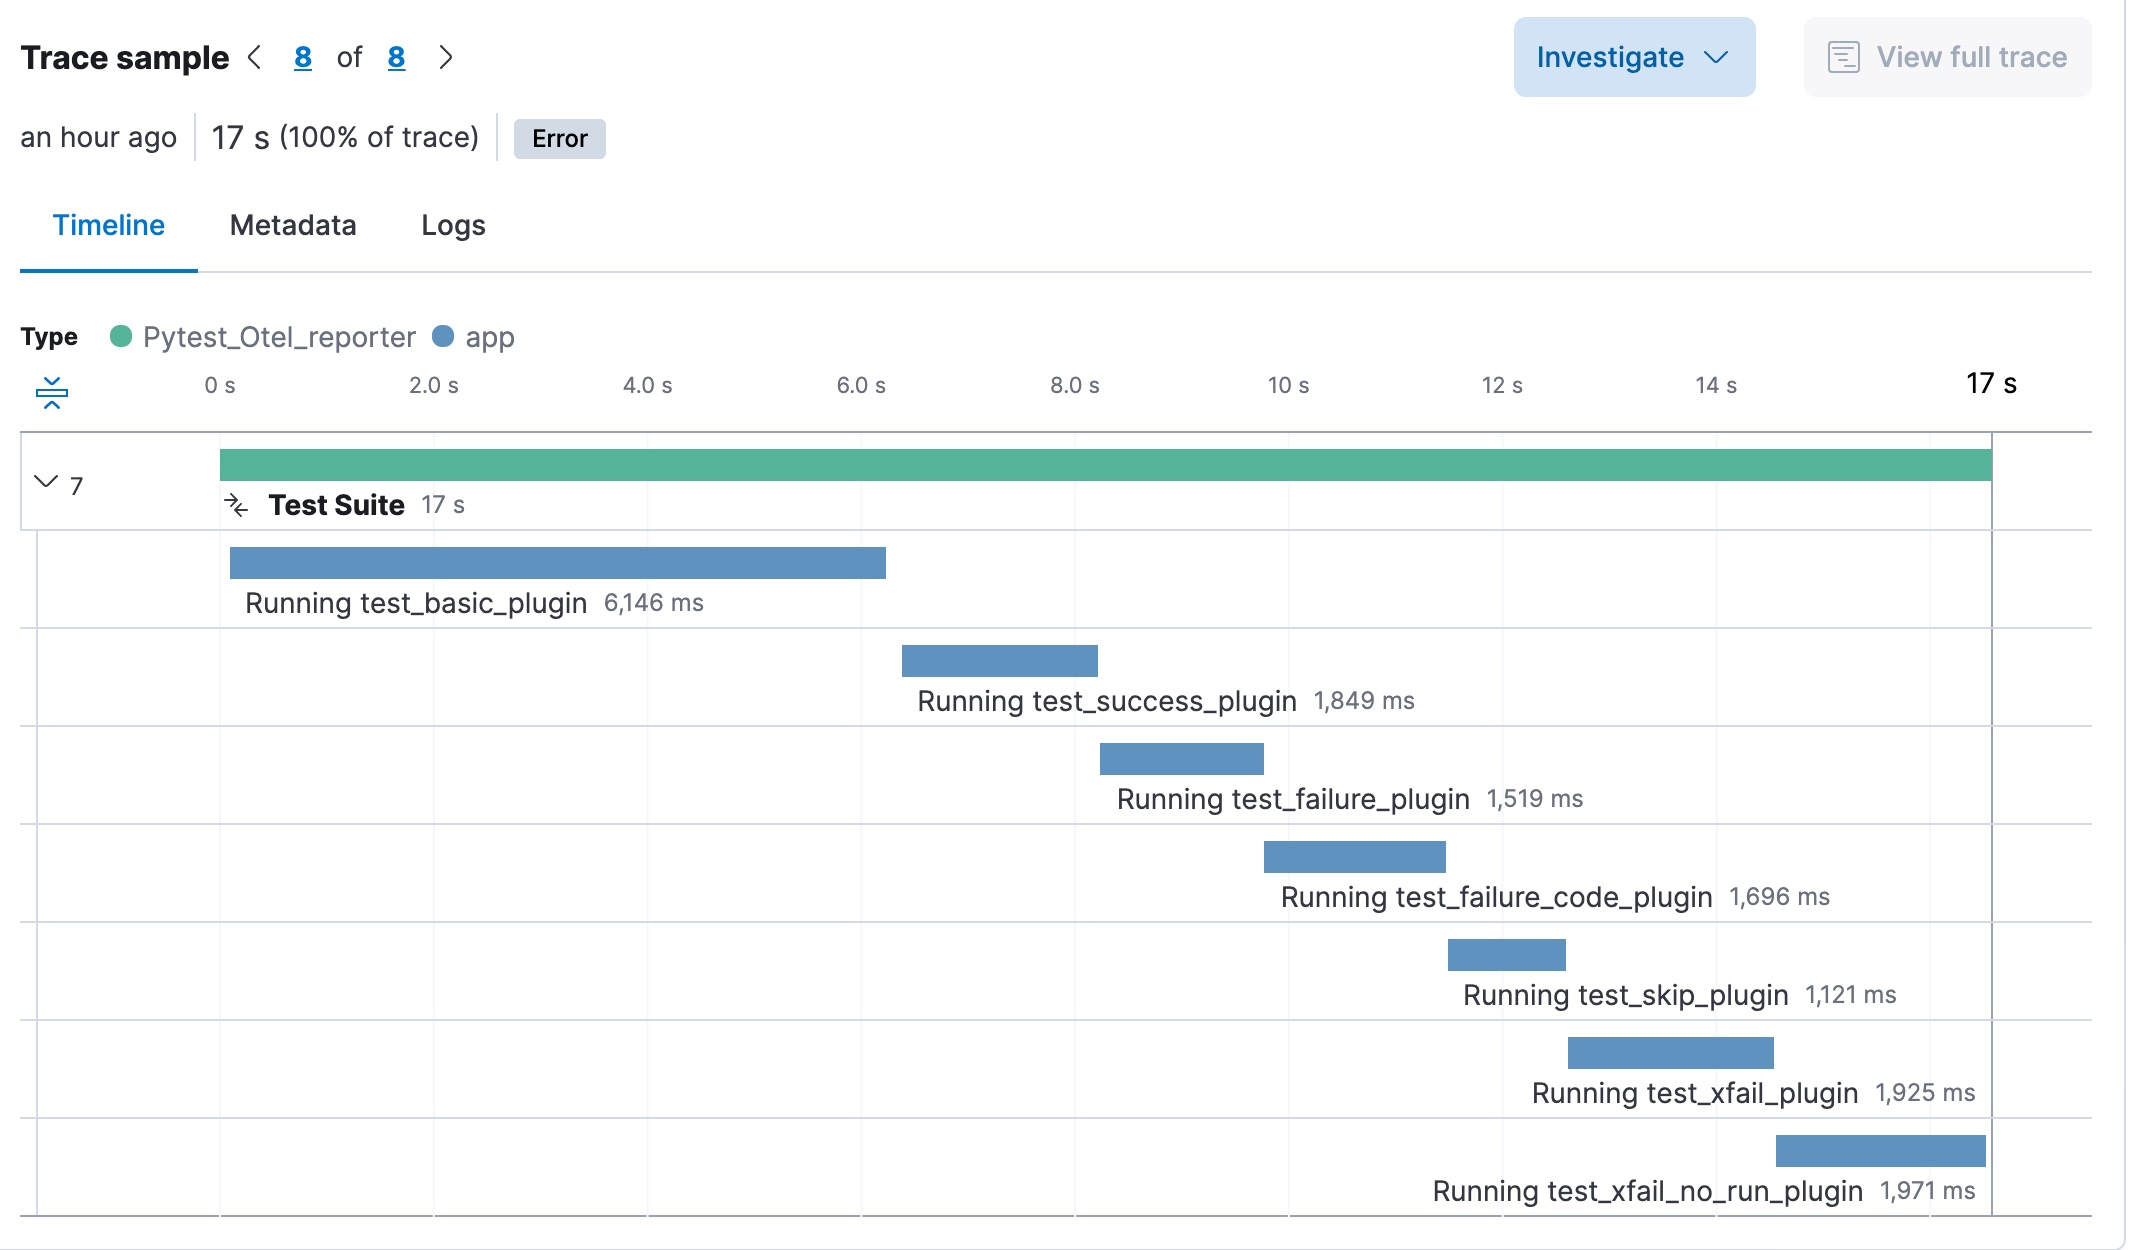
Pytest-otel
editpytest-otel is a pytest plugin for sending Python test results as OpenTelemetry traces. The test traces help you understand test execution, detect bottlenecks, and compare test executions across time to detect misbehavior and issues.
The context propagation from CI pipelines (Jenkins job or pipeline) is passed to the Maven build
through the TRACEPARENT.
OTEL_EXPORTER_OTLP_ENDPOINT=<YOUR_APM_SERVER_URL>:8200 \
OTEL_EXPORTER_OTLP_HEADERS="authorization=Bearer an_apm_secret_token" \
OTEL_SERVICE_NAME=pytest_otel \
pytest --otel-session-name='My_Test_cases'
Concourse CI
editTo configure Concourse CI to send traces, refer to the tracing docs.
In the Concourse configuration, you just need to define CONCOURSE_TRACING_OTLP_ADDRESS
and CONCOURSE_TRACING_OTLP_HEADERS.
CONCOURSE_TRACING_OTLP_ADDRESS=elastic-apm-server.example.com:8200
CONCOURSE_TRACING_OTLP_HEADERS=Authorization=Bearer your-secret-token
Context propagation is supported; therefore, you can benefit from the integrations described above.
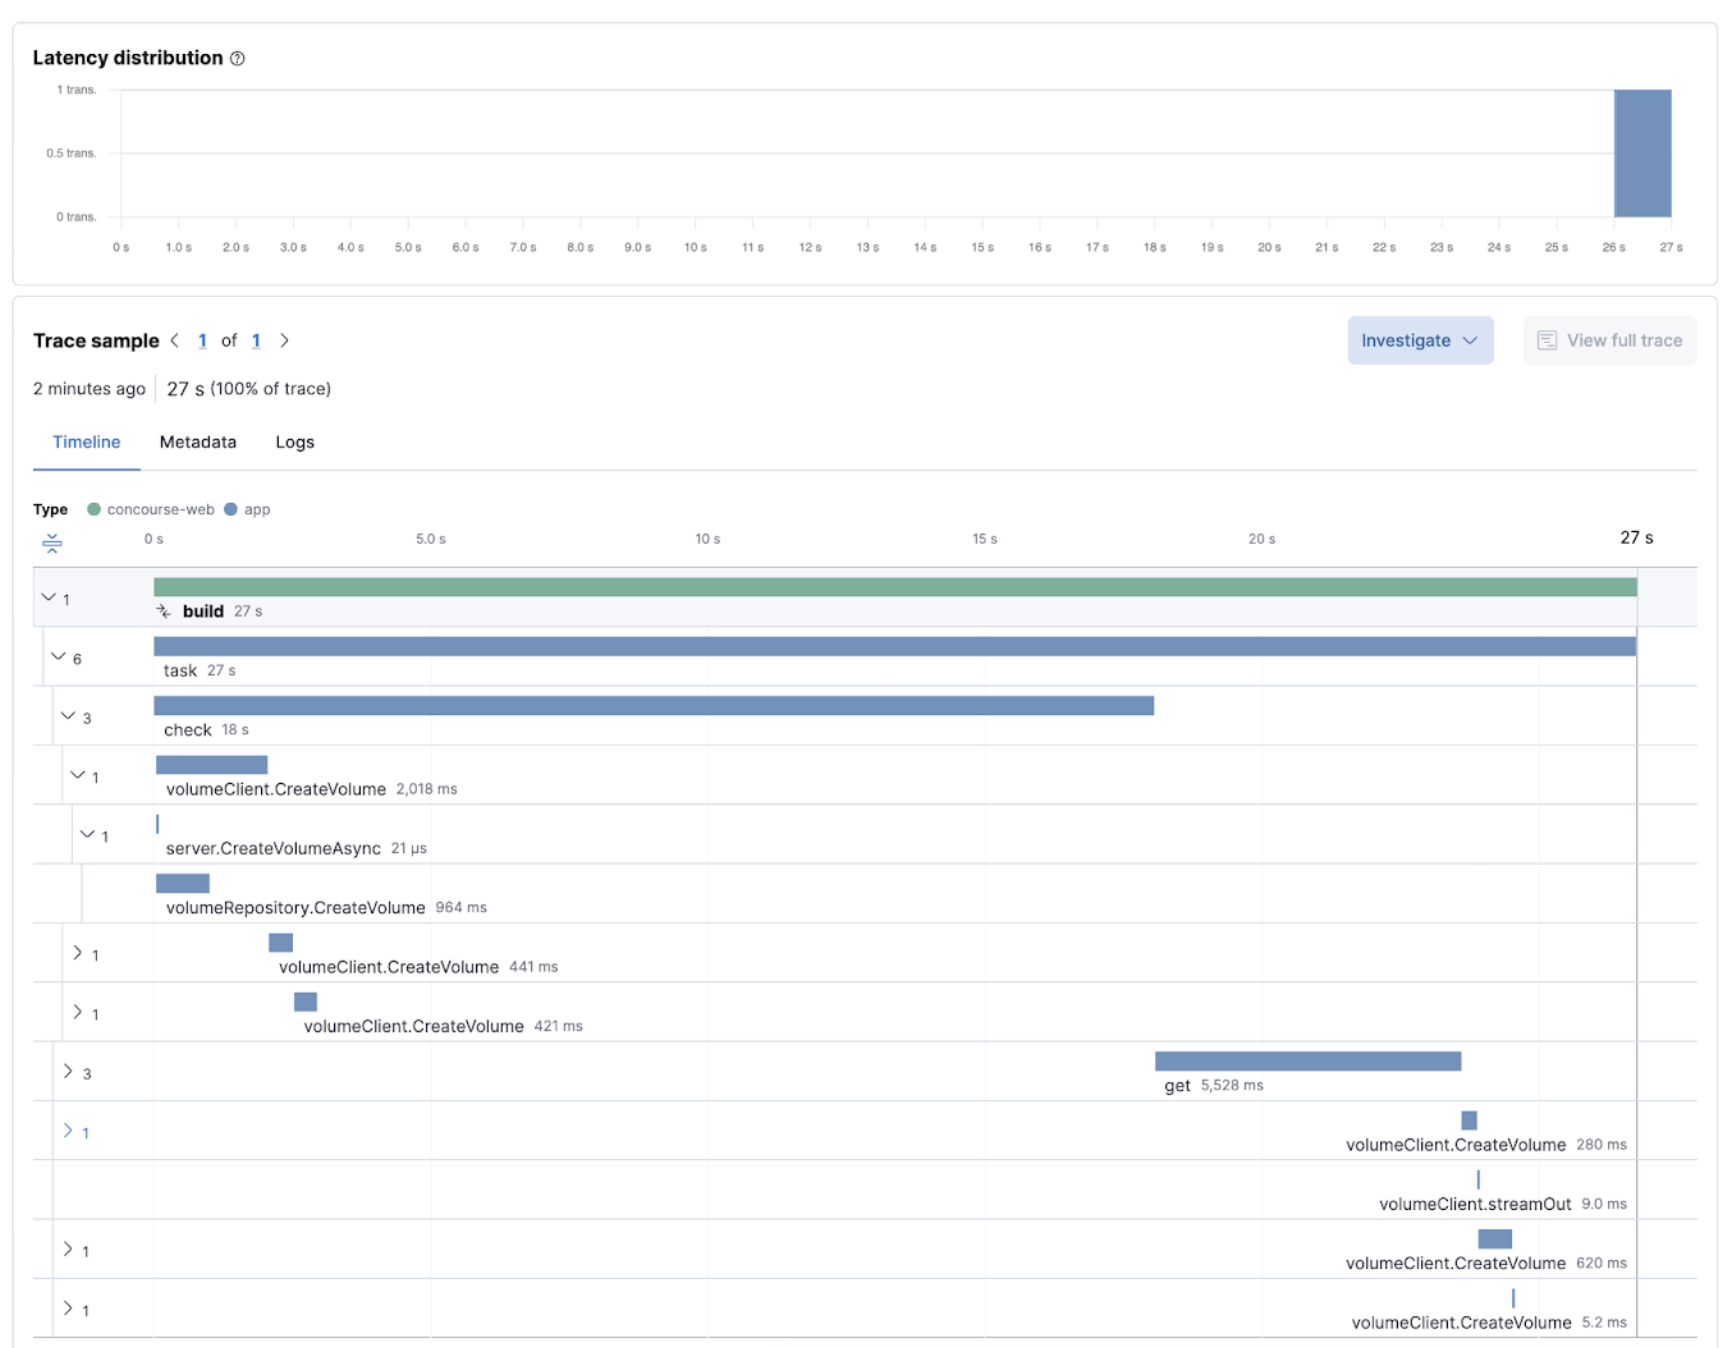
Once Concourse CI tracing is configured, Concourse CI pipeline executions are reported in Elastic Observability.
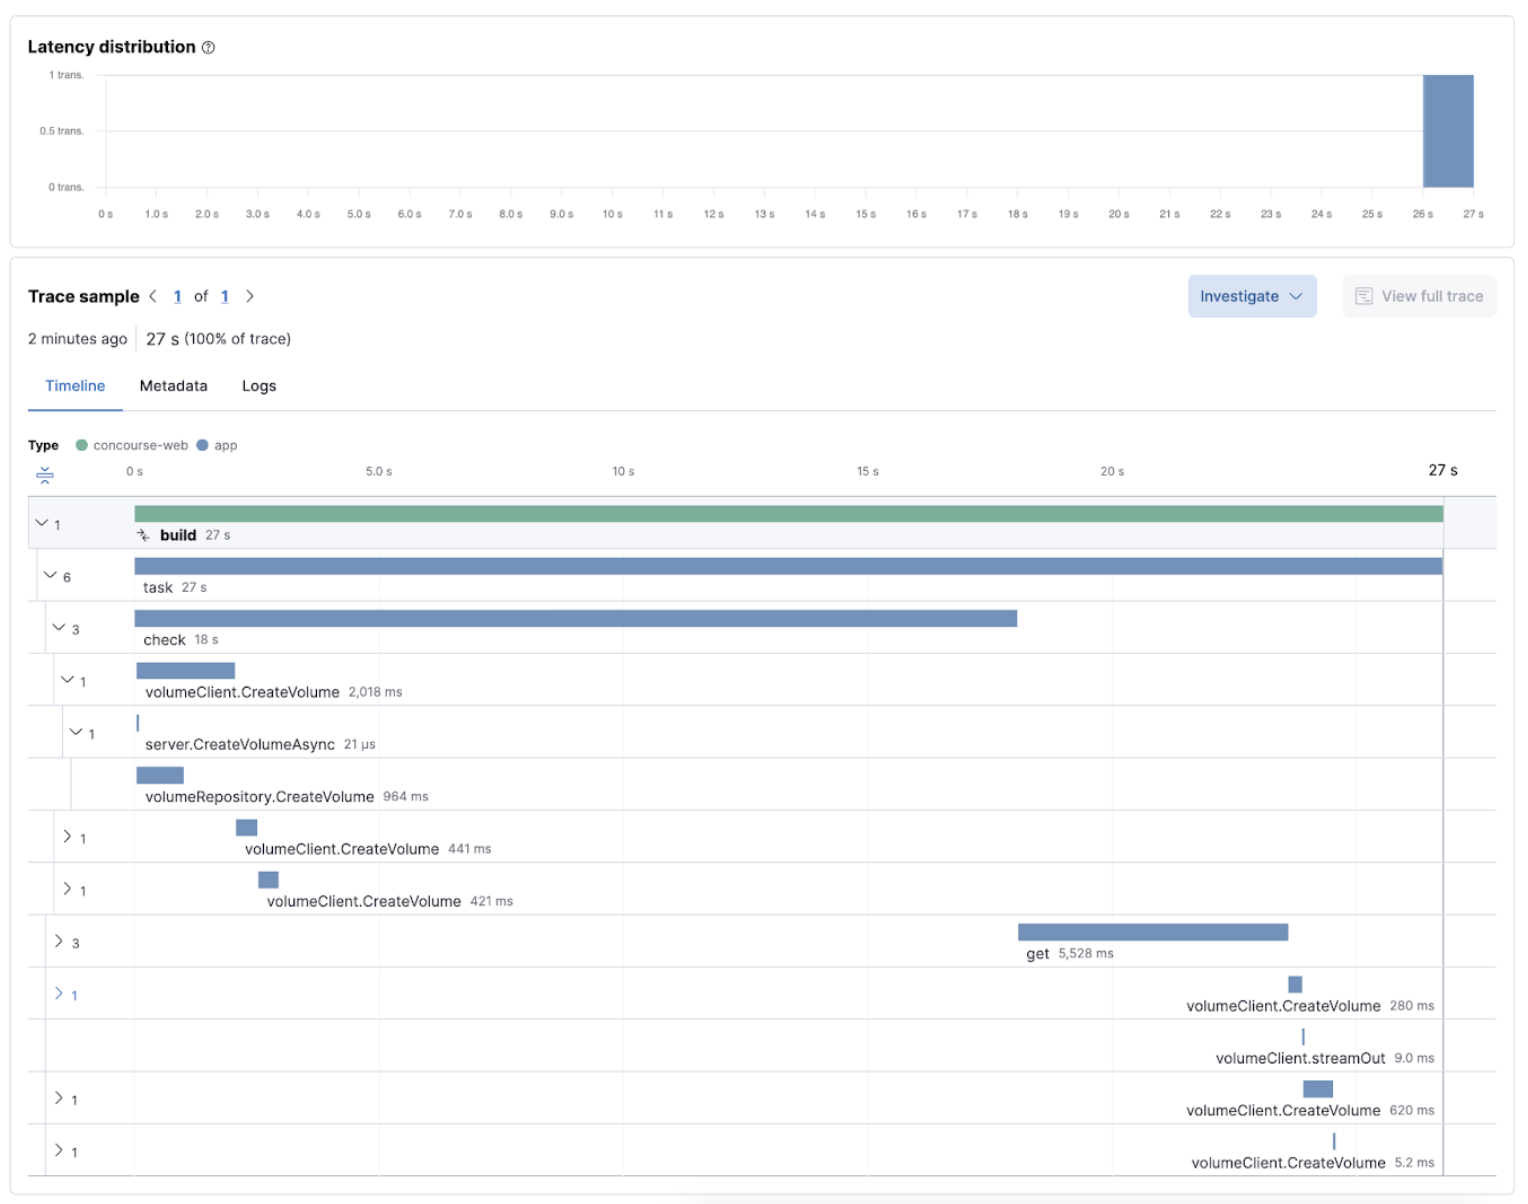
The Concourse CI doesn’t report health metrics through OpenTelemetry. However, you can use the OpenTelemetry Collector Span Metrics Processor to derive pipeline execution traces into KPI metrics like throughput and the error rate of pipelines.
Check service health from deployment pipelines
editIntegrating automated service health checks in deployment pipelines is critical for end-to-end deployment automation, which crucially enables deployment frequency to be increased.
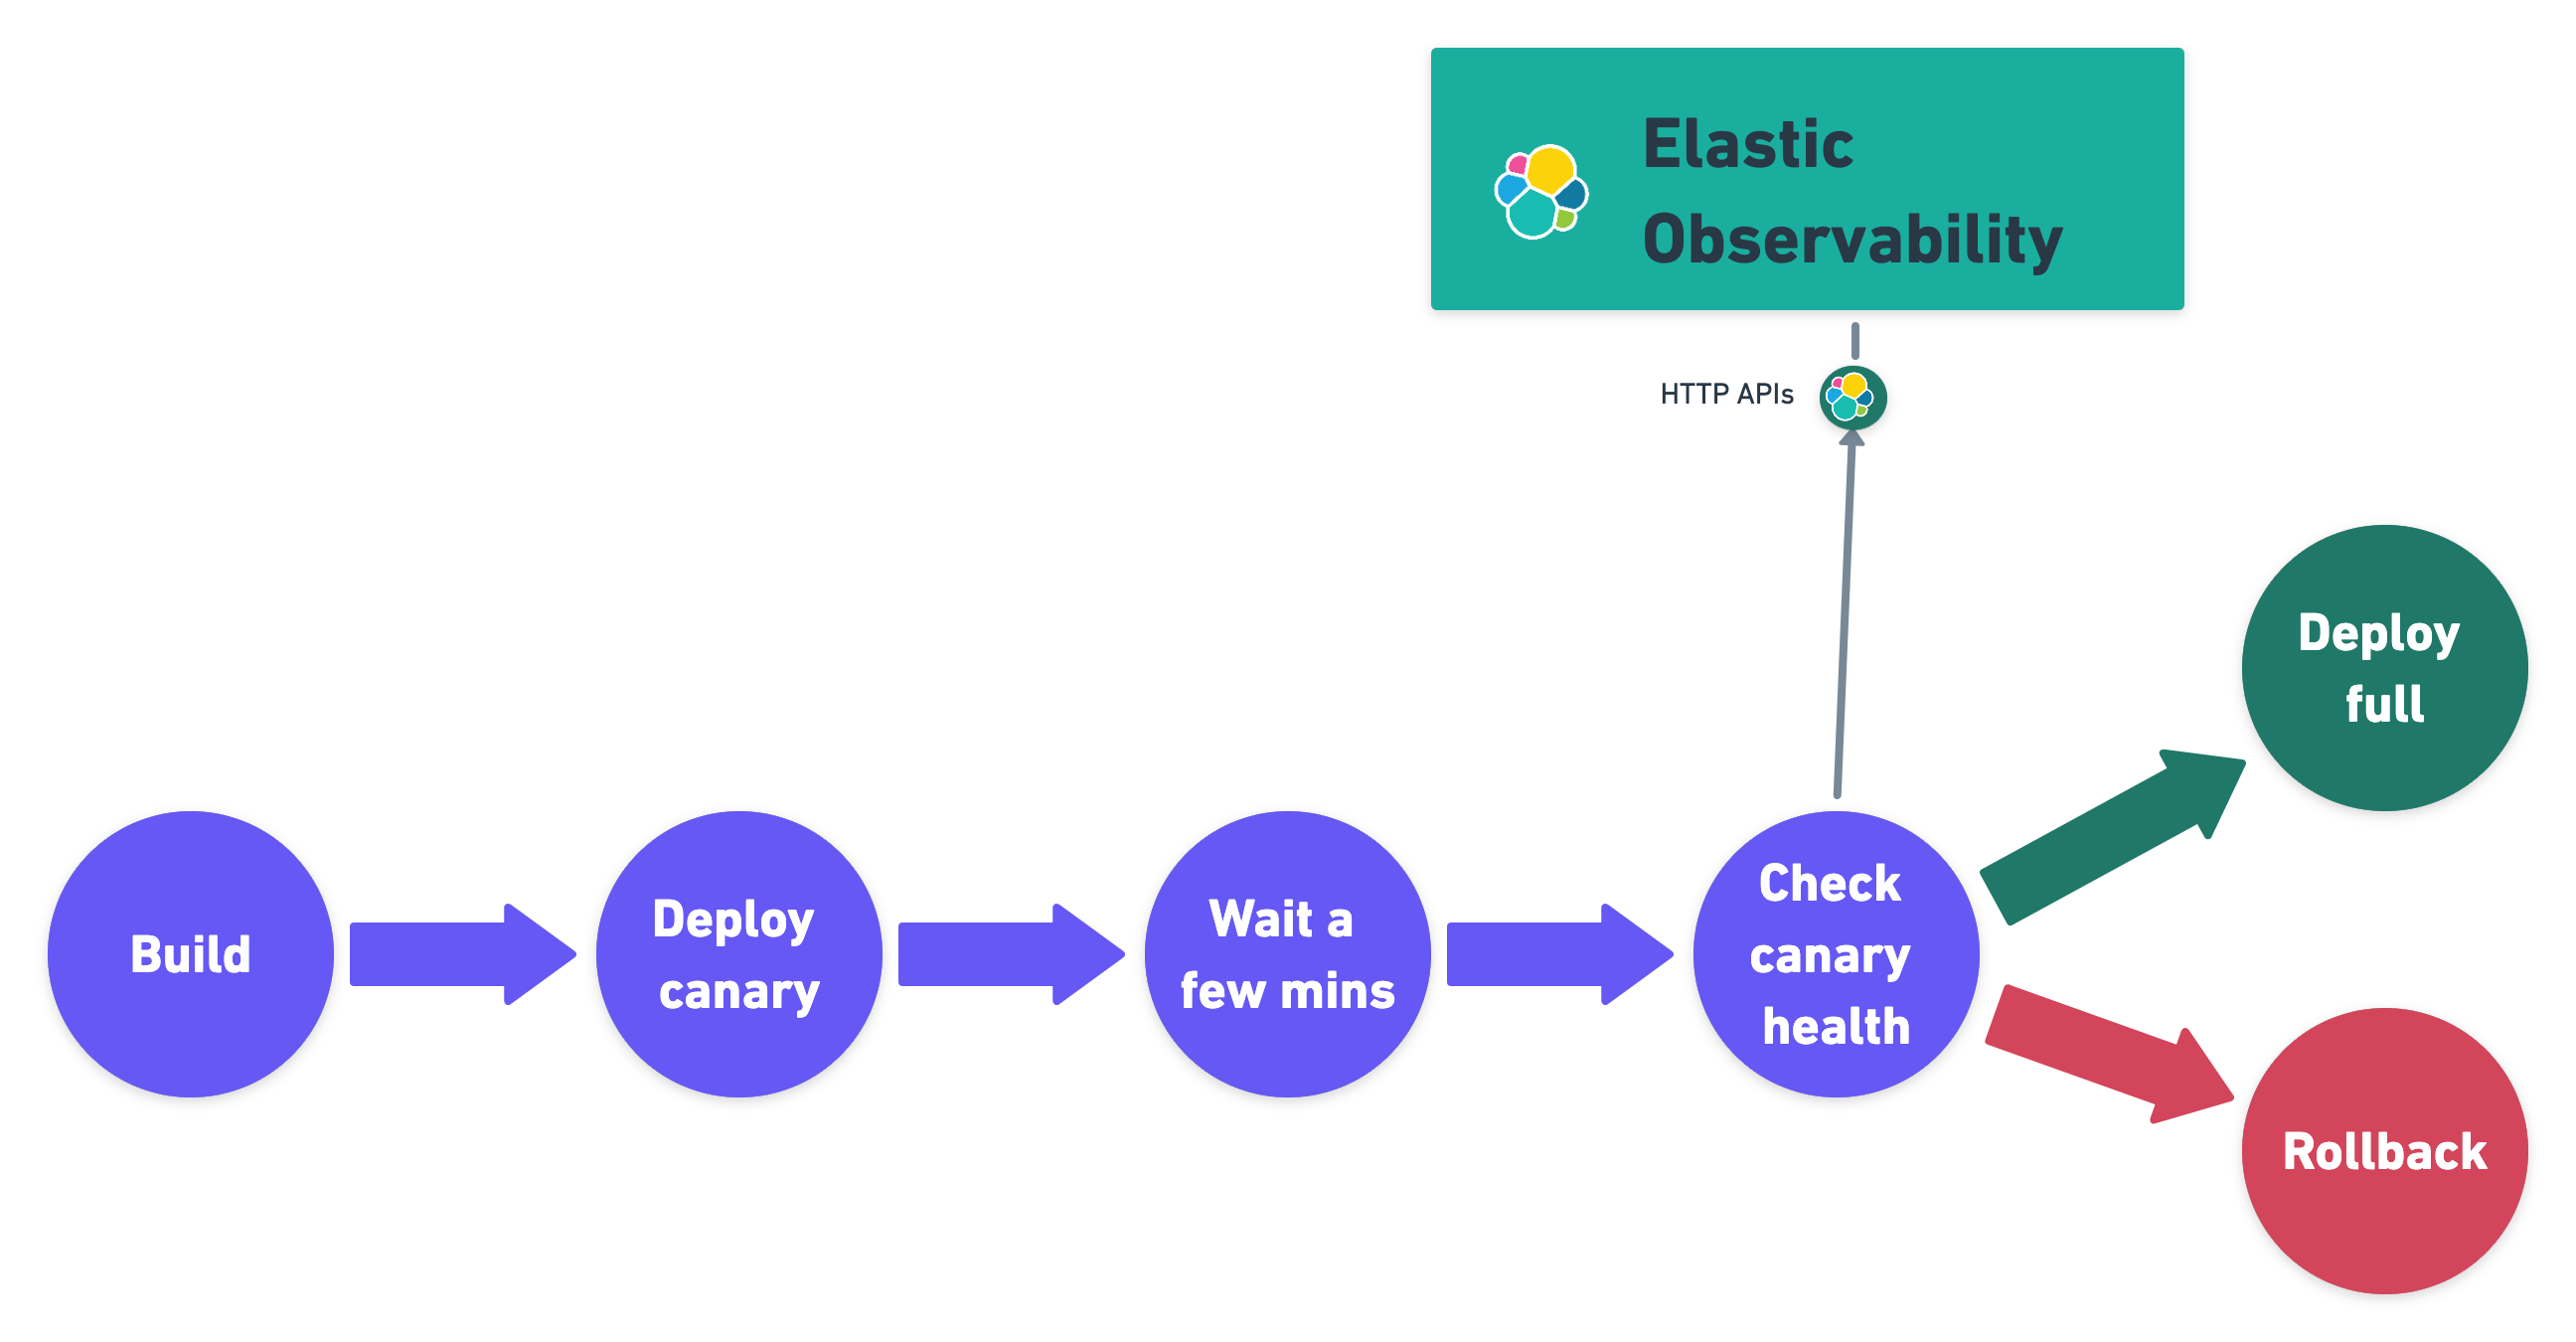
Elastic Observability exposes HTTP APIs to check the health of services. You can integrate these APIs in deployment pipelines to verify the behavior of newly deployed instances, and either automatically continue the deployments or roll back according to the health status.
The following example shows a canary deployment pipeline that leverages Elastic health check HTTP APIs to automate the quality check before rolling out the deployment from the canary to the entire set of instances:
Perform the health check by invoking the KIBANA_URL/internal/apm/services API to compare the transaction error rate of the service on the newly deployed instances with a threshold value. Pass the following parameters to the invocation:
-
startandend: time interval using the ISO-8601 format (e.g. "2021-09-01T13:24:12Z" which is a UTC time) -
kuery: used to filter on the service name and, for example, the new version being deployed to narrow down to the canary instances. Exampleservice.name:"MY_SERVICE_NAME" AND service.version:"1.2.3" -
environment: the environment on which the canary instances are deployed. Example:production.
To define the time range, use the start and end parameters. These parameters are
dates in ISO-8601 format. To query only one service, compose a filter in the parameter kuery,
then filter by the service name using the expression service.name:MY_SERVICE_NAME
and service.version: SERVICE_VERSION. Finally apply an environment filter by passing
the environment parameter. To select all environments, use ENVIRONMENT_ALL.
The API call requires authentication. We recommend to use an API Token to authenticate.
The API is subject to changes and a stable API optimized for Continuous Delivery use cases will soon be published.
def check_service_health(service_name, service_version, error_rate_threshold, kibana_url, api_token):
    now = datetime.now()
    five_minutes_ago = now - timedelta(minutes=5)
    params = {
        "start": five_minutes_ago.strftime("%Y-%m-%dT%H:%M:%SZ"),
        "end": now.strftime("%Y-%m-%dT%H:%M:%SZ"),
        "kuery": "service.name:{} and service.version:{}".format(service_name, service_version),
        "environment": "ENVIRONMENT_ALL"
    }
    url = "{}/internal/apm/services?{}".format(kibana_url, urllib.parse.urlencode(params))
    req = urllib.request.Request(url=url, headers={"Authorization": "Bearer {}".format(api_token)})
    with urllib.request.urlopen(req) as response:
     body = response.read().decode("utf8")
     obj = json.loads(body)
     if len(obj['items']) > 0 and obj['items'][0].transactionErrorRate > error_rate_threshold:
            raise Exception("Error rate for service {} is higher than threshold {}, current value is {}".format(service_name, error_rate_threshold, obj['items'][0].transactionErrorRate))