Uptime and synthetic monitoring
editUptime and synthetic monitoring
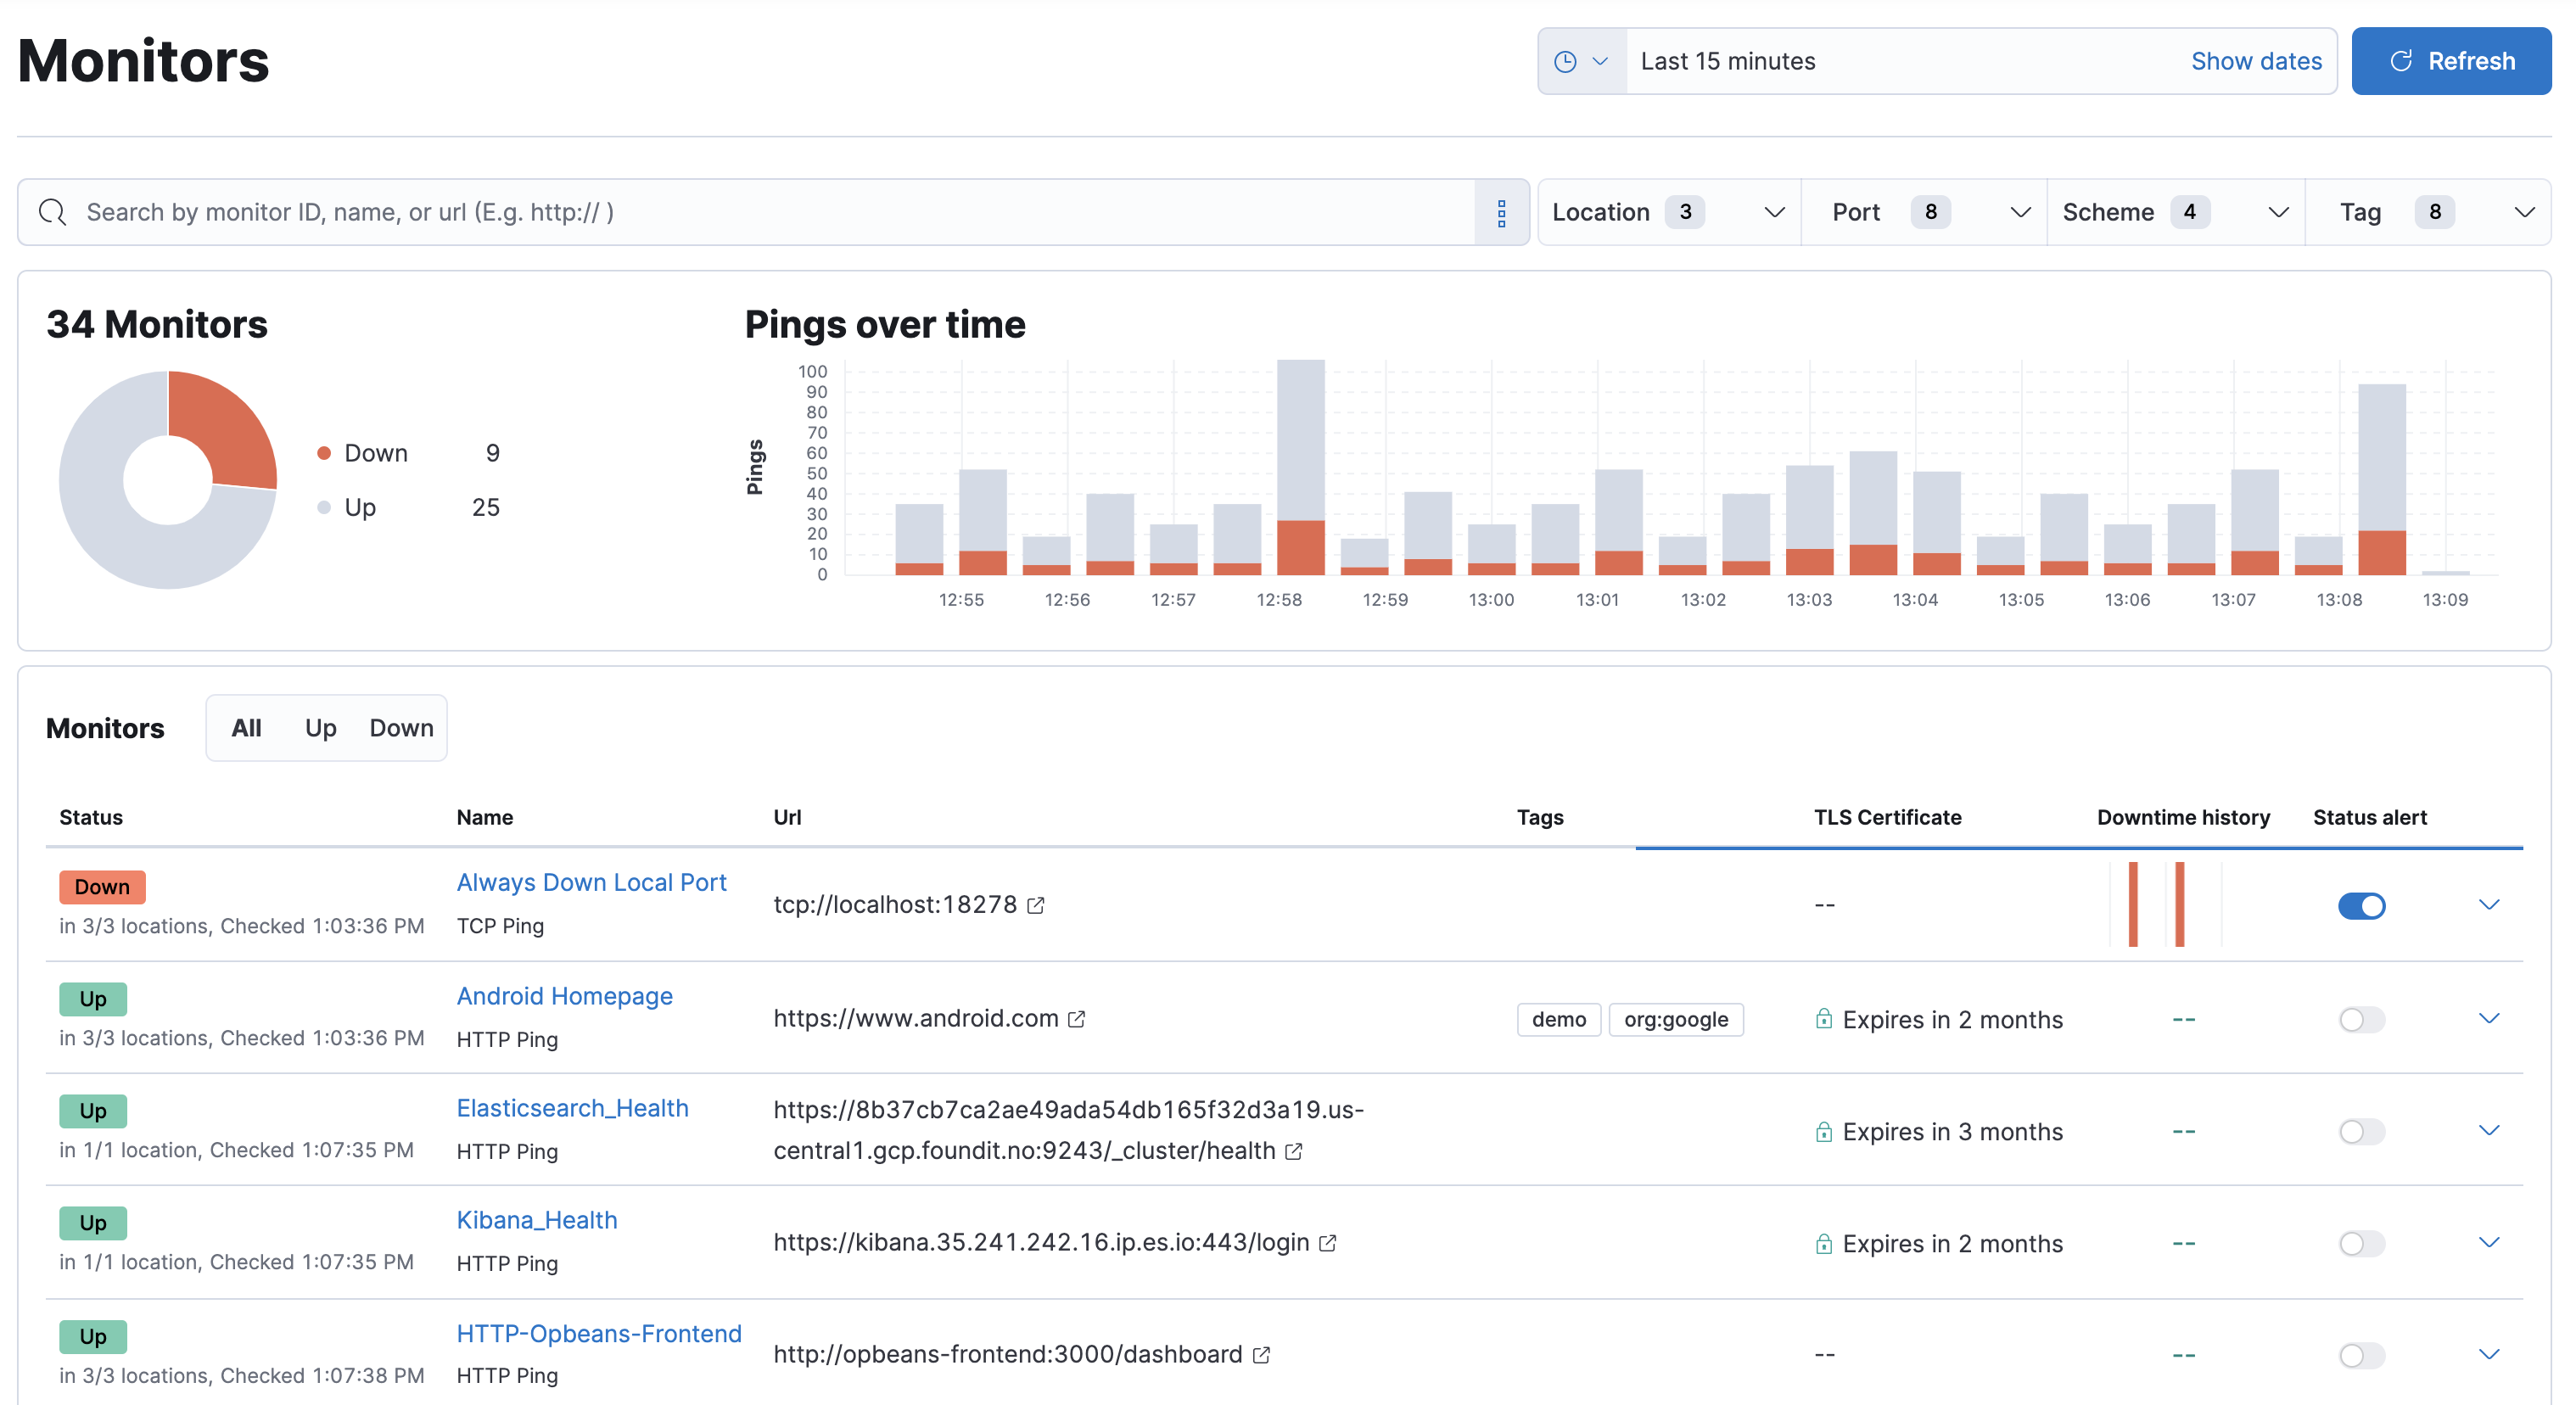
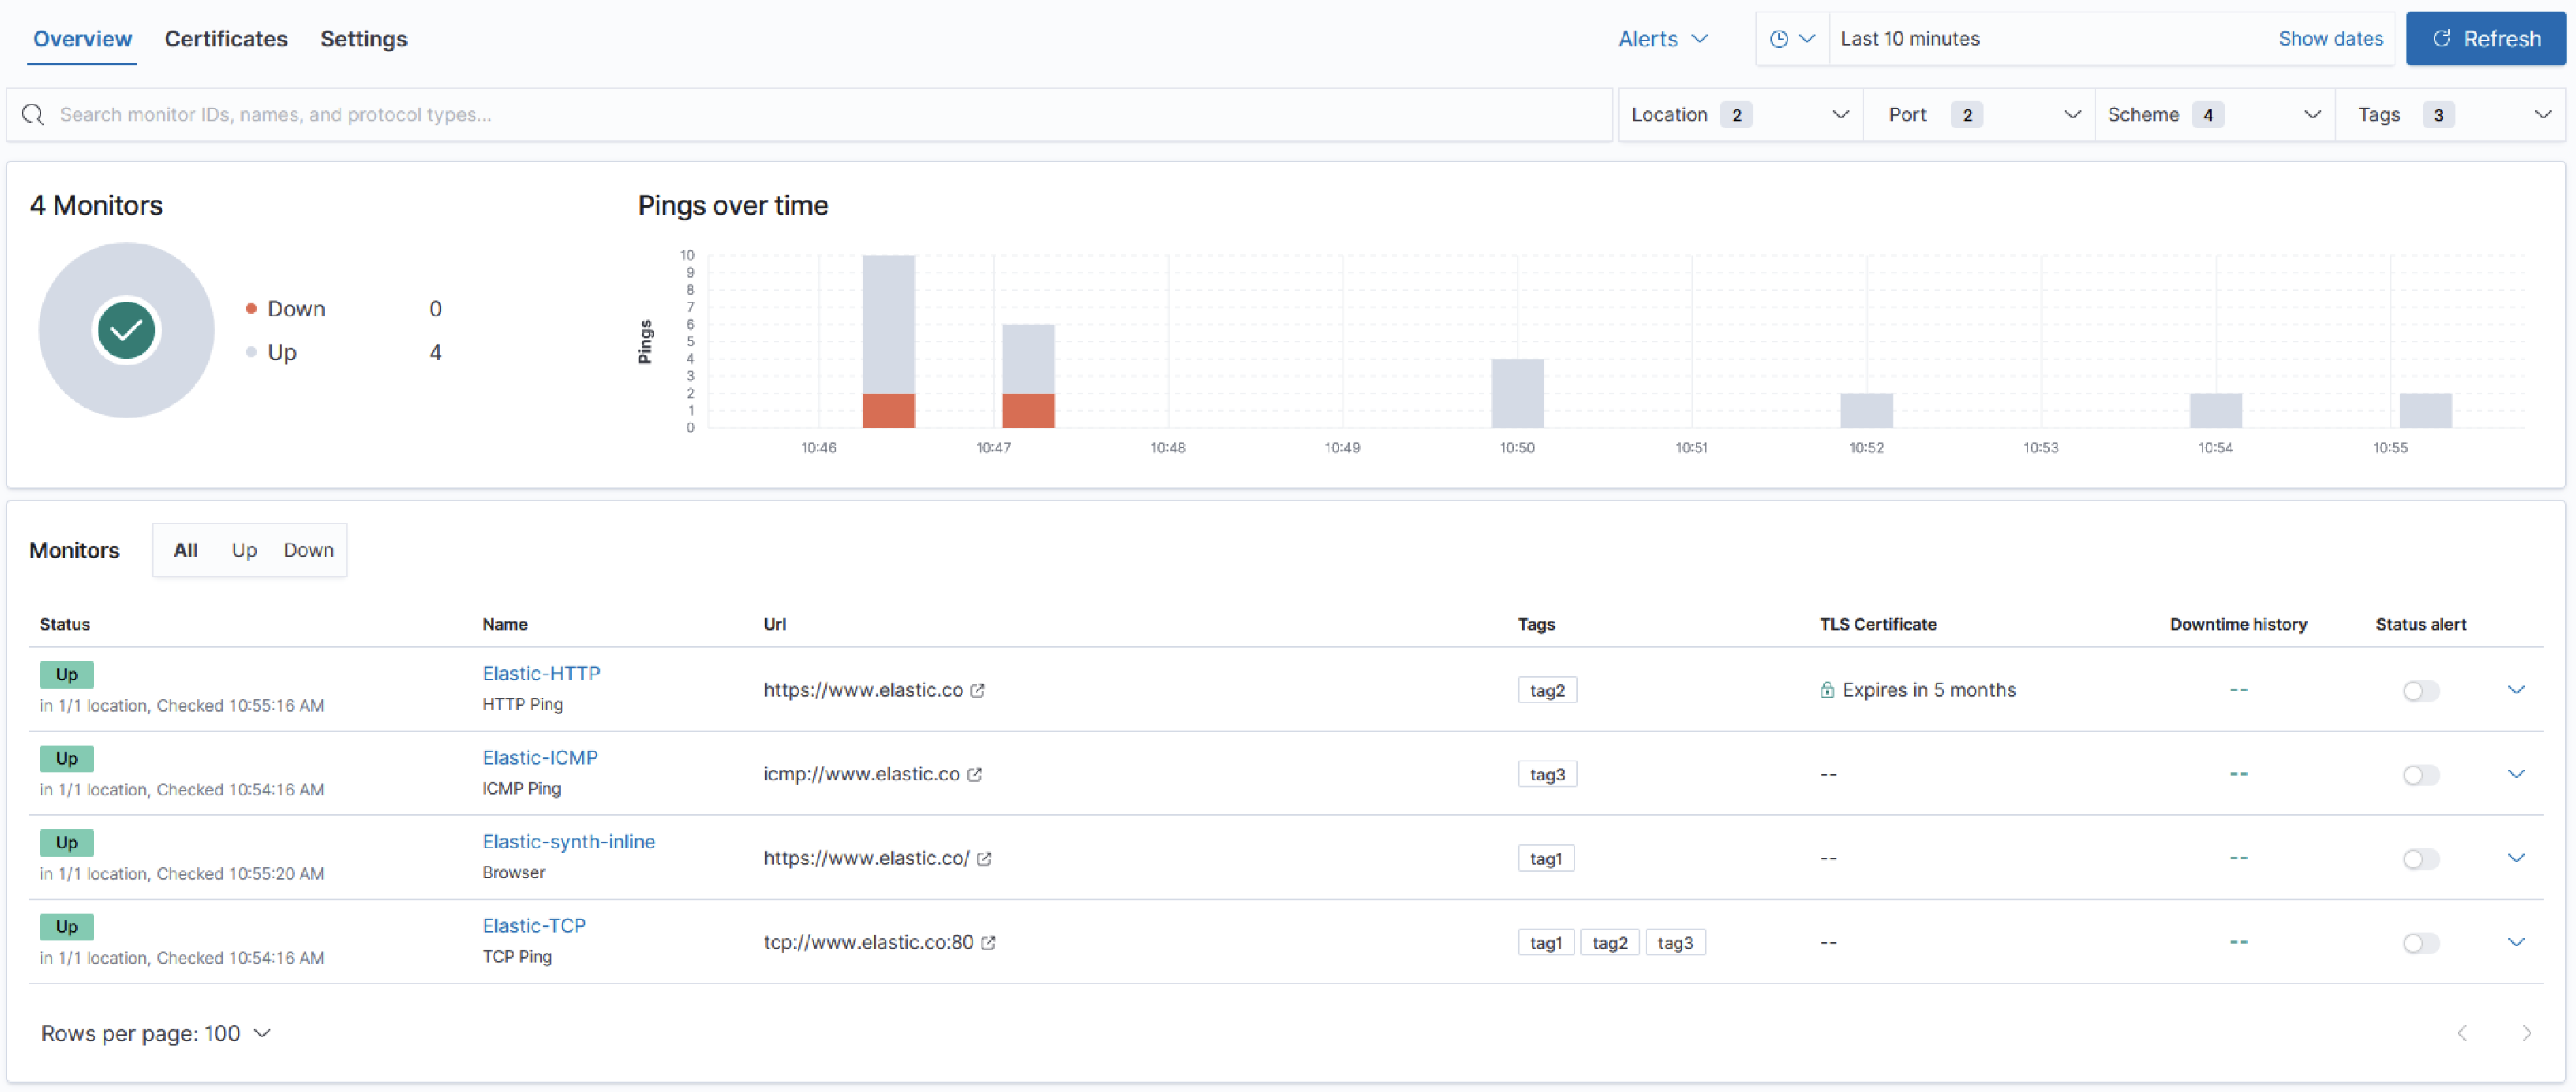
editThe Uptime app uses Elastic Agent to periodically check the status of your services and applications. By adding the Elastic Synthetics integration to an agent’s policy, you can monitor the availability of network endpoints and services using the following Uptime monitors:
Lightweight HTTP/S, TCP, and ICMP monitors
editIn the Uptime app, you can monitor the status of network endpoints using the following lightweight checks:
HTTP monitor |
Monitor your website. The HTTP monitor checks to make sure specific endpoints return the correct status code and display the correct text. |
ICMP monitor |
Check the availability of your hosts. The ICMP monitor uses ICMP (v4 and v6) Echo Requests to check the network reachability of the hosts you are pinging. This will tell you whether the host is available and connected to the network, but doesn’t tell you if a service on the host is running or not. |
TCP monitor |
Monitor the services running on your hosts. The TCP monitor checks individual ports to make sure the service is accessible and running. |
To set up your first monitor, see Set up monitors.
Browser monitors
edit[beta] This functionality is in beta and is subject to change. The design and code is less mature than official GA features and is being provided as-is with no warranties. Beta features are not subject to the support SLA of official GA features. Real browser synthetic monitoring enables you to test critical actions and requests that an end-user would make on your site at predefined intervals and in a controlled environment. The result is rich, consistent, and repeatable data that you can trend and alert on.
For example, you can test popular user journeys, like logging in, adding items to a cart, and checking out — actions that need to work for your users consistently.
Using the synthetics agent or Heartbeat, you can run automated synthetic monitoring test suites on a real Chromium browser and view each synthetic monitoring journey in the Uptime app side-by-side with your other monitors.
Alerting helps you detect degraded performance or broken actions before your users do. By receiving alerts early, you can fix issues before they impact your bottom line or customer experience.
To get started with browser monitors, get set up and then write a synthetic journey.
TLS Certificates
editThe TLS Certificates page in the Uptime app lists the TLS certificates that are being monitored and shows the TLS certificate data in your indices.
In addition to the common name, associated monitors, issuer information, and SHA fingerprints, an assigned status is derived from the threshold values in the Settings page.
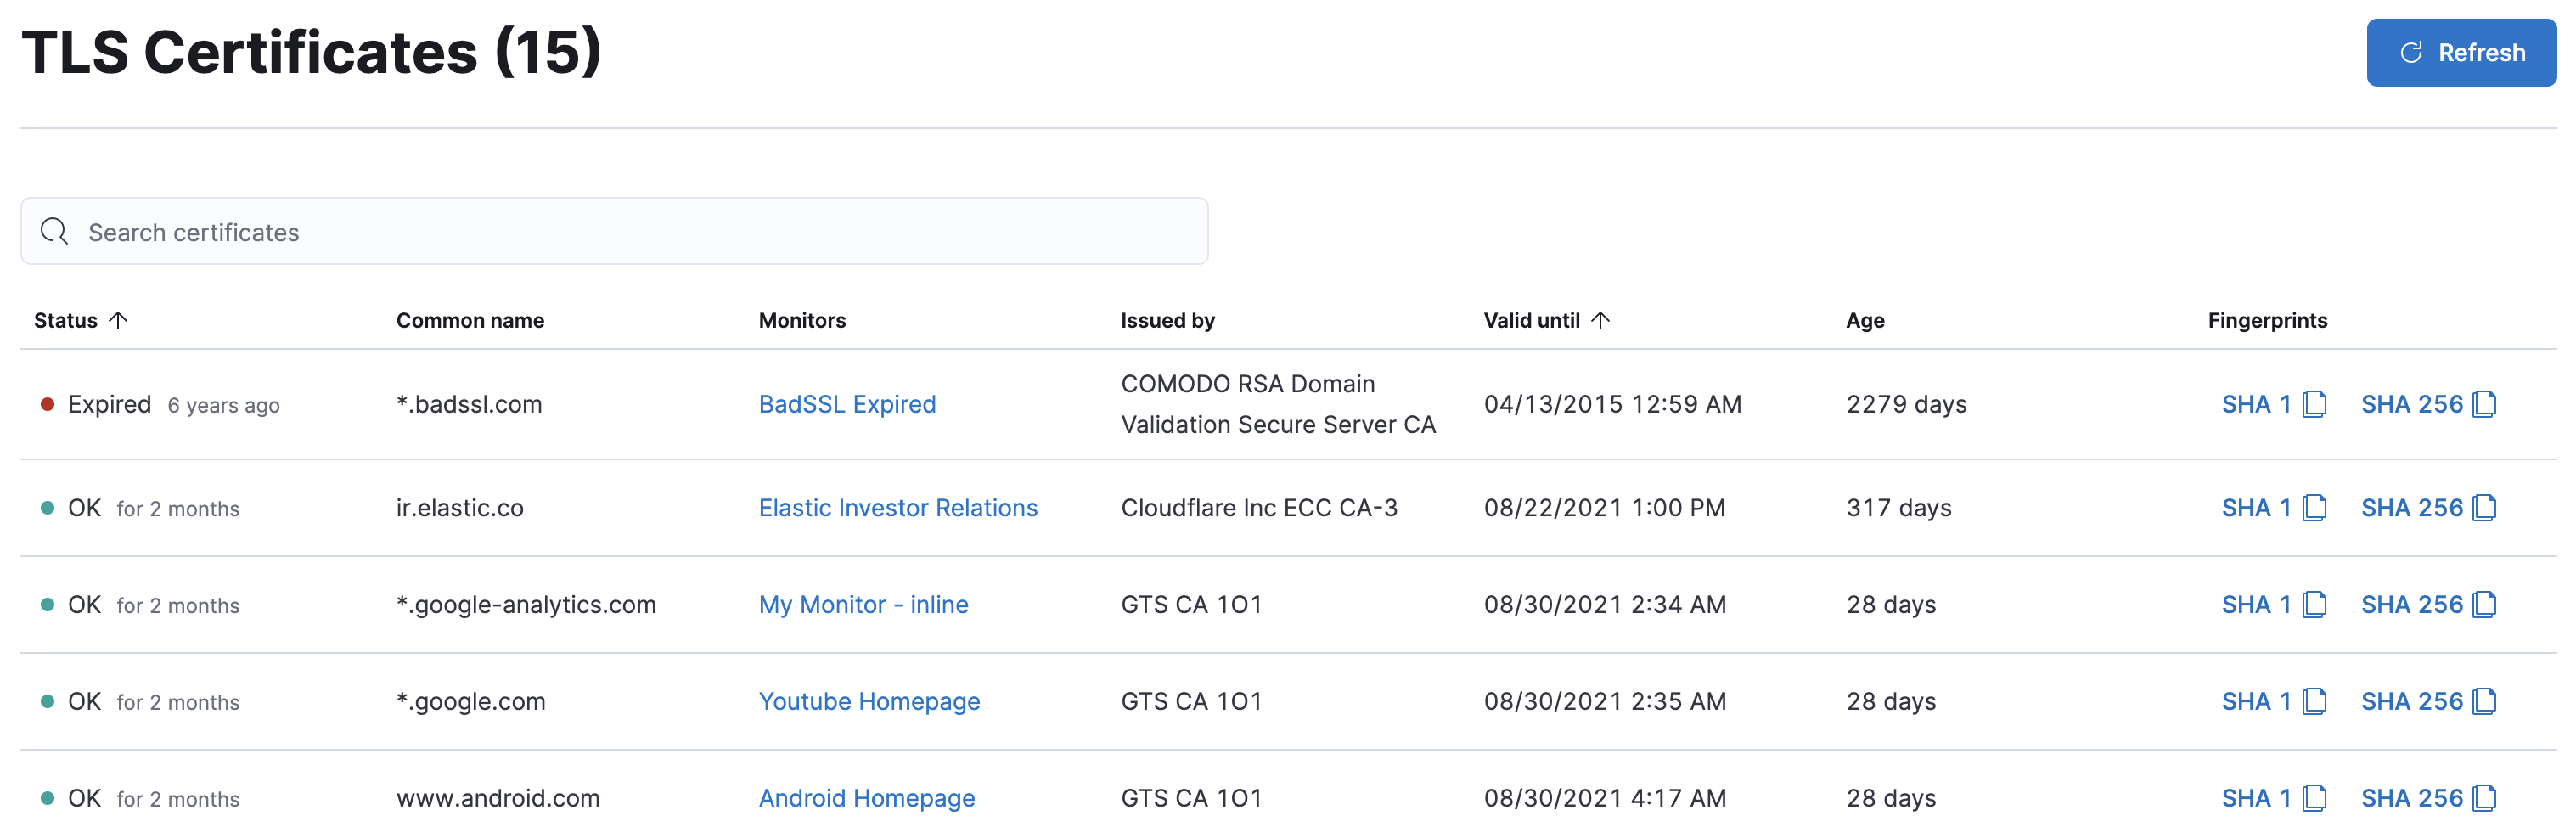
The table entries can be sorted by status and valid until. You can use the search bar at the top of the view to find values in most of the TLS-related fields in your Uptime indices.
Additionally, you can select the Alerts and rules dropdown at the top of the page, and create a TLS rule to receive an alert when your certificate is about to expire.