Exploratory data visualizations
editExploratory data visualizations
editThis functionality is in technical preview and may be changed or removed in a future release. Elastic will work to fix any issues, but features in technical preview are not subject to the support SLA of official GA features.
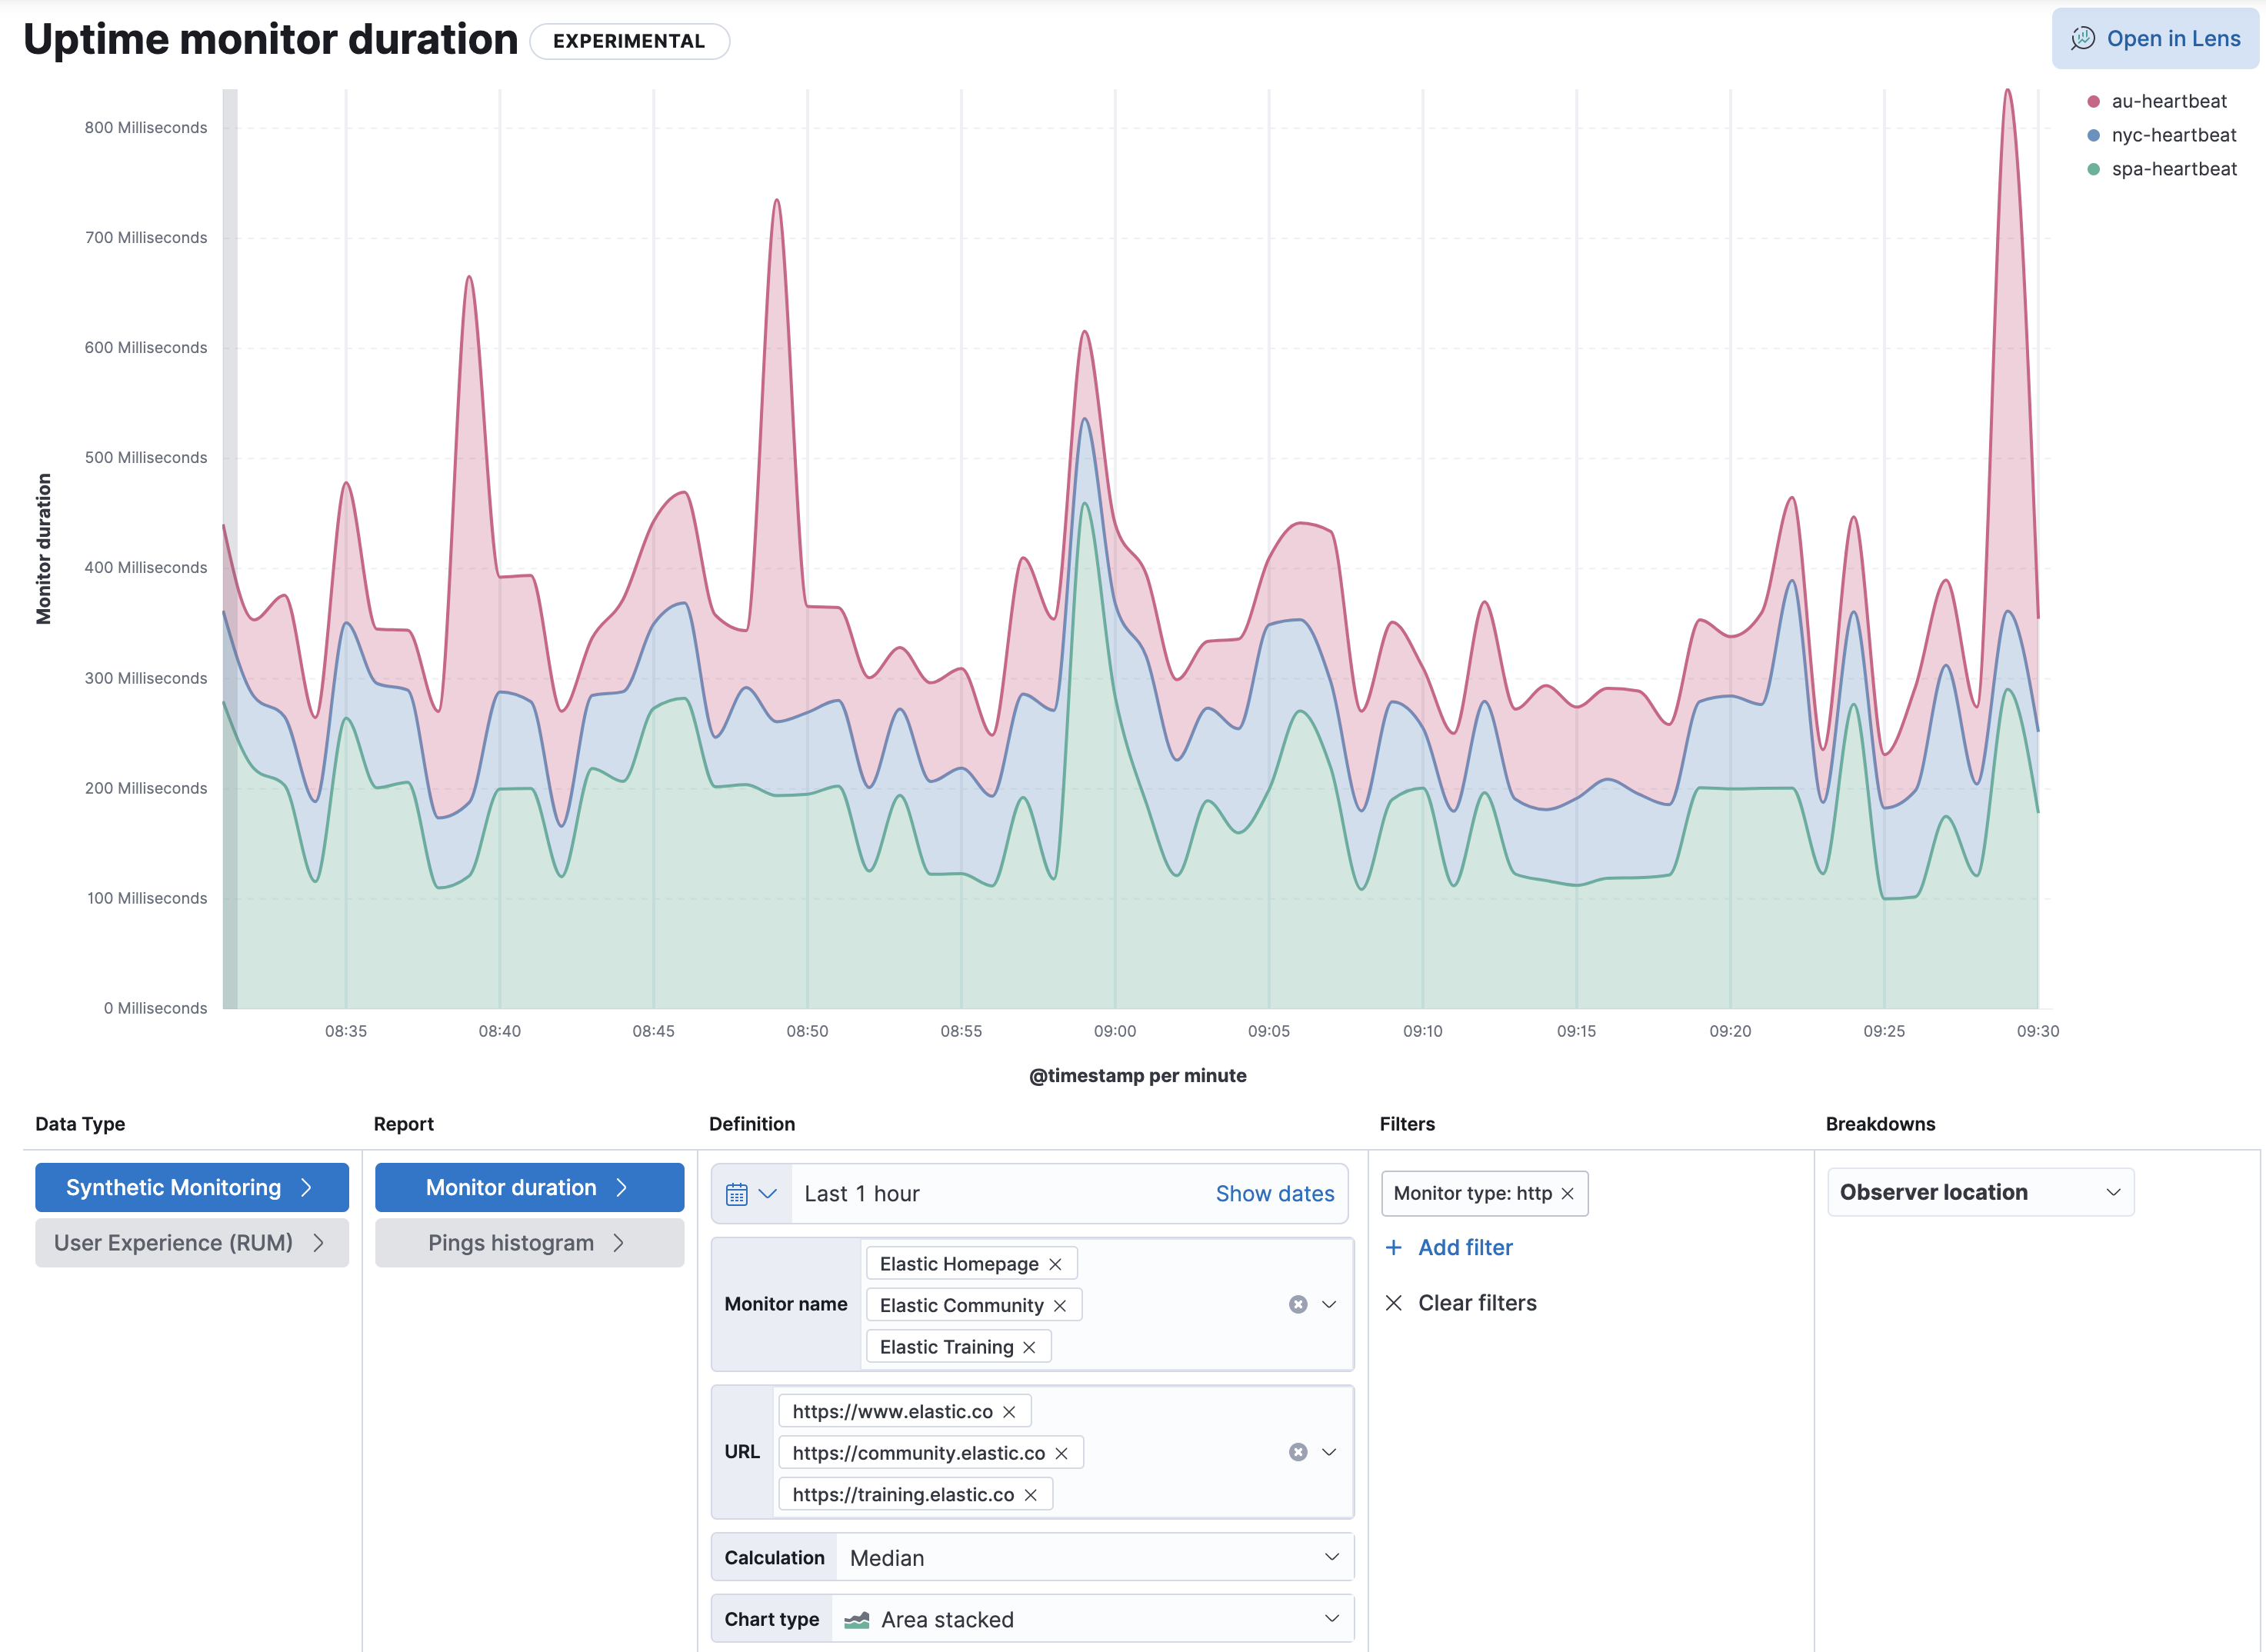
The Exploratory view in Kibana enables you to build and analyze custom aggregation-based visualizations of your Synthetic monitoring and User Experience (RUM) data to help you thoroughly examine and discover insights.
You may only be interested in a specific set of data so you can identify underlying signals quickly. Or perhaps you want to manipulate your data to perform vital investigations without the need for deep domain knowledge.
Using the Exploratory view, you can filter your data and build visualizations that help you clarify what’s essential and examine the cause or impact of performance difficulties.