Metrics monitoring overviewedit
The Metrics app enables you to monitor metrics for your infrastructure and identify problems in real time. You can view basic metrics for servers, containers, services, and so on. Then you can drill down to view more detailed metrics, or you can seamlessly switch to view corresponding logs, uptime information or APM traces where available.
Metrics monitoring componentsedit
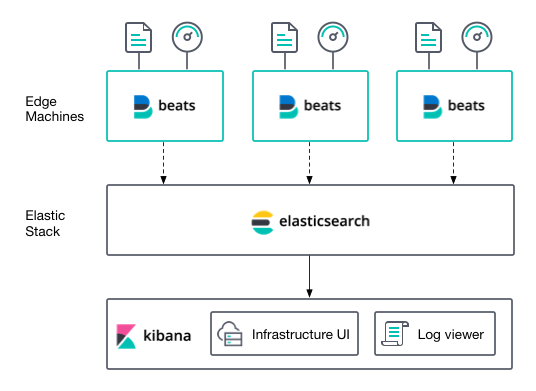
Metrics monitoring requires the following Elastic Stack components.
Elasticsearch is a real-time, distributed storage, search, and analytics engine. Elasticsearch can store, search, and analyze large volumes of data in near real-time. The Metrics app uses Elasticsearch to store metrics data in Elasticsearch documents which are queried on demand.
Beats are open source data shippers that you install as agents on your servers to send data to Elasticsearch. The Metrics app uses metrics collected by Metricbeat from the servers, containers, and other services in your infrastructure. Metricbeat modules are available for most common servers, containers and services.
Kibana is an open source analytics and visualization platform designed to work with Elasticsearch. You use Kibana to search, view, and interact with the metrics data stored in Elasticsearch. You can easily perform advanced data analysis and visualize your data in a variety of charts, tables, and maps. The Metrics app in Kibana provides a dedicated user interface to view metrics for your infrastructure.