Feature importance
editFeature importance
editFeature importance values indicate which fields had the biggest impact on each prediction that is generated by classification or regression analysis. Each feature importance value has both a magnitude and a direction (positive or negative), which indicate how each field (or feature of a data point) affects a particular prediction.
The purpose of feature importance is to help you determine whether the predictions are sensible. Is the relationship between the dependent variable and the important features supported by your domain knowledge? The lessons you learn about the importance of specific features might also affect your decision to include them in future iterations of your trained model.
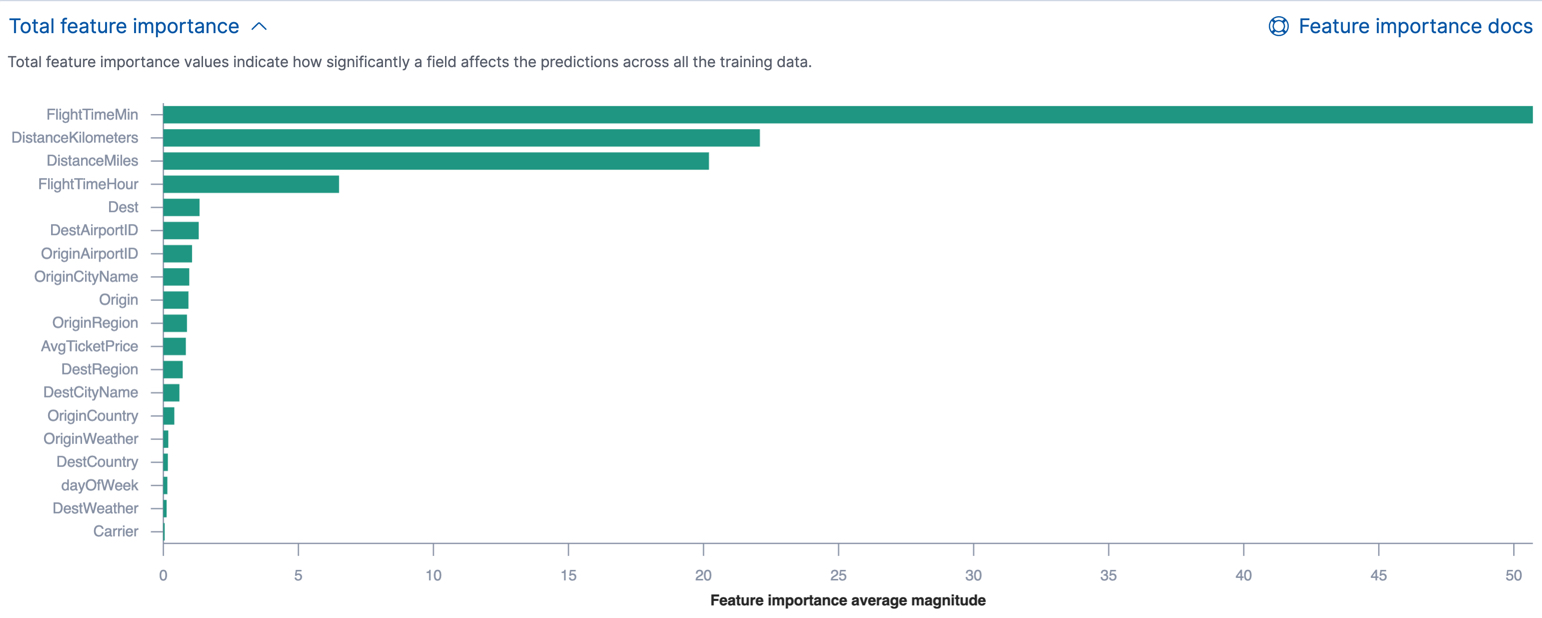
You can see the average magnitude of the feature importance values for each field across all the training data in Kibana or by using the get trained model API. For example, Kibana shows the total feature importance for each field in regression or binary classification analysis results as follows:
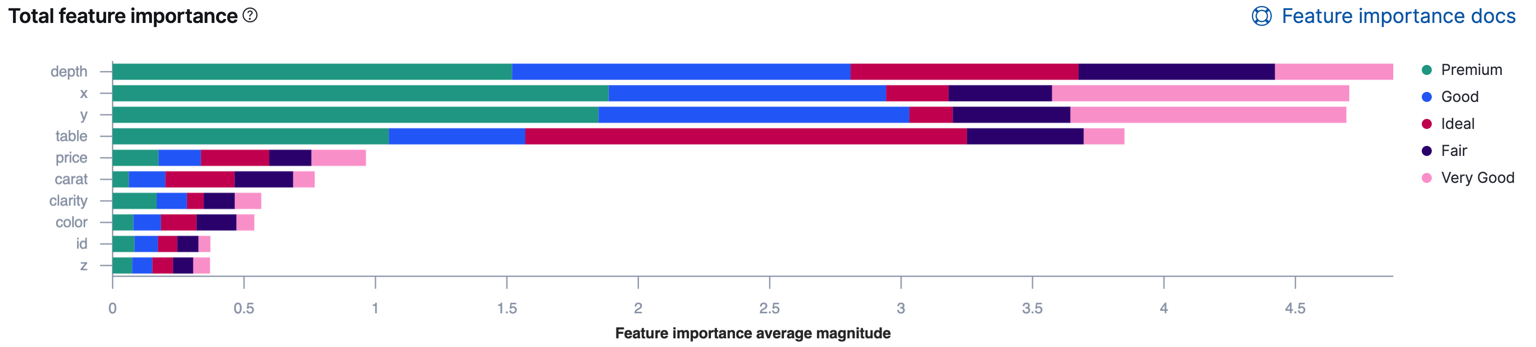
If the classification analysis involves more than two classes, Kibana uses colors to show how the impact of each field varies by class. For example:
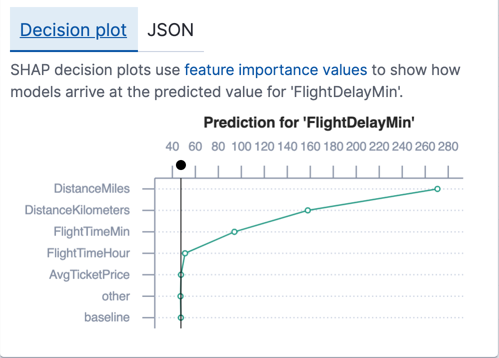
You can also examine the feature importance values for each individual prediction. In Kibana, you can see these values in JSON objects or decision plots. For regression analysis, each decision plot starts at a shared baseline, which is the average of the prediction values for all the data points in the training data set. When you add all of the feature importance values for a particular data point to that baseline, you arrive at the numeric prediction value. If a feature importance value is negative, it reduces the prediction value. If a feature importance value is positive, it increases the prediction value. For example:
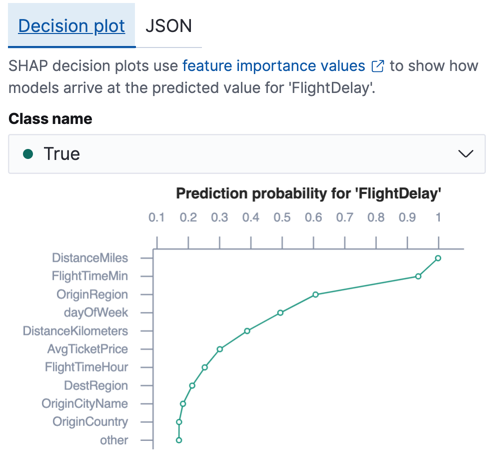
For classification analysis, the sum of the feature importance values approximates the predicted logarithm of odds for each data point. The simplest way to understand feature importance in the context of classification analysis is to look at the decision plots in Kibana. For each data point, there is a chart which shows the relative impact of each feature on the prediction probability for that class. This information helps you to understand which features reduces or increase the prediction probability. For example:
By default, feature importance values are not calculated. To generate this information,
when you create a data frame analytics job you must specify the
num_top_feature_importance_values property. For example, see
Performing regression analysis in the sample flight data set and Performing classification analysis in the sample flight data set.
The feature importance values are stored in the machine learning results field for each document in
the destination index. The number of feature importance values for each document might
be less than the num_top_feature_importance_values property value. For example,
it returns only features that had a positive or negative effect on the
prediction.
Further reading
edit- Feature importance in the Elastic Stack is calculated using the SHAP (SHapley Additive exPlanations) method as described in Lundberg, S. M., & Lee, S.-I. A Unified Approach to Interpreting Model Predictions. In NeurIPS 2017.
- Feature importance for data frame analytics with Elastic machine learning.
- Feature importance for data frame analytics (Jupyter notebook).