Performing population analysis
editPerforming population analysis
editEntities or events in your data can be considered anomalous when:
- Their behavior changes over time, relative to their own previous behavior, or
- Their behavior is different than other entities in a specified population.
The latter method of detecting outliers is known as population analysis. The machine learning analytics build a profile of what a "typical" user, machine, or other entity does over a specified time period and then identify when one is behaving abnormally compared to the population.
This type of analysis is most useful when the behavior of the population as a
whole is mostly homogeneous and you want to identify outliers. In general,
population analysis is not useful when members of the population inherently
have vastly different behavior. You can, however, segment your data into groups
that behave similarly and run these as separate jobs. For example, you can use a
query filter in the datafeed to segment your data or you can use the
partition_field_name to split the analysis for the different groups.
Population analysis scales well and has a lower resource footprint than individual analysis of each series. For example, you can analyze populations of hundreds of thousands or millions of entities.
To specify the population, use the over_field_name property. For example:
PUT _xpack/ml/anomaly_detectors/population
{
  "description" : "Population analysis",
  "analysis_config" : {
    "bucket_span":"10m",
    "influencers": [
      "username"
    ],
    "detectors": [
      {
        "function": "mean",
        "field_name": "bytesSent",
        "over_field_name": "username"
      }
    ]
  },
  "data_description" : {
    "time_field":"@timestamp",
    "time_format": "epoch_ms"
  }
}
|
This |
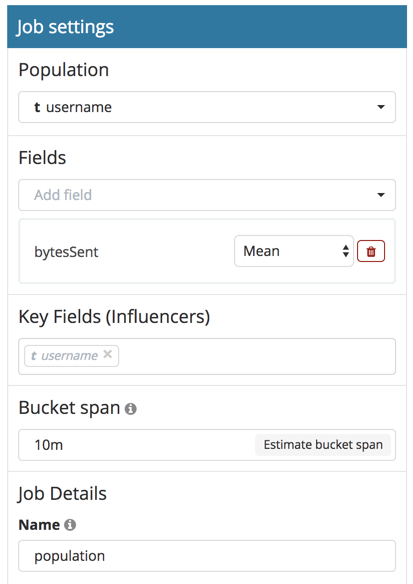
If your data is stored in Elasticsearch, you can use the population job wizard in Kibana to create a job with these same properties. For example, the population job wizard provides the following job settings:
After you open the job and start the datafeed or supply data to the job, you can view the results in Kibana. For example, you can view the results in the Anomaly Explorer:
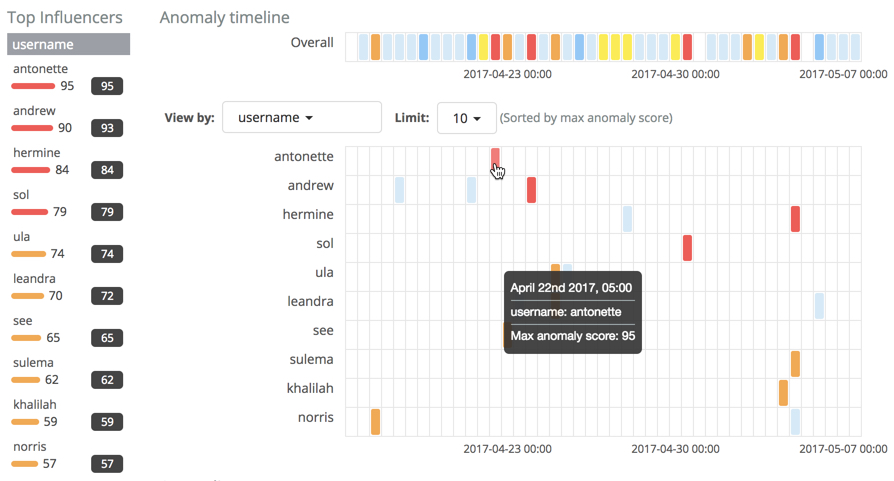
As in this case, the results are often quite sparse. There might be just a few data points for the selected time period. Population analysis is particularly useful when you have many entities and the data for specific entitles is sporadic or sparse.
If you click on a section in the timeline or swimlanes, you can see more details about the anomalies:
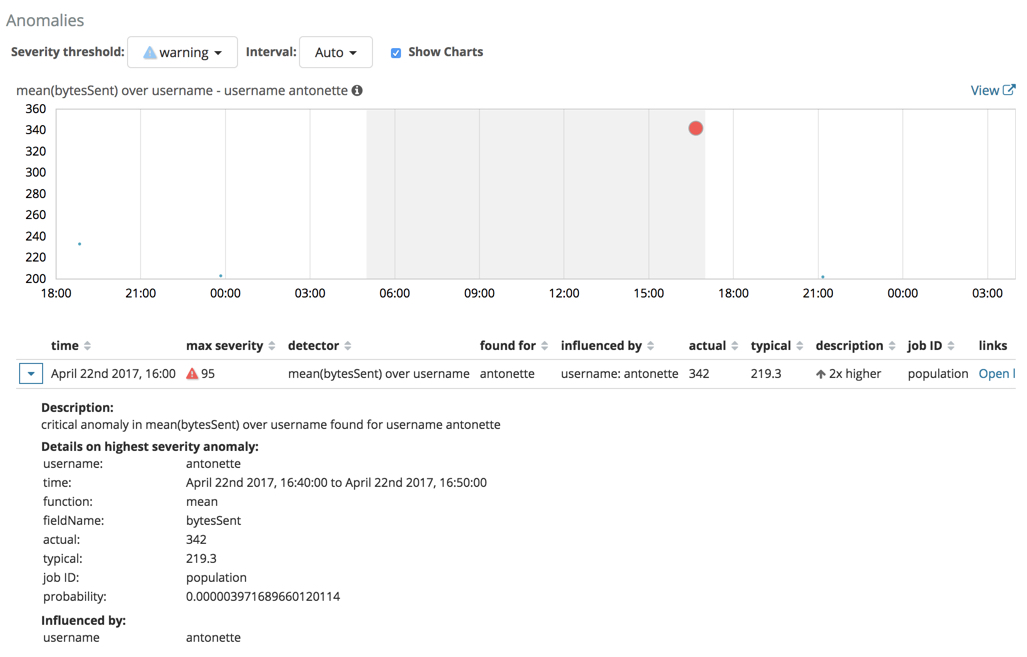
In this example, the user identified as antonette sent a high volume of bytes
on the date and time shown. This event is anomalous because the mean is two times
higher than the expected behavior of the population.