IMPORTANT: No additional bug fixes or documentation updates
will be released for this version. For the latest information, see the
current release documentation.
Monitoring UI
edit
IMPORTANT: This documentation is no longer updated. Refer to Elastic's version policy and the latest documentation.
Monitoring UI
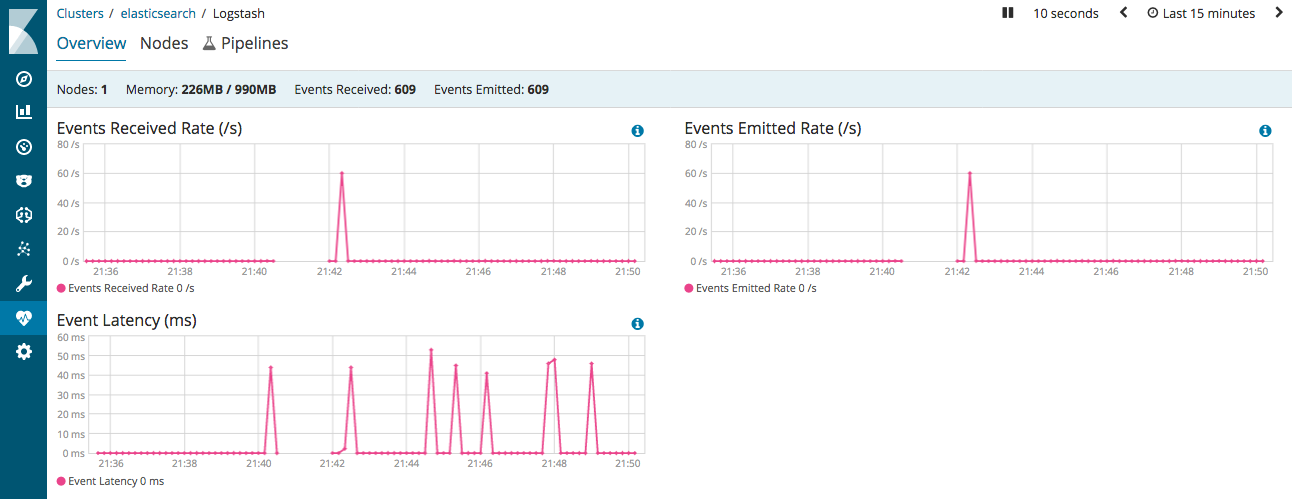
editUse the monitoring feature in X-Pack to view metrics and gain insight into how your Logstash deployment is running. In the overview dashboard, you can see all events received and sent by Logstash, plus info about memory usage and uptime:
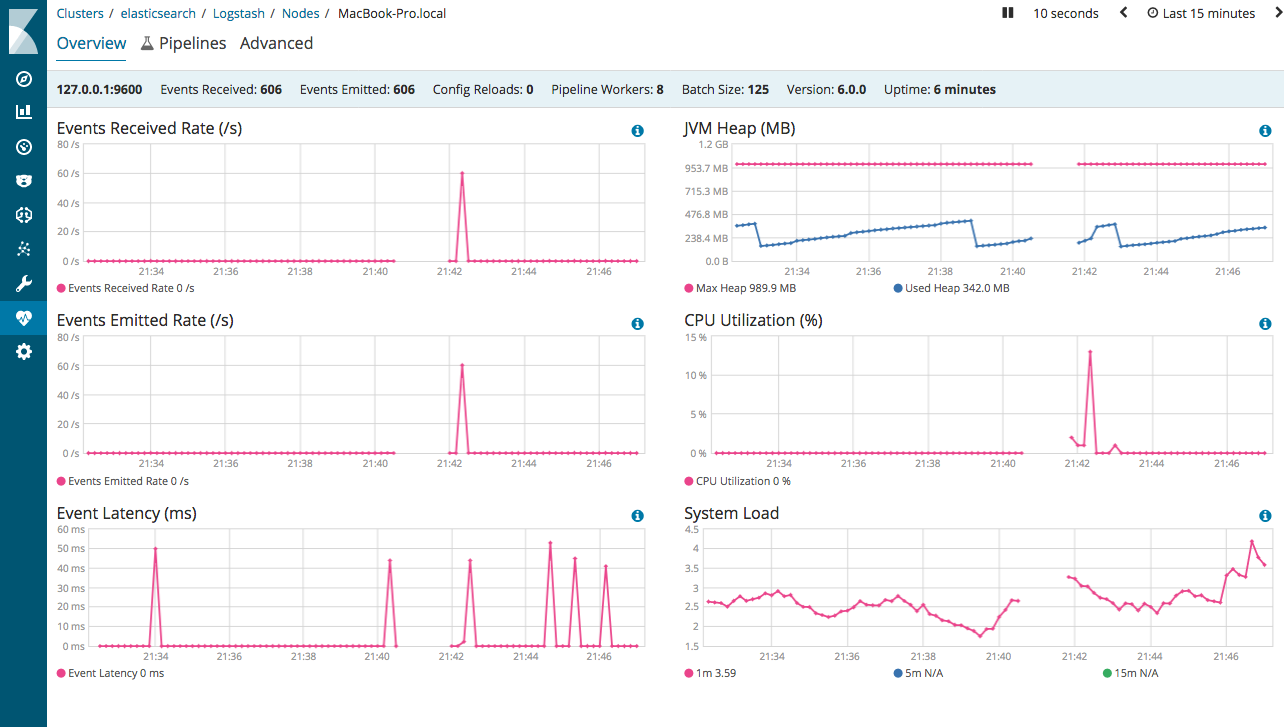
Then you can drill down to see stats about a specific node:
A Logstash node is considered unique based on its persistent UUID, which
is written to the path.data directory when the node
starts.
Before you can use the monitoring UI, configure Logstash monitoring.
For information about using the Monitoring UI, see X-Pack monitoring in Kibana.