Dead Letter Queues
editDead Letter Queues
editThe dead letter queue feature is currently supported for the elasticsearch output only. Additionally, The dead letter queue is only used where the response code is either 400 or 404, both of which indicate an event that cannot be retried. Support for additional outputs will be available in future releases of the Logstash plugins. Before configuring Logstash to use this feature, refer to the output plugin documentation to verify that the plugin supports the dead letter queue feature.
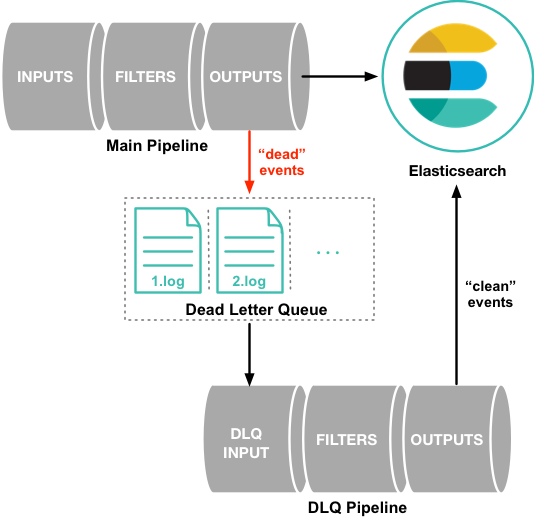
By default, when Logstash encounters an event that it cannot process because the data contains a mapping error or some other issue, the Logstash pipeline either hangs or drops the unsuccessful event. In order to protect against data loss in this situation, you can configure Logstash to write unsuccessful events to a dead letter queue instead of dropping them.
Each event written to the dead letter queue includes the original event, along with metadata that describes the reason the event could not be processed, information about the plugin that wrote the event, and the timestamp for when the event entered the dead letter queue.
To process events in the dead letter queue, you simply create a Logstash
pipeline configuration that uses the
dead_letter_queue input plugin to read
from the queue.
See Processing Events in the Dead Letter Queue for more information.
Configuring Logstash to Use Dead Letter Queues
editDead letter queues are disabled by default. To enable dead letter queues, set
the dead_letter_queue_enable option in the logstash.yml
settings file:
dead_letter_queue.enable: true
Dead letter queues are stored as files in the local directory of the Logstash
instance. By default, the dead letter queue files are stored in
path.data/dead_letter_queue. Each pipeline has a separate queue. For example,
the dead letter queue for the main pipeline is stored in
LOGSTASH_HOME/data/dead_letter_queue/main by default. The queue files are
numbered sequentially: 1.log, 2.log, and so on.
You can set path.dead_letter_queue in the logstash.yml file to
specify a different path for the files:
path.dead_letter_queue: "path/to/data/dead_letter_queue"
You may not use the same dead_letter_queue path for two different
Logstash instances.
File Rotation
editDead letter queues have a built-in file rotation policy that manages the file size of the queue. When the file size reaches a preconfigured threshold, a new file is created automatically.
By default, the maximum size of each dead letter queue is set to 1024mb. To
change this setting, use the dead_letter_queue.max_bytes option. Entries
will be dropped if they would increase the size of the dead letter queue beyond
this setting.
Processing Events in the Dead Letter Queue
editWhen you are ready to process events in the dead letter queue, you create a
pipeline that uses the
dead_letter_queue input plugin to read
from the dead letter queue. The pipeline configuration that you use depends, of
course, on what you need to do. For example, if the dead letter queue contains
events that resulted from a mapping error in Elasticsearch, you can create a
pipeline that reads the "dead" events, removes the field that caused the mapping
issue, and re-indexes the clean events into Elasticsearch.
The following example shows a simple pipeline that reads events from the dead letter queue and writes the events, including metadata, to standard output:
input {
  dead_letter_queue {
    path => "/path/to/data/dead_letter_queue"
    commit_offsets => true
    pipeline_id => "main"
  }
}

output {
  stdout {
    codec => rubydebug { metadata => true }
  }
}
|
The path to the top-level directory containing the dead letter queue. This
directory contains a separate folder for each pipeline that writes to the dead
letter queue. To find the path to this directory, look at the |
|
|
When |
|
|
The ID of the pipeline that’s writing to the dead letter queue. The default
is |
For another example, see Example: Processing Data That Has Mapping Errors.
When the pipeline has finished processing all the events in the dead letter queue, it will continue to run and process new events as they stream into the queue. This means that you do not need to stop your production system to handle events in the dead letter queue.
Events emitted from the
dead_letter_queue input plugin plugin
will not be resubmitted to the dead letter queue if they cannot be processed
correctly.
Reading From a Timestamp
editWhen you read from the dead letter queue, you might not want to process all the
events in the queue, especially if there are a lot of old events in the queue.
You can start processing events at a specific point in the queue by using the
start_timestamp option. This option configures the pipeline to start
processing events based on the timestamp of when they entered the queue:
input {
  dead_letter_queue {
    path => "/path/to/data/dead_letter_queue"
    start_timestamp => 2017-06-06T23:40:37
    pipeline_id => "main"
  }
}
For this example, the pipeline starts reading all events that were delivered to the dead letter queue on or after June 6, 2017, at 23:40:37.
Example: Processing Data That Has Mapping Errors
editIn this example, the user attempts to index a document that includes geo_ip data, but the data cannot be processed because it contains a mapping error:
{"geoip":{"location":"home"}}
Indexing fails because the Logstash output plugin expects a geo_point object in
the location field, but the value is a string. The failed event is written to
the dead letter queue, along with metadata about the error that caused the
failure:
{
   "@metadata" => {
    "dead_letter_queue" => {
       "entry_time" => #<Java::OrgLogstash::Timestamp:0x5b5dacd5>,
        "plugin_id" => "fb80f1925088497215b8d037e622dec5819b503e-4",
      "plugin_type" => "elasticsearch",
           "reason" => "Could not index event to Elasticsearch. status: 400, action: [\"index\", {:_id=>nil, :_index=>\"logstash-2017.06.22\", :_type=>\"doc\", :_routing=>nil}, 2017-06-22T01:29:29.804Z My-MacBook-Pro-2.local {\"geoip\":{\"location\":\"home\"}}], response: {\"index\"=>{\"_index\"=>\"logstash-2017.06.22\", \"_type\"=>\"doc\", \"_id\"=>\"AVzNayPze1iR9yDdI2MD\", \"status\"=>400, \"error\"=>{\"type\"=>\"mapper_parsing_exception\", \"reason\"=>\"failed to parse\", \"caused_by\"=>{\"type\"=>\"illegal_argument_exception\", \"reason\"=>\"illegal latitude value [266.30859375] for geoip.location\"}}}}"
    }
  },
  "@timestamp" => 2017-06-22T01:29:29.804Z,
    "@version" => "1",
       "geoip" => {
    "location" => "home"
  },
        "host" => "My-MacBook-Pro-2.local",
     "message" => "{\"geoip\":{\"location\":\"home\"}}"
}
To process the failed event, you create the following pipeline that reads from the dead letter queue and removes the mapping problem:
input {
  dead_letter_queue {
    path => "/path/to/data/dead_letter_queue/"
  }
}
filter {
  mutate {
    remove_field => "[geoip][location]"
  }
}
output {
  elasticsearch{
    hosts => [ "localhost:9200" ]
  }
}
|
The |
|
|
The |
|
|
The clean event is sent to Elasticsearch, where it can be indexed because the mapping issue is resolved. |