IMPORTANT: No additional bug fixes or documentation updates
will be released for this version. For the latest information, see the
current release documentation.
IMPORTANT: This documentation is no longer updated. Refer to Elastic's version policy and the latest documentation.
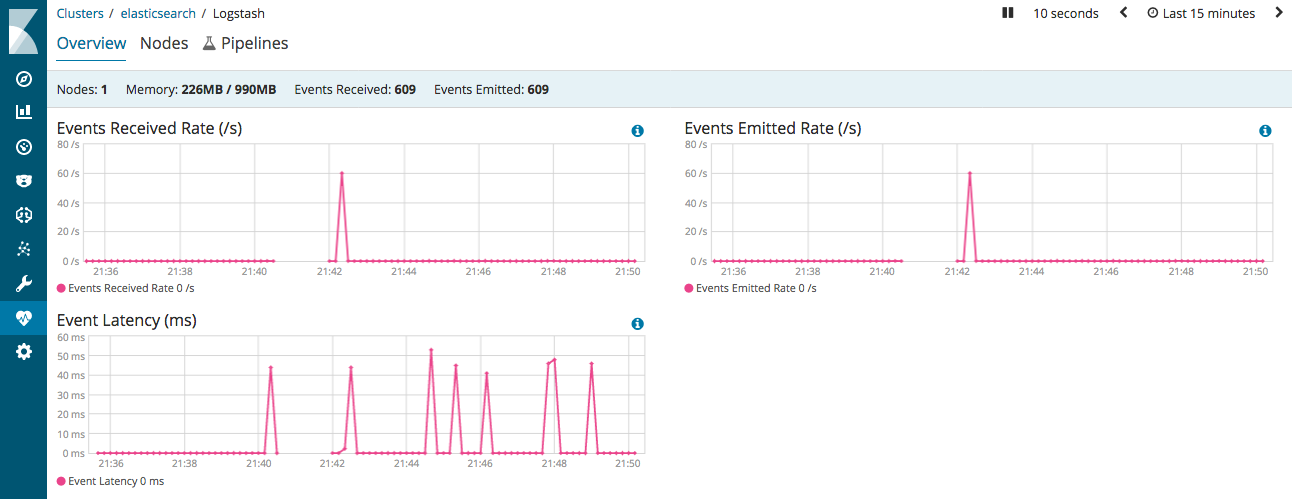
When running Logstash 5.2 or greater, you can use the monitoring feature in X-Pack to gain deep visibility into metrics about your Logstash deployment. In the overview dashboard, you can see all events received and sent by Logstash, plus info about memory usage and uptime:
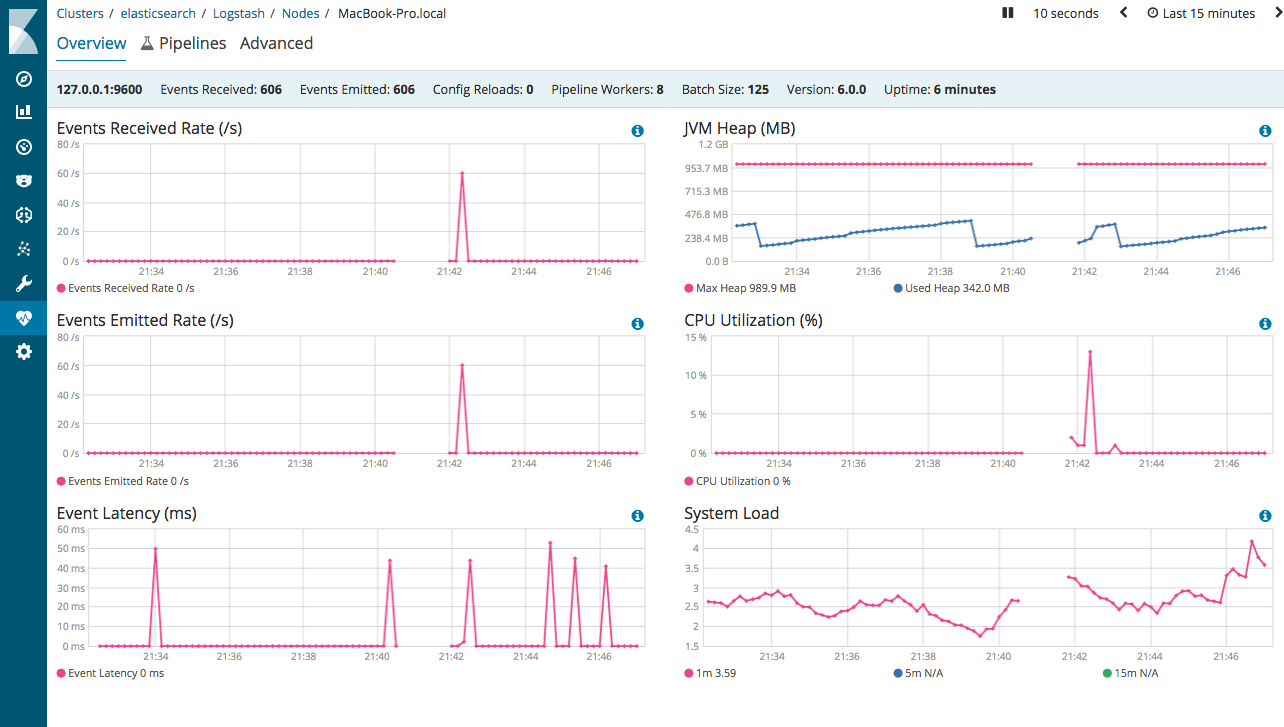
Then you can drill down to see stats about a specific node:
Before you can use the monitoring UI, you must set up X-Pack and configure Logstash monitoring.
For information about using the Monitoring UI, see X-Pack monitoring in Kibana.