Stack monitoringedit
This documentation is still in development and may be changed or removed in a future release.
An important step to making your environment production ready is to configure stack monitoring. Monitoring metrics can be sent to an external resource, such as Elasticsearch Service or Elastic Cloud on Kubernetes, so that in the event that any components of your environment become unresponsive, your monitoring data is available.
To enable Stack monitoring for Logstash, you need Metricbeat to collect Logstash metrics, Elasticsearch to store the metrics and Kibana to view the result.
Stack monitoring with Elastic Cloud on Kubernetes (ECK)edit
Be sure that you have ECK installed so that you can follow the example. Check out Prepare your environment for set up info.
For these examples, we will be modifying the Beats stack monitoring recipe from the ECK examples. This example initiates a production Elasticsearch cluster, a monitoring Elasticsearch cluster, Filebeat, Metricbeat, a production Kibana and a monitoring Kibana. It monitors Elasticsearch and Kibana and sends metrics to the monitoring cluster. We use autodiscover to configure monitoring for multiple Logstash instances.
Configure Metricbeatedit
To monitor Logstash, add the Logstash module to the recipe.
apiVersion: beat.k8s.elastic.co/v1beta1
kind: Beat
metadata:
  name: metricbeat
spec:
  type: metricbeat
  version: 8.4.2
  elasticsearchRef:
    name: elasticsearch-monitoring
  config:
    metricbeat:
      autodiscover:
        providers:
          - type: kubernetes
            scope: cluster
            hints.enabled: true
            templates:
              - condition:
                  contains:
                    kubernetes.labels.app: ls
                config:
                  - module: logstash
                    metricsets:
                      - node
                      - node_stats
                    period: 10s
                    hosts: "http://${data.host}:9600"
                    xpack.enabled: true
...
|
Metricbeat sends metrics to |
|
|
Metricbeat scans for the pods with label |
|
|
Metricbeat logstash module calls metric endpoint of each Logstash from port |
Configure Logstashedit
Add label app: ls to Deployment for autodiscover.
apiVersion: apps/v1
kind: Deployment
metadata:
  name: logstash
  labels:
    app: ls
...
After you have configured Metricbeat and Logstash, the configurations are ready to deploy. Go to View monitoring data in Kibana for info on how to confirm that everything is working.
Show Kibana metrics in the same Elasticsearch cluster (optional)edit
By default Logstash metrics will be shown in a standalone cluster. To associate data with the same cluster of Elasticsearch and Kibana, provide the cluster_uuid of the production Elasticsearch cluster to monitoring.cluster_uuid in logstash.yml.
apiVersion: v1
data:
  logstash.yml: |
    api.http.host: "0.0.0.0"
    monitoring.cluster_uuid: PRODUCTION_ES_CLUSTER_UUID
kind: ConfigMap
metadata:
  name: logstash-config
To get the cluster_uuid, go to Kibana > Stack Monitoring page. The URL in the browser shows the uuid in the form of cluster_uuid:PRODUCTION_ES_CLUSTER_UUID,.
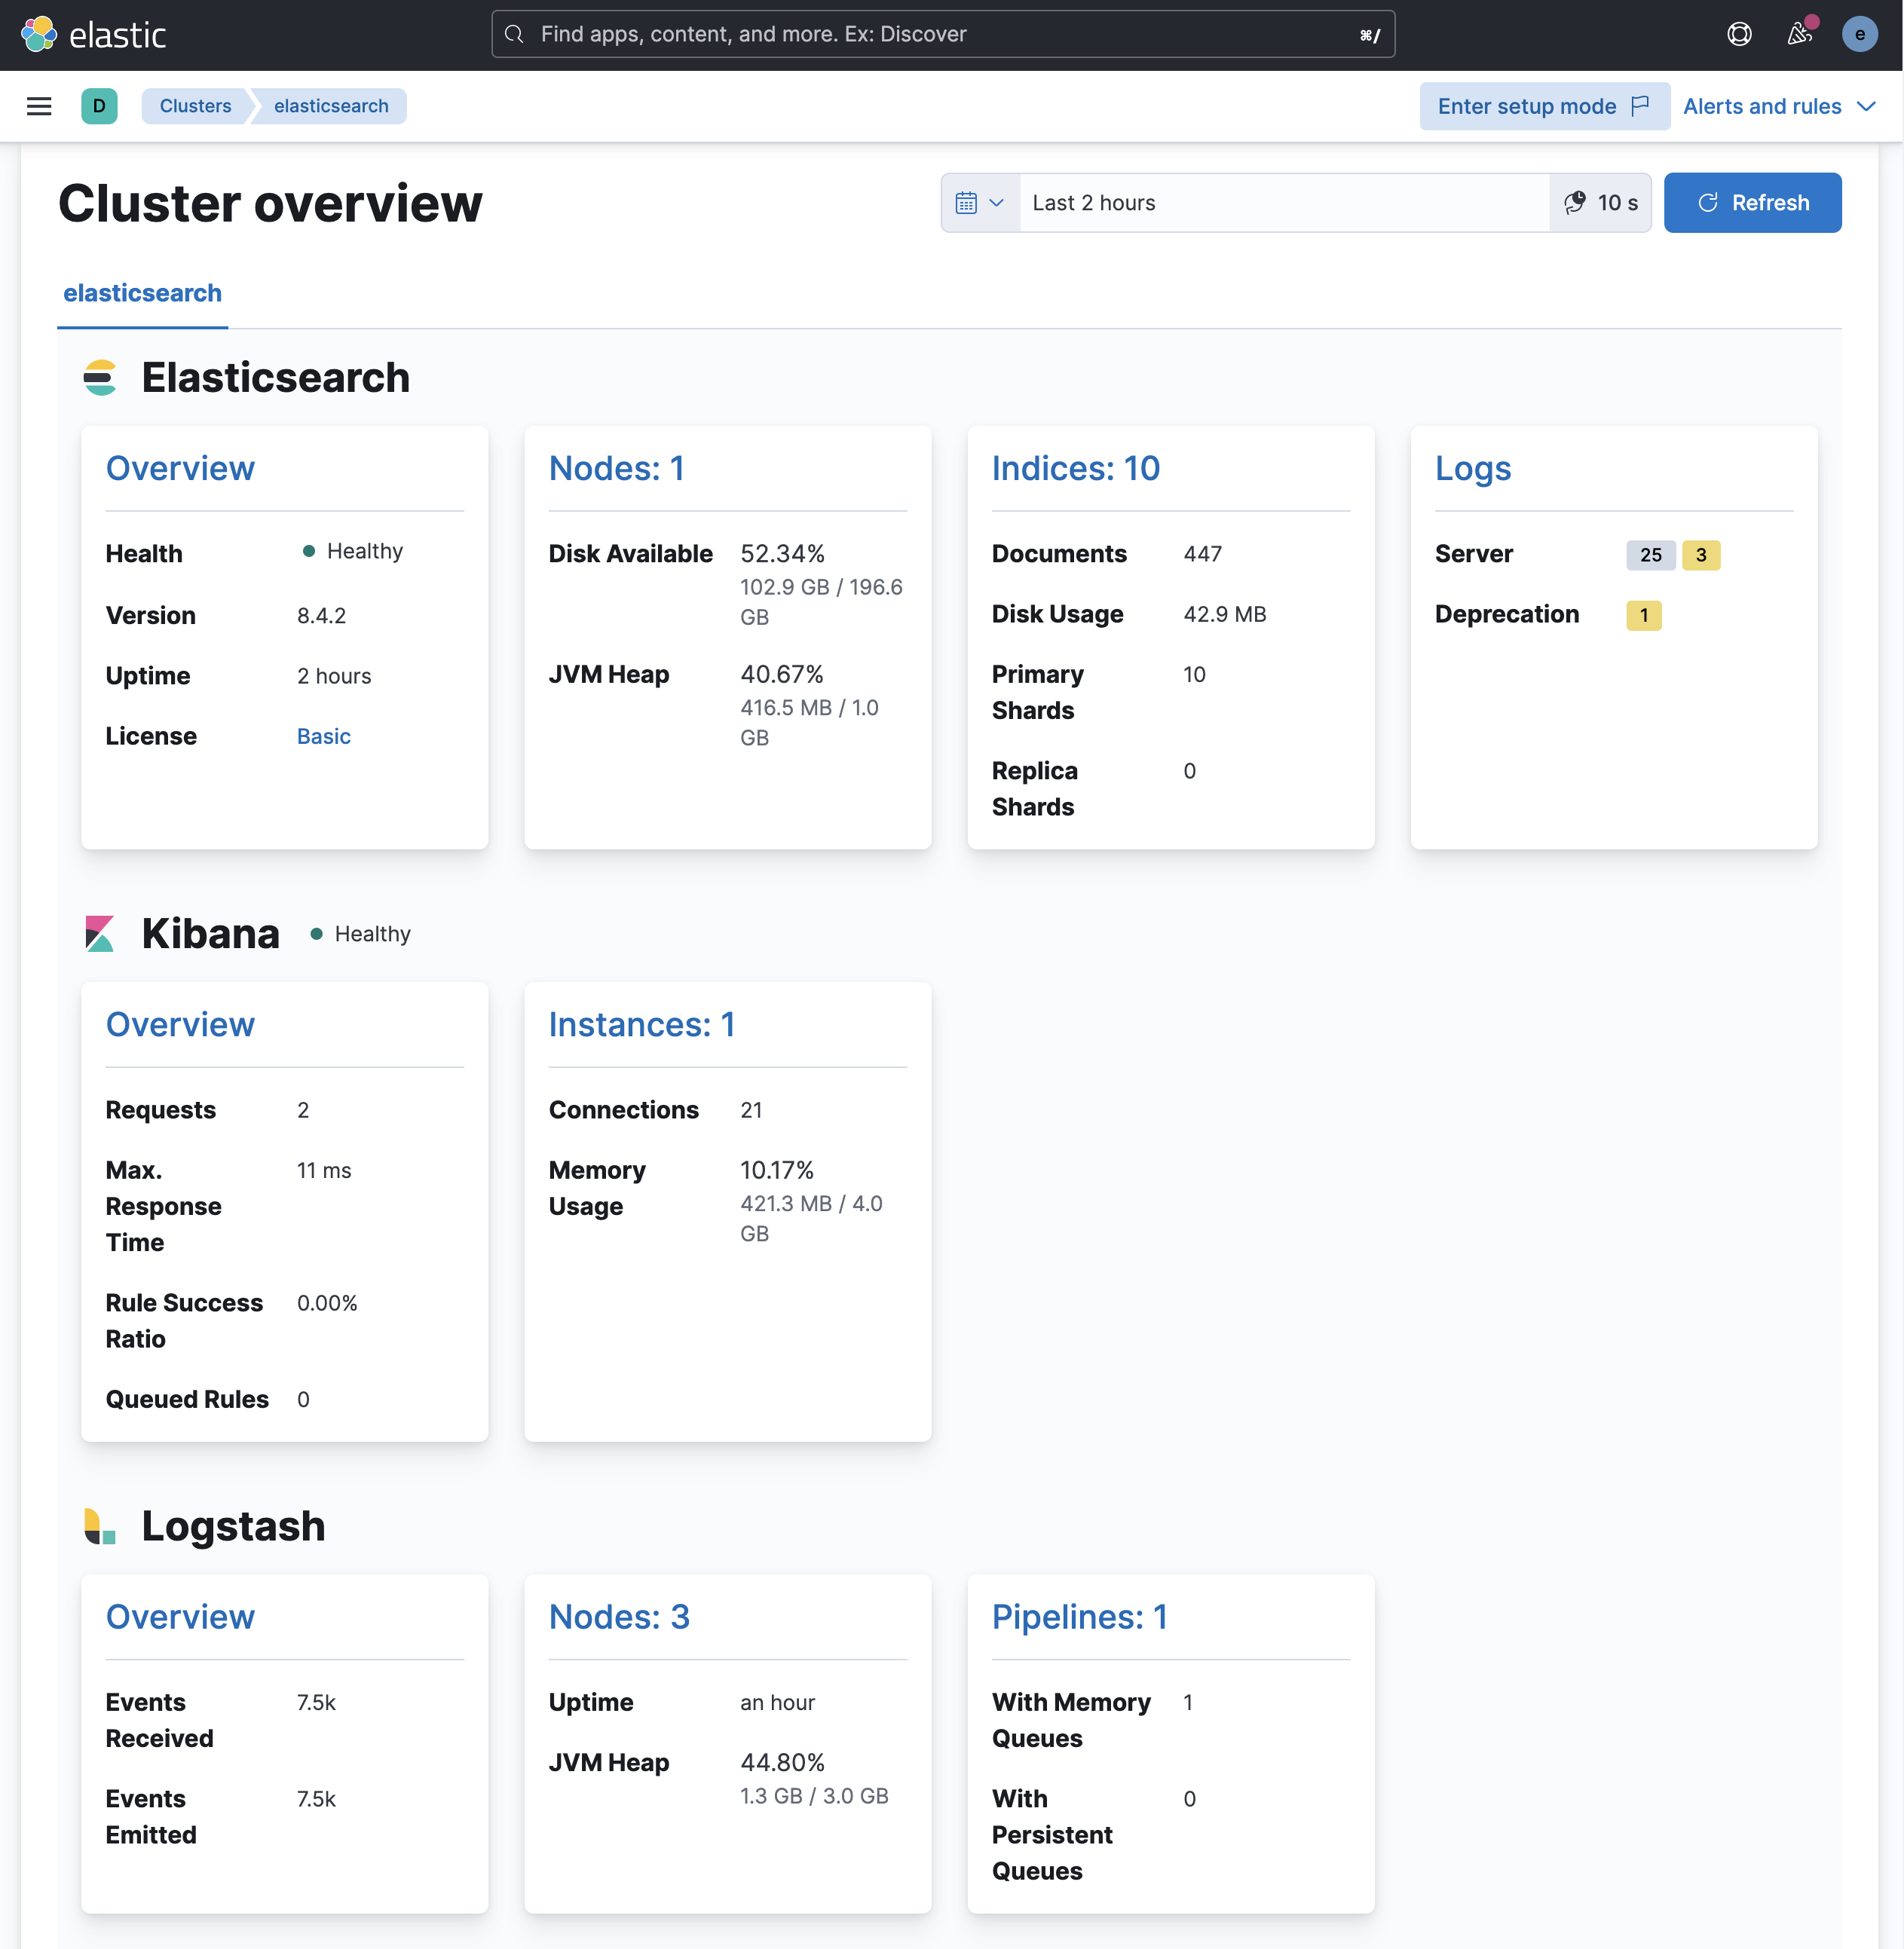
View monitoring data in Kibanaedit
When everything is set, the Kibana > Stack Monitoring page will show the Logstash data.
To access Kibana by https://localhost:5601, set the port forwarding:
kubectl port-forward service/kibana-monitoring-kb-http 5601
Get the login password:
kubectl get secret elasticsearch-monitoring-es-elastic-user -o=jsonpath='{.data.elastic}' | base64 --decode; echo
Ship metrics to external Elasticsearch clusteredit
Be sure that you have the Elastic CustomResourceDefinitions (CRDs) installed so that you can follow the example. Check out Prepare your environment for set up info.
Metrics can be sent to an Elasticsearch cluster that is not managed by ECK. To configure Metricbeat, remove the elasticsearchRef from the specification and include an output configuration in the spec.config.
apiVersion: beat.k8s.elastic.co/v1beta1
kind: Beat
metadata:
  name: metricbeat
spec:
  config:
    output.elasticsearch:
      hosts: ["https://es:9200"]
      username: "elastic"
      password: "changeme"
...
Ship metrics to Elastic Cloudedit
Be sure that you have the Elastic CustomResourceDefinitions (CRDs) installed so that you can follow the example. Check out Prepare your environment for set up info.
You can configure Metricbeat to send monitoring data to a hosted Elasticsearch Service on Elastic Cloud. To send to Elastic Cloud, remove the elasticsearchRef from the spec and set the cloud.id and cloud.auth for your Elastic Cloud monitoring cluster in the spec.config section of the Metricbeat configuration.
apiVersion: beat.k8s.elastic.co/v1beta1
kind: Beat
metadata:
  name: metricbeat
spec:
  config:
    cloud.id: CLOUD_ID
    cloud.auth: CLOUD_AUTH
...