Quick startedit
This documentation is still in development and may be changed or removed in a future release.
This guide walks you through setting up Logstash to deliver Kubernetes logs to Elasticsearch. Tasks include setting up a Kubernetes cluster that contains Elasticsearch and Kibana to store and visualize the logs. The logs are monitored by Filebeat, processed through a Logstash pipeline, and then delivered to the Elasticsearch pod in the Kubernetes cluster. We also walk you through configuring local stack monitoring using a Metricbeat pod to monitor Logstash.
This section includes the following topics:
Prerequisitesedit
You’ll need:
- A running Kubernetes cluster. For local/single node testing we recommend using Minikube, which allows you to easily run a single node Kubernetes cluster on your system. Check the minikube Get Started! section for install and set up instructions.
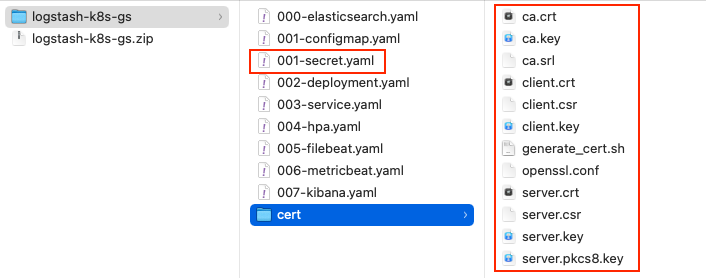
- A small zip file of config files. Download and expand this archive into an empty directory on your local system. The files are described in Sample configuration files.
Prepare your environmentedit
Install Elastic CRDsedit
To simplify installing other elements of the Elastic Stack, we will install Elastic custom resource definition (CRD) files and the elastic-operator custom controller, used to manage the Elastic resources in your cluster:
kubectl create -f https://download.elastic.co/downloads/eck/2.4.0/crds.yaml
kubectl apply -f https://download.elastic.co/downloads/eck/2.4.0/operator.yaml
The Elastic CRDs and ECK operator can also be set up using Elastic Helm charts, available at https://helm.elastic.co.
Check the Kubernetes pods status to confirm that the elastic-operator pod is running:
kubectl get pods
NAME                 READY   STATUS    RESTARTS      AGE
elastic-operator-0   1/1     Running   4 (12m ago)   13d
Generate certificate files and create Kubernetes Secret definitionedit
To help you enable secure communication between the Elastic Stack components in your Kubernetes cluster, we have provided a sample script to generate the CA certificate files. Details about these files are in Sample configuration files.
./cert/generate_cert.sh
Expand to view output
Generating RSA private key, 2048 bit long modulus
.......................+++
...........................................................................+++
e is 65537 (0x10001)
Generating RSA private key, 2048 bit long modulus
..............................................+++
.............................................+++
e is 65537 (0x10001)
Signature ok
subject=/C=EU/ST=NA/O=Elastic/CN=ServerHostName
Getting CA Private Key
Generating RSA private key, 2048 bit long modulus
............+++
.......................................................................................................................................+++
e is 65537 (0x10001)
Signature ok
subject=/C=EU/ST=NA/O=Elastic/CN=ClientName
Getting CA Private Key
Your logstash-k8s-qs/cert folder should now contain a set of certificate files, including client certificates for Filebeat and Metricbeat, and server certificates for Logstash.
The parent logstash-k8s-qs directory also has a new 001-secret.yaml resources file that stores a hash of the client and server certificates.
Create the Kubernetes clusteredit
As part of this configuration, we will set up Elastic Stack components and Logstash.
Create the Elastic Stack componentsedit
Now that your environment and certificates are set up, it’s time to add the Elastic Stack. We will create:
- Elasticsearch - you know, for search
- Kibana - for data visualization
- Filebeat - to monitor container logs
- Metricbeat - to monitor Logstash and send stack monitoring data to the monitoring cluster.
- Secret definitions containing the keys and certificates we generated earlier.
Run this command to deploy the example using the sample resources provided:
kubectl apply -f "000-elasticsearch.yaml,001-secret.yaml,005-filebeat.yaml,006-metricbeat.yaml,007-kibana.yaml"
The Elastic Stack resources are created:
elasticsearch.elasticsearch.k8s.elastic.co/demo created
secret/logstash-beats-tls created
beat.beat.k8s.elastic.co/demo created
beat.beat.k8s.elastic.co/demo configured
kibana.kibana.k8s.elastic.co/demo created
kubectl get pods
The pods are starting up. You may need to wait a minute or two for all of them to be ready.
NAME                                    READY   STATUS    RESTARTS       AGE
demo-beat-filebeat-7f4d97f69f-qkkbl     1/1     Running   0              42s
demo-beat-metricbeat-59f4b68cc7-9zrrn   1/1     Running   0              39s
demo-es-default-0                       1/1     Running   0              41s
demo-kb-d7f585494-vbf6s                 1/1     Running   0              39s
elastic-operator-0                      1/1     Running   4 (164m ago)   13d
Set up Logstashedit
We have our Elastic Stack set up. Let’s set up Logstash.
We typically use ConfigMaps to set up Logstash configurations and pipeline definitions in Kubernetes. Check out Logstash Configuration files in Kubernetes for more details.
Then, we’ll create the deployment definition for Logstash, including memory, CPU resources, the container ports, timeout settings, and similar, and the Service definition, opening up ports on the logstash pods to the internal metricbeat (for stack monitoring) and filebeat in this instance
Let’s create a Deployment.
Some Logstash configurations—such as those using certain classes of plugins or a persistent queue—should be configured using a StatefulSet.
kubectl apply -f "001-configmap.yaml,002-deployment.yaml,003-service.yaml"
We should now see the Logstash pod up and running:
kubectl get pods
The pods are starting up. You may need to wait a minute or two for all of them to be ready.
NAME                                    READY   STATUS    RESTARTS       AGE
demo-beat-filebeat-7f4d97f69f-qkkbl     1/1     Running   0              42s
demo-beat-metricbeat-59f4b68cc7-9zrrn   1/1     Running   0              39s
demo-es-default-0                       1/1     Running   0              41s
demo-kb-d7f585494-vbf6s                 1/1     Running   0              39s
elastic-operator-0                      1/1     Running   4 (164m ago)   13d
logstash-7974b9ccb9-jd5xl               1/1     Running   0              42s
View your dataedit
First, enable port forwarding for the Kibana service on port 5601. Open a second shell window and run:
kubectl port-forward service/demo-kb-http 5601
Then, open up a web browser at address https://localhost:5601. Depending on your browser you may need to accept the site certificate.
Log in to Kibana using the elastic username and password. To obtain the password, run:
kubectl get secret demo-es-elastic-user -o=jsonpath='{.data.elastic}' | base64 --decode; echo
We are sending two types of data to Elasticsearch: [k8s} logs and stack monitoring data.
View your Kubernetes logsedit
The Filebeat instance attached to this cluster sends log entries from the kube-api-server logs to an index specified in the Logstash configuration.
To verify that this data is indeed being sent to Elasticsearch, open the Kibana main menu and select Management > Dev Tools, and perform this query:
GET kube-apiserver-*/_count
The count rises as events are discovered from the apiserver logs.
{
  "count": 89,
  "_shards": {
    "total": 1,
    "successful": 1,
    "skipped": 0,
    "failed": 0
  }
}
View the stack monitoring dataedit
Open the Kibana main menu and select Management, then Stack Monitoring.
Select the Logstash Overview, and under the Nodes tab select the link for the Logstash node.
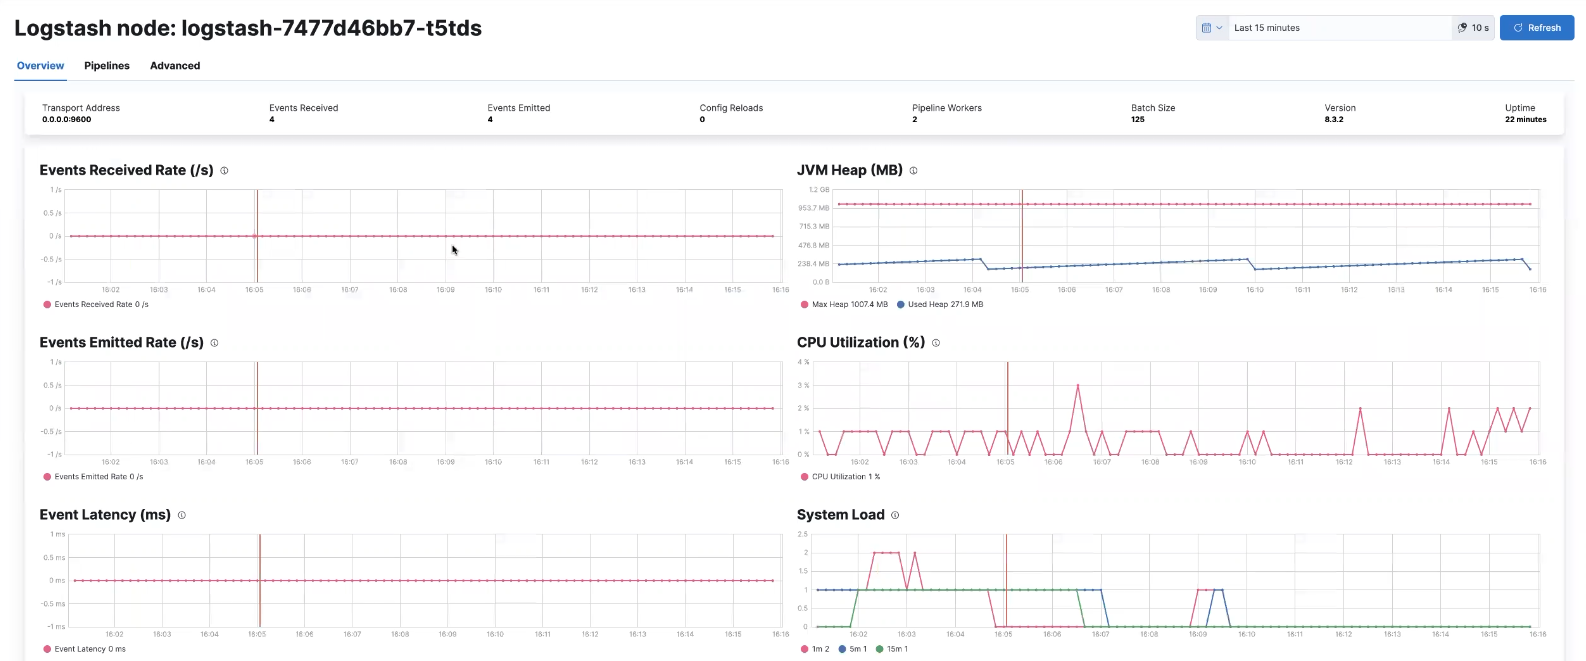
That’s it! The Logstash pod metrics data is flowing through Logstash into Elasticsearch and Kibana. You can monitor the JVM Heap, CPU Utilization, and System Load data as it updates in real time.
Tidy upedit
After finishing with this demo, you can run the following command to remove all of the created resources:
kubectl delete service,pods,deployment,configmap,secret,beat,elasticsearch,kibana -l app=logstash-demo
Next stepsedit
Send logs to an external Elasticsearch instanceedit
You aren’t limited to sending data to an Elasticsearch cluster that is located in the same Kubernetes cluster as Logstash. You can send data to Elastic cloud, for example.
Sending to Elastic Cloudedit
We need only the Logstash-based components to connect to Elastic cloud. You won’t need to include the Elasticsearch or Kibana components from the earlier examples.
Let’s amend the Deployment/StatefulSet to set CLOUD_ID and API_KEY environment variables with the appropriate value for your cloud instance.
One way to do this is to create a secret to store CLOUD_ID and API_KEY:
apiVersion: v1
kind: Secret
metadata:
  name: ess_secret
type: Opaque
data:
  cloud_id: PENMT1VEX0lEPg==
  password: PEFQSV9LRVk+
|
base64 representation of echo -n '<CLOUD_ID>' | base64 echo -n '<API_KEY>' | base64 |
Mount the secrets in the Deployment/StatefulSet:
env:
  - name: CLOUD_ID
      valueFrom:
        secretKeyRef:
          name: ess_secret
          key: cloud_id
    - name: API_KEY
      valueFrom:
        secretKeyRef:
          name: ess_secret
          key: api_key
Let’s amend the pipeline definition ConfigMap to change the destination of the Elasticsearch output to the cloud instance.
    output {
      elasticsearch {
        cloud_id => "CLOUD_ID"
        api_key => "API_KEY"
        ssl => true
      }
Scale Logstash with Horizontal Pod Autoscaleredit
For a simple Logstash setup without persistent storage or plugins that require the storing of local state, we can introduce a simple horizontal pod autoscaler.
Apply the autoscaler:
kubectl apply -f "004-hpa.yaml"
If you are using more than one Logstash pod, use the beats autodiscover features to monitor them. Otherwise, only one Logstash pod is monitored. See the stack monitoring with ECK docs for details on how to use autodiscover with Metricbeat and Logstash.
Learn moreedit
Now that you’re familiar with how to get a Logstash monitoring setup running in your Kubernetes environment, here are a few suggested next steps:
As well, we have a variety of recipes that you can use as templates to configure an environment to match your specific use case.