Collect Kibana monitoring data with Metricbeat
editCollect Kibana monitoring data with Metricbeat
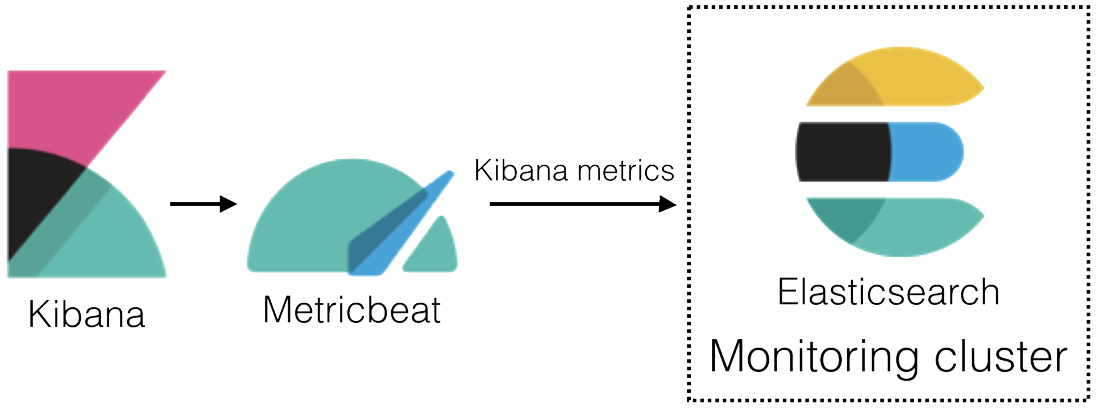
editIn 6.4 and later, you can use Metricbeat to collect data about Kibana and ship it to the monitoring cluster, rather than routing it through the production cluster as described in Legacy collection methods.
To learn about monitoring in general, see Monitor a cluster.
-
Disable the default collection of Kibana monitoring metrics.
Add the following setting in the Kibana configuration file (
kibana.yml):monitoring.kibana.collection.enabled: false
Leave the
monitoring.enabledset to its default value (true). For more information, see Monitoring settings in Kibana. - Start Kibana.
-
Set the
xpack.monitoring.collection.enabledsetting totrueon each node in the production cluster. By default, it is disabled (false).You can specify this setting in either the
elasticsearch.ymlon each node or across the cluster as a dynamic cluster setting. If Elasticsearch security features are enabled, you must havemonitorcluster privileges to view the cluster settings andmanagecluster privileges to change them.-
In Kibana:
-
Open Kibana in your web browser.
If you are running Kibana locally, go to
http://localhost:5601/.If the Elastic security features are enabled, log in.
- In the side navigation, click Stack Monitoring. If data collection is disabled, you are prompted to turn it on.
-
-
From the Console or command line, set
xpack.monitoring.collection.enabledtotrueon the production cluster.For example, you can use the following APIs to review and change this setting:
GET _cluster/settings

PUT _cluster/settings
{
  "persistent": {
    "xpack.monitoring.collection.enabled": true
  }
}
For more information, see Monitoring settings in Elasticsearch and Cluster update settings.
-
- Install Metricbeat on the same server as Kibana.
-
Enable the Kibana X-Pack module in Metricbeat.
For example, to enable the default configuration in the
modules.ddirectory, run the following command:metricbeat modules enable kibana-xpack
For more information, see Specify which modules to run and Kibana module.
-
Configure the Kibana X-Pack module in Metricbeat.
The
modules.d/kibana-xpack.ymlfile contains the following settings:- module: kibana metricsets: - stats period: 10s hosts: ["localhost:5601"] #basepath: "" #username: "user" #password: "secret" xpack.enabled: trueBy default, the module collects Kibana monitoring metrics from
localhost:5601. If that host and port number are not correct, you must update thehostssetting. If you configured Kibana to use encrypted communications, you must access it via HTTPS. For example, use ahostssetting likehttps://localhost:5601.If the Elastic security features are enabled, you must also provide a user ID and password so that Metricbeat can collect metrics successfully:
-
Create a user on the production cluster that has the
remote_monitoring_collectorbuilt-in role. Alternatively, use theremote_monitoring_userbuilt-in user. -
Add the
usernameandpasswordsettings to the Kibana module configuration file.
-
Create a user on the production cluster that has the
-
Optional: Disable the system module in Metricbeat.
By default, the system module is enabled. The information it collects, however, is not shown on the Monitoring page in Kibana. Unless you want to use that information for other purposes, run the following command:
metricbeat modules disable system
-
Identify where to send the monitoring data.
In production environments, we strongly recommend using a separate cluster (referred to as the monitoring cluster) to store the data. Using a separate monitoring cluster prevents production cluster outages from impacting your ability to access your monitoring data. It also prevents monitoring activities from impacting the performance of your production cluster.
For example, specify the Elasticsearch output information in the Metricbeat configuration file (
metricbeat.yml):output.elasticsearch: # Array of hosts to connect to. hosts: ["<HOST_1>:9200", "<HOST_2>:9200"] # Optional protocol and basic auth credentials. #protocol: "https" #username: "elastic" #password: "changeme"
If you configured the monitoring cluster to use encrypted communications, you must access it via HTTPS. For example, use a
hostssetting like<HOST_URL>:9200.The Elasticsearch monitoring features use ingest pipelines. The cluster that stores the monitoring data must have at least one node with the
ingestrole.If the Elasticsearch security features are enabled on the monitoring cluster, you must provide a valid user ID and password so that Metricbeat can send metrics successfully:
-
Create a user on the monitoring cluster that has the
remote_monitoring_agentbuilt-in role. Alternatively, use theremote_monitoring_userbuilt-in user. -
Add the
usernameandpasswordsettings to the Elasticsearch output information in the Metricbeat configuration file.
For more information about these configuration options, see Configure the Elasticsearch output.
-
Create a user on the monitoring cluster that has the
- Start Metricbeat.
- View the monitoring data in Kibana.