View monitoring data in Kibana
editView monitoring data in Kibana
editAfter you collect monitoring data for one or more products in the Elastic Stack, you can configure Kibana to retrieve that information and display it in on the Stack Monitoring page.
At a minimum, you must have monitoring data for the Elasticsearch production cluster. Once that data exists, Kibana can display monitoring data for other products in the cluster.
If you use a separate monitoring cluster to store the monitoring data, it is strongly recommended that you use a separate Kibana instance to view it. If you log in to Kibana using SAML, Kerberos, PKI, OpenID Connect, or token authentication providers, a dedicated Kibana instance is required. The security tokens that are used in these contexts are cluster-specific, therefore you cannot use a single Kibana instance to connect to both production and monitoring clusters. For more information about the recommended configuration, see Monitoring overview.
-
Identify where to retrieve monitoring data from.
If the monitoring data is stored on a dedicated monitoring cluster, it is accessible even when the cluster you’re monitoring is not. If you have at least a gold license, you can send data from multiple clusters to the same monitoring cluster and view them all through the same instance of Kibana.
By default, data is retrieved from the cluster specified in the
elasticsearch.hostsvalue in thekibana.ymlfile. If you want to retrieve it from a different cluster, setmonitoring.ui.elasticsearch.hosts.To learn more about typical monitoring architectures, see How monitoring works and Monitoring in a production environment.
-
Verify that
monitoring.ui.enabledis set totrue, which is the default value, in thekibana.ymlfile. For more information, see Monitoring settings. -
If the Elastic security features are enabled on the monitoring cluster, you must provide a user ID and password so Kibana can retrieve the data.
-
Create a user that has the
monitoring_userbuilt-in role on the monitoring cluster. -
Add the
monitoring.ui.elasticsearch.usernameandmonitoring.ui.elasticsearch.passwordsettings in thekibana.ymlfile. If these settings are omitted, Kibana uses theelasticsearch.usernameandelasticsearch.passwordsetting values. For more information, see Configuring security in Kibana.
-
Create a user that has the
- (Optional) Configure Kibana to encrypt communications between the Kibana server and the monitoring cluster. See Encrypt TLS communications in Kibana.
-
If the Elastic security features are enabled on the Kibana server, only users that have the authority to access Kibana indices and to read the monitoring indices can use the monitoring dashboards.
These users must exist on the monitoring cluster. If you are accessing a remote monitoring cluster, you must use credentials that are valid on both the Kibana server and the monitoring cluster.
-
Create users that have the
monitoring_userandkibana_adminbuilt-in roles.
-
Create users that have the
-
Open Kibana in your web browser.
By default, if you are running Kibana locally, go to
http://localhost:5601/.If the Elastic security features are enabled, log in.
-
Open the main menu, then click Stack Monitoring.
If data collection is disabled, you are prompted to turn on data collection. If Elasticsearch security features are enabled, you must have
managecluster privileges to turn on data collection.If you are using a separate monitoring cluster, you do not need to turn on data collection. The dashboards appear when there is data in the monitoring cluster.
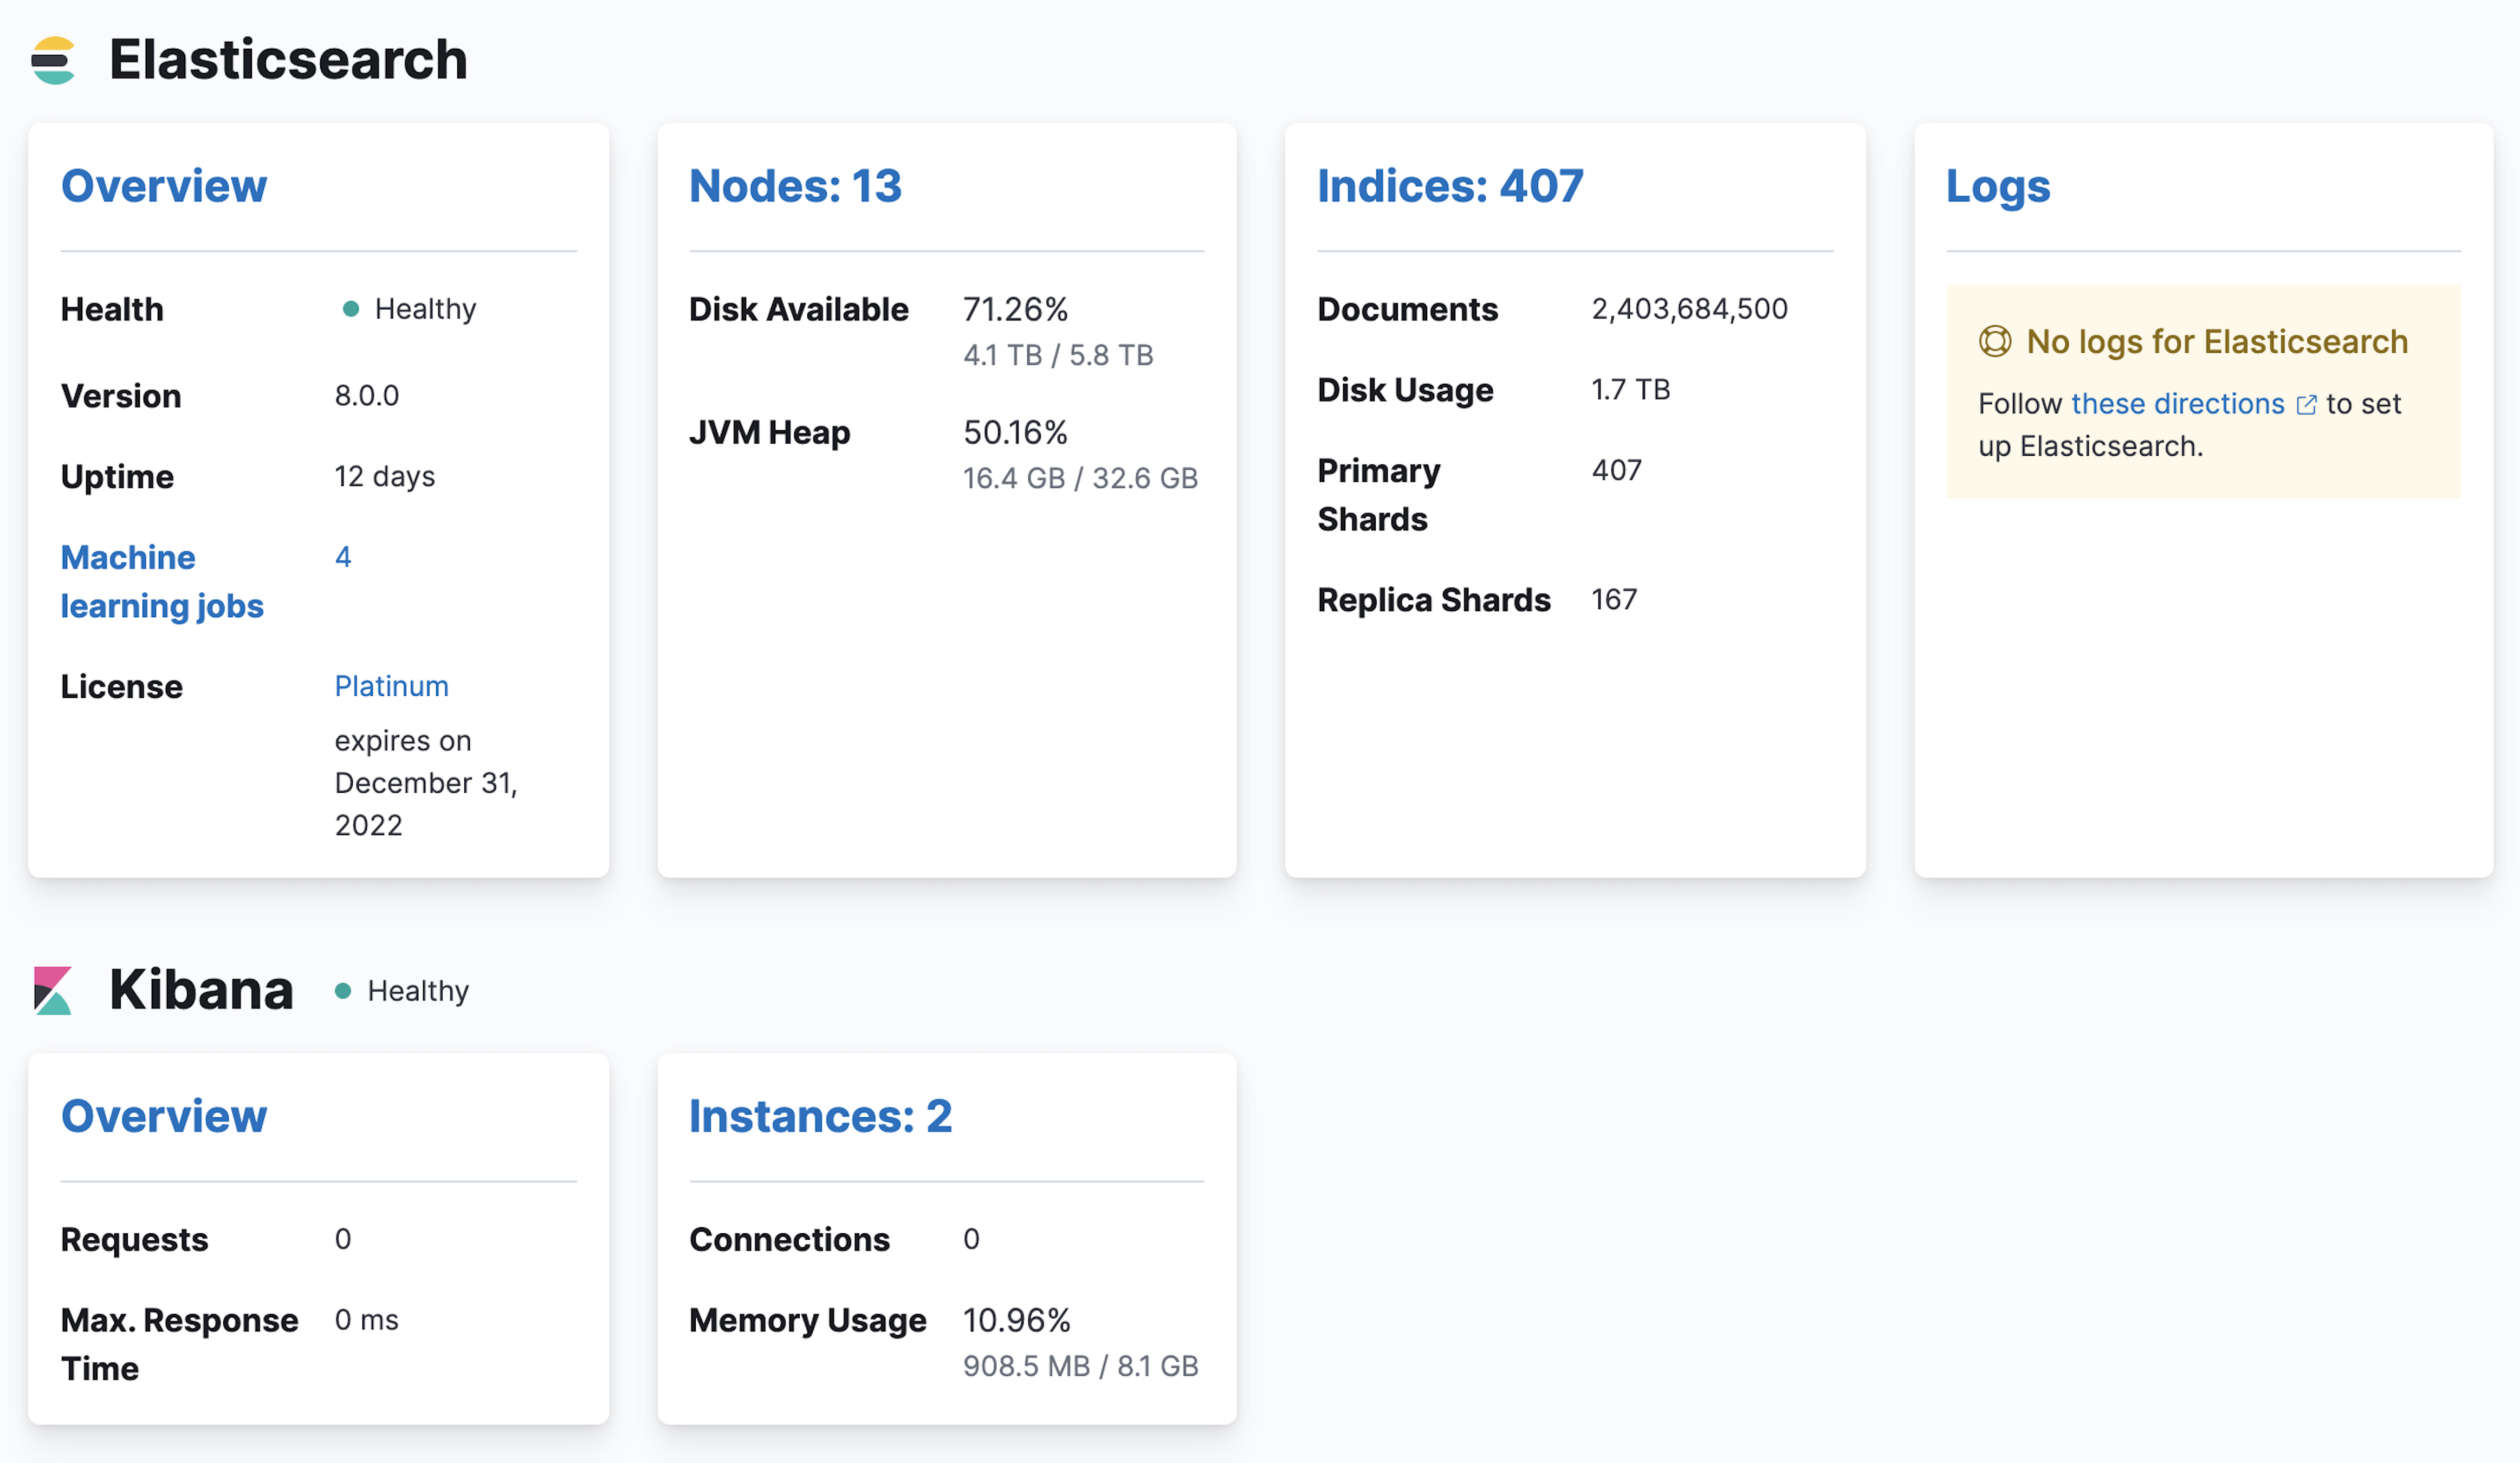
You’ll see cluster alerts that require your attention and a summary of the available monitoring metrics for Elasticsearch, Logstash, Kibana, and Beats. To view additional information, click the Overview, Nodes, Indices, or Instances links. See Stack Monitoring.
If you encounter problems, see Troubleshooting monitoring.