Maps
editMaps
editCreate beautiful maps from your geographical data. With Maps, you can:
- Build maps with multiple layers and indices.
- Animate spatial temporal data.
- Upload GeoJSON.
- Embed your map in dashboards.
- Symbolize features using data values.
- Focus on only the data that’s important to you.
Ready to get started? Watch the video, and then start your tour of Maps with the getting started tutorial.
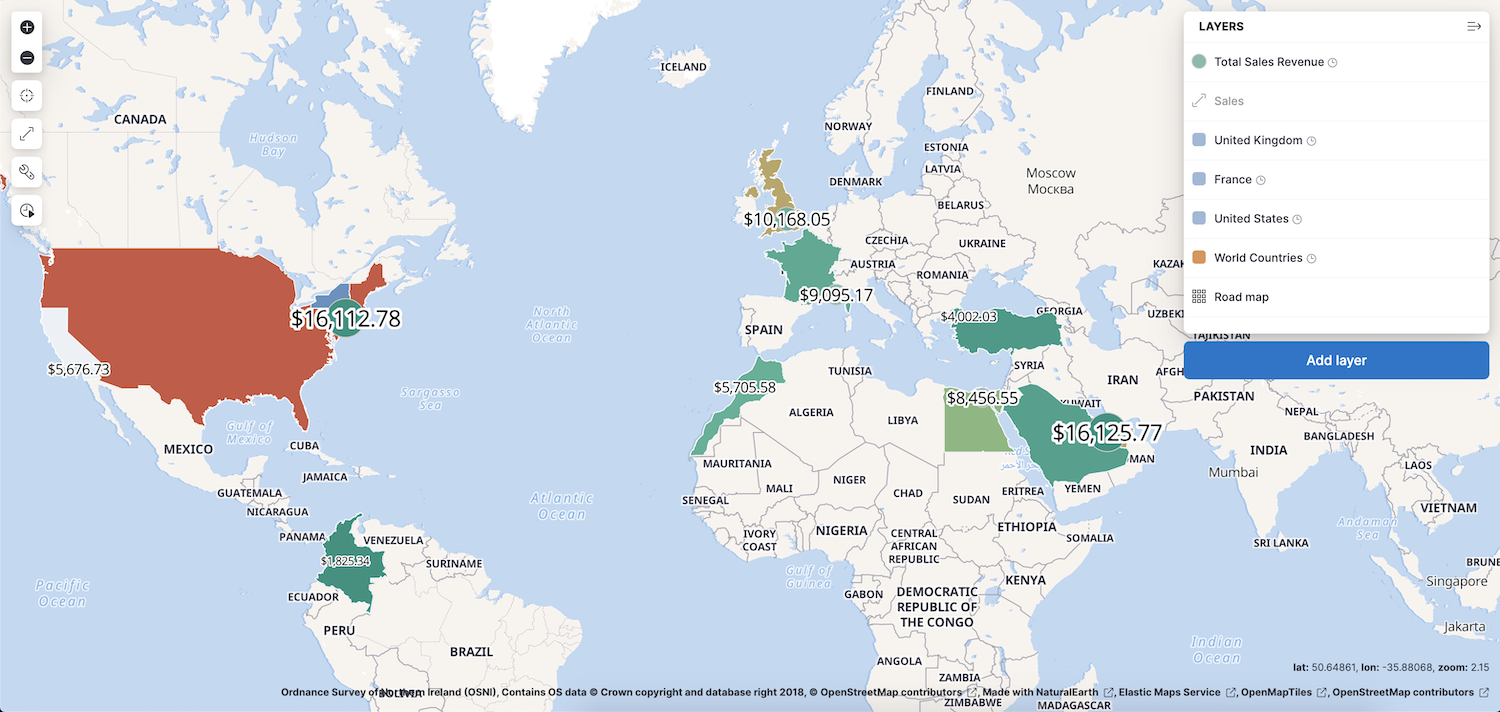
Build maps with multiple layers and indices
editUse multiple layers and indices to show all your data in a single map. Show how data sits relative to physical features like weather patterns, human-made features like international borders, and business-specific features like sales regions. Plot individual documents or use aggregations to plot any data set, no matter how large.
Animate spatial temporal data
editData comes to life with animation. Hard to detect patterns in static data pop out with movement. Use time slider to animate your data and gain deeper insights.
This animated map uses the time slider to show Portland buses over a period of 15 minutes. The routes come alive as the bus locations update with time.
Upload GeoJSON
editUse Maps to drag and drop your GeoJSON points, lines, and polygons into Elasticsearch, and then use them as layers in your map.
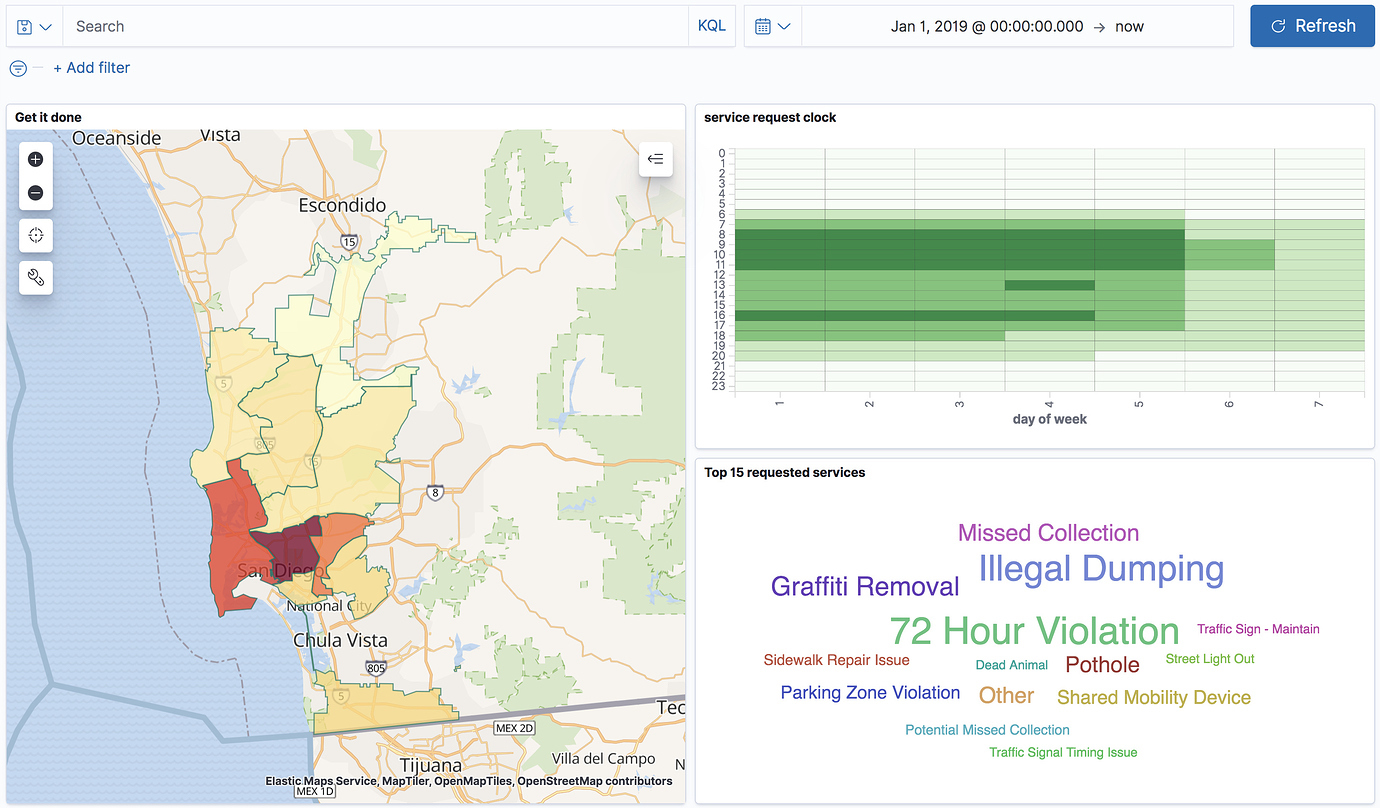
Embed your map in dashboards
editViewing data from different angles provides better insights. Dimensions that are obscured in one visualization might be illuminated in another. Add your map to a dashboard and view your geospatial data alongside bar charts, pie charts, tag clouds, and more.
This choropleth map shows the density of non-emergency service requests in San Diego by council district. The map is embedded in a dashboard, so users can better understand when services are requested and gain insight into the top requested services.
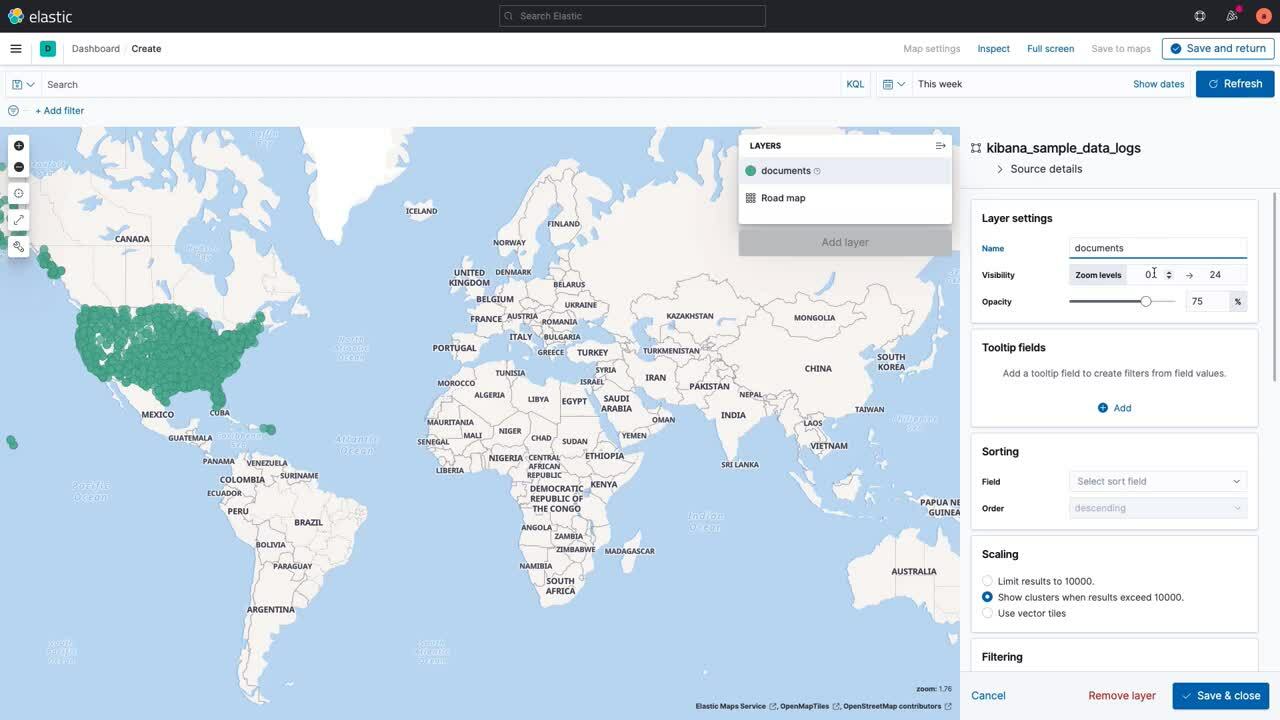
Symbolize features using data values
editCustomize each layer to highlight meaningful dimensions in your data. For example, use dark colors to symbolize areas with more web log traffic, and lighter colors to symbolize areas with less traffic.
Focus on only the data that’s important to you
editSearch across the layers in your map to focus on just the data you want. Combine free text search with field-based search using the Kibana Query Language. Set the time filter to restrict layers by time. Draw a polygon on the map or use the shape from features to create spatial filters. Filter individual layers to compares facets.