Track, visualize, and alert on assets in real time
editTrack, visualize, and alert on assets in real time
editAre you interested in asset tracking? Good news! Visualizing and analyzing data that moves is easy with Maps. You can track the location of an IoT device and monitor a package or vehicle in transit.
In this tutorial, you’ll look at live urban transit data from the city of Portland, Oregon. You’ll watch the city buses, use the data to visualize congestion, and notify a dispatch team when a bus enters a construction zone.
You’ll learn to:
- Use Logstash to ingest the TriMet REST API into Elasticsearch.
- Create a map with layers that visualize asset tracks and last-known locations.
- Use symbols and colors to style data values and show which direction an asset is heading.
- Set up tracking containment alerts to monitor moving vehicles.
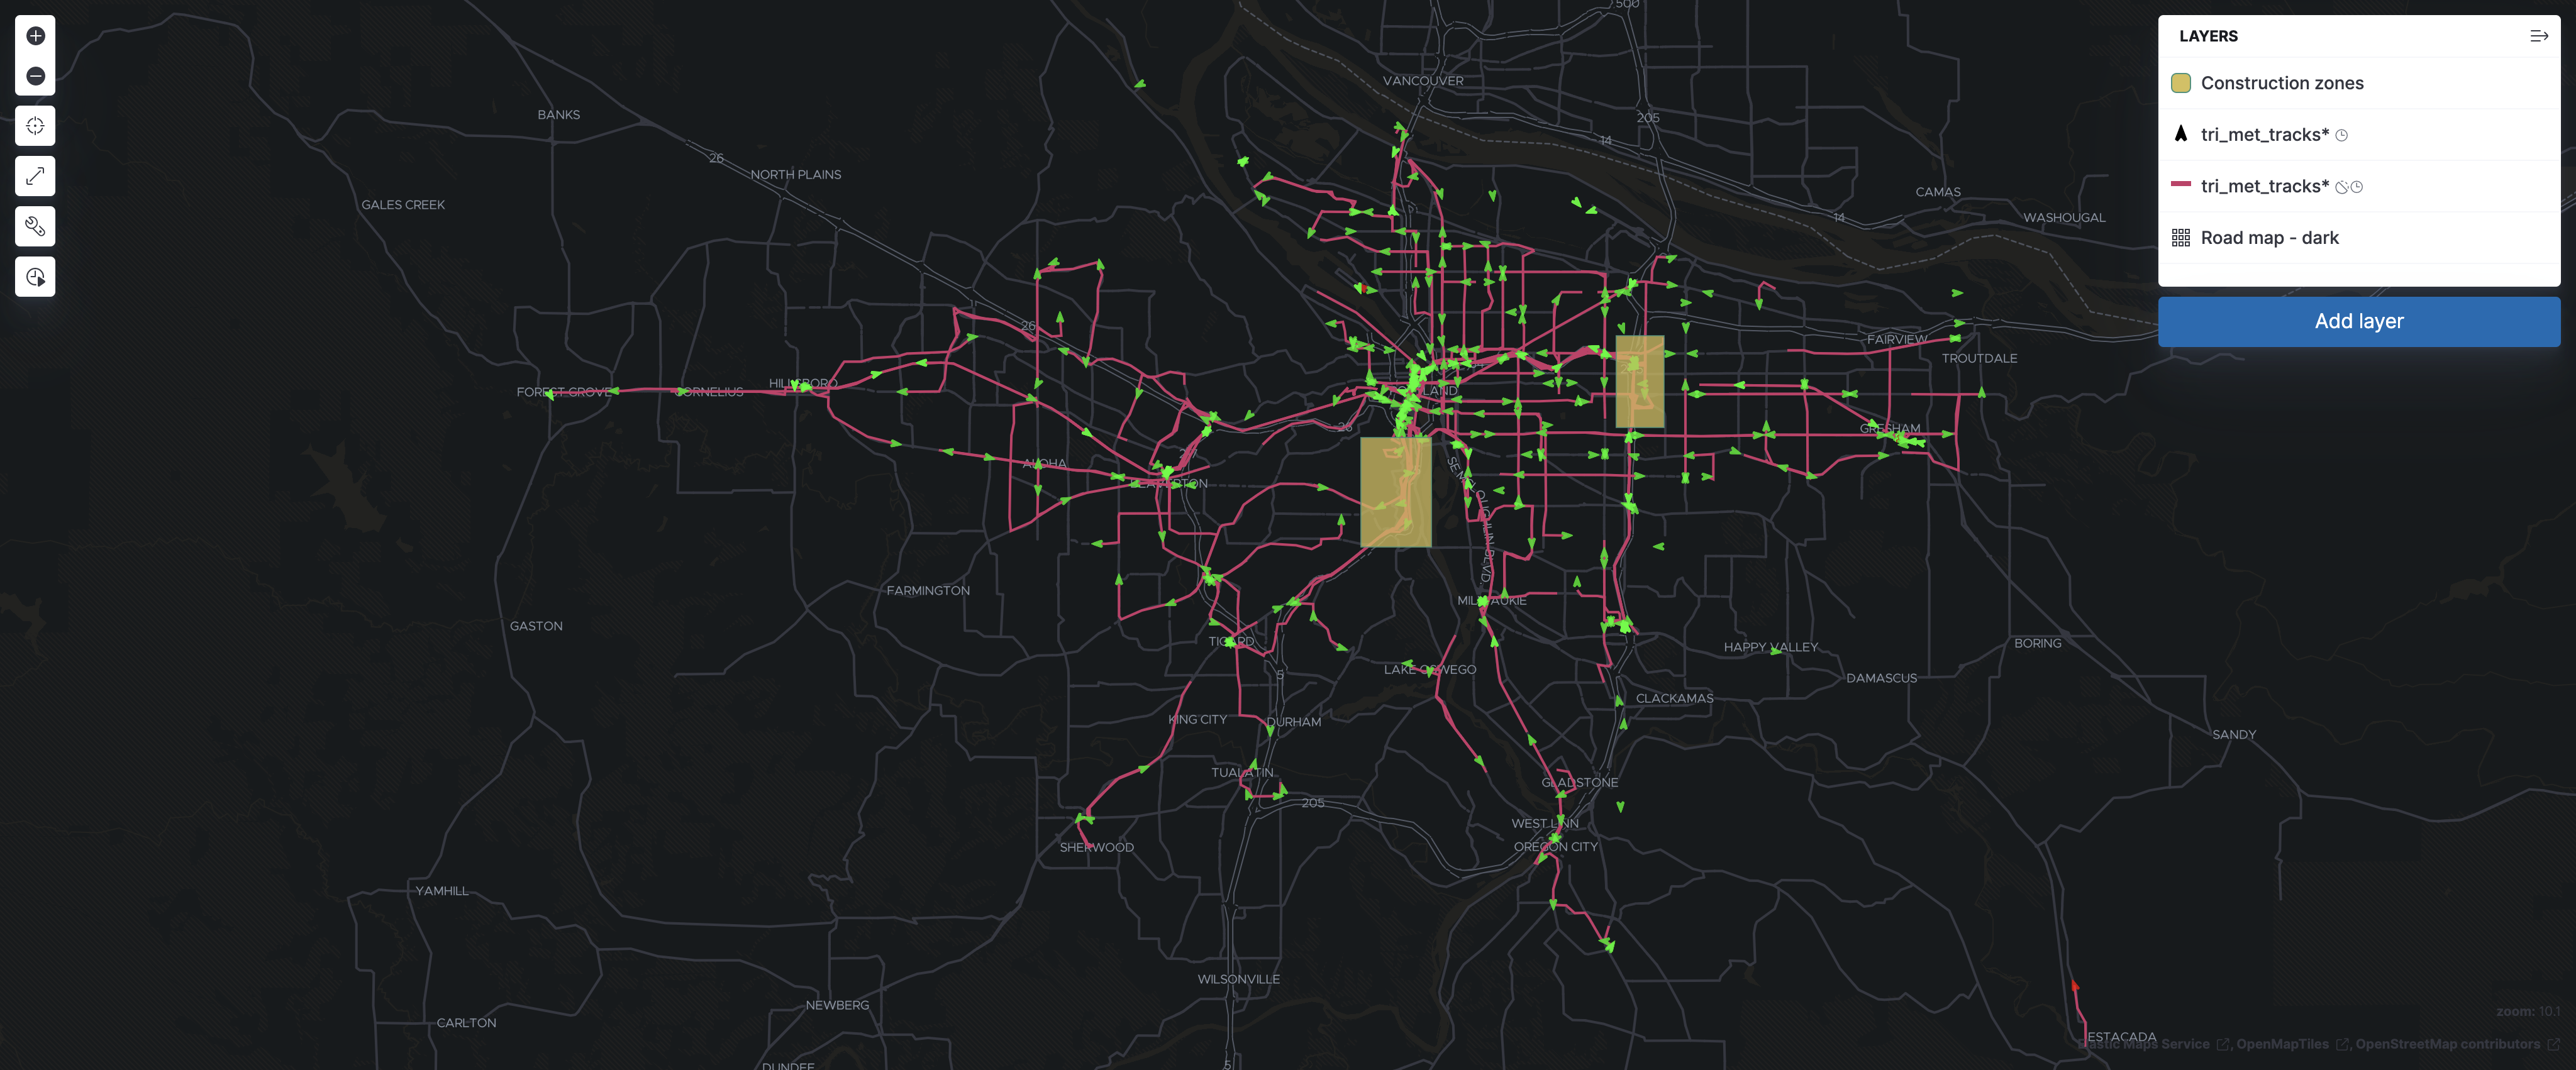
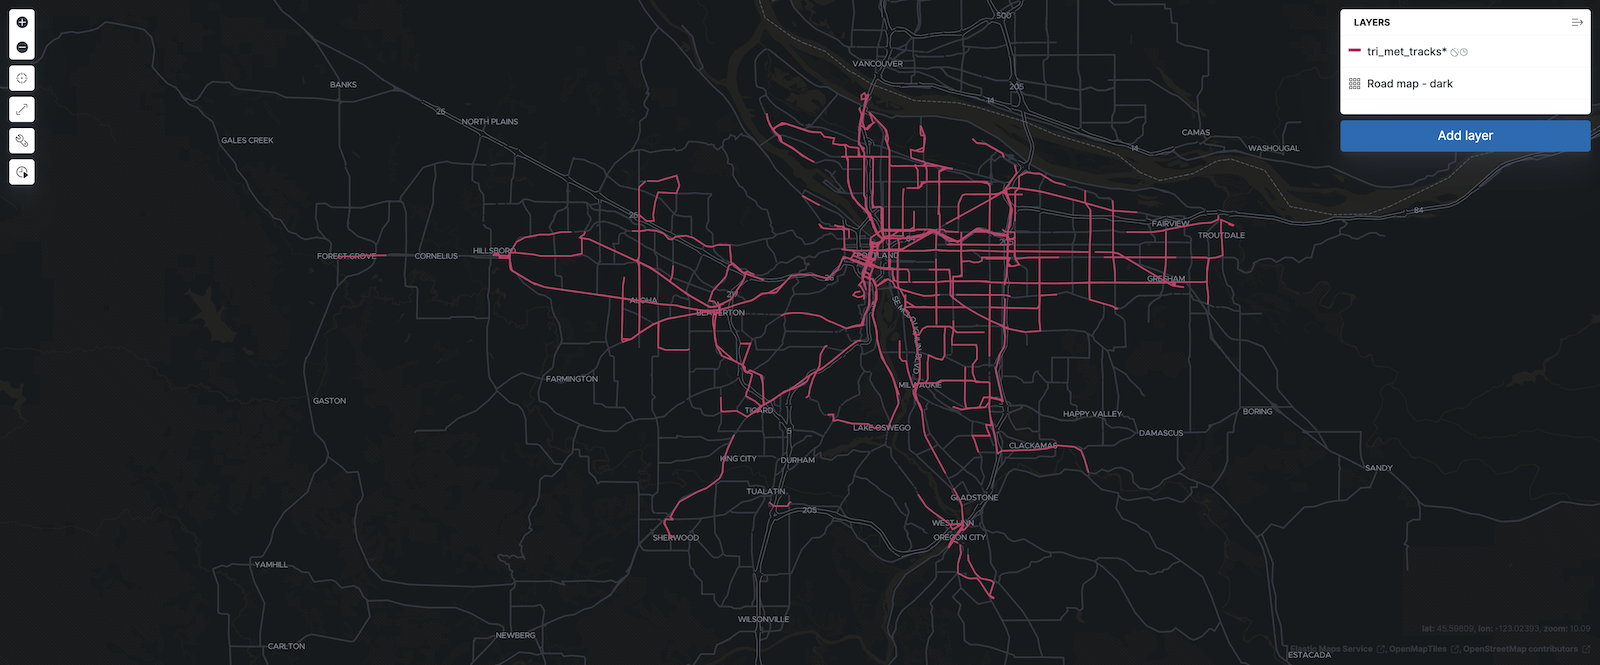
When you complete this tutorial, you’ll have a map that looks like this:
Prerequisites
edit- If you don’t already have Kibana, set it up with our free trial. Download the deployment credentials.
- Obtain an API key for TriMet web services at https://developer.trimet.org/appid/registration/.
- Install Logstash.
Part 1: Ingest the Portland bus data
editTo get to the fun of visualizing and alerting on Portland buses, you must first create a Logstash pipeline to ingest the TriMet Portland bus data into Elasticsearch.
Step 1: Set up an Elasticsearch index
edit- In Kibana, open the main menu, then click Dev Tools.
-
In Console, create the
tri_met_tracksindex:PUT tri_met_tracks
-
To configure the
tri_met_tracksindex mappings, run:PUT tri_met_tracks/_mapping { "properties": { "in_congestion": { "type": "boolean" }, "location": { "type": "geo_point" }, "route": { "type": "keyword" }, "time": { "type": "date", "format": "epoch_millis" }, "type": { "type": "keyword" }, "vehicle_id": { "type": "keyword" } } }
Step 2: Start Logstash
edit-
In your
logstash/configfolder, create the filetrimet-pipeline.conf. -
Copy the pipeline script into your
trimet-pipeline.conffile.input { http_poller { urls => { trimet => "https://developer.trimet.org/ws/v2/vehicles?appID=<tri_met_app_id>" } request_timeout => 60 schedule => { cron => "* * * * * UTC"} codec => "json" } } filter { split { field => "[resultSet][vehicle]" } if ![resultSet][vehicle][inCongestion] { mutate { update => { "[resultSet][vehicle][inCongestion]" => "false" } } } mutate { add_field => { "bearing" => "%{[resultSet][vehicle][bearing]}" "in_congestion" => "%{[resultSet][vehicle][inCongestion]}" "location" => "%{[resultSet][vehicle][latitude]},%{[resultSet][vehicle][longitude]}" "route" => "%{[resultSet][vehicle][routeNumber]}" "time" => "%{[resultSet][vehicle][time]}" "type" => "%{[resultSet][vehicle][type]}" "vehicle_id" => "%{[resultSet][vehicle][vehicleID]}" } remove_field => [ "resultSet", "@version", "@timestamp" ] } mutate { convert => { "bearing" => "float" "in_congestion" => "boolean" "time" => "integer" } } } output { stdout { codec => rubydebug } elasticsearch { cloud_auth => "<username:password>" cloud_id => "<cloud_id>" index => "tri_met_tracks" document_id => "%{[vehicle_id]}_%{[time]}" } } -
Replace
<tri_met_app_id>with your TriMet application id. -
Replace
<username:password>with your Elastic Cloud deployment credentials. -
Replace
<cloud_id>with your Elastic Cloud Enterprise/ece-cloud-id.html[elastic cloud id]. - Open a terminal window, and then navigate to the Logstash folder.
-
In your
logstashfolder, run Logstash with the TriMet pipeline:bin/logstash -f config/trimet-pipeline.conf
-
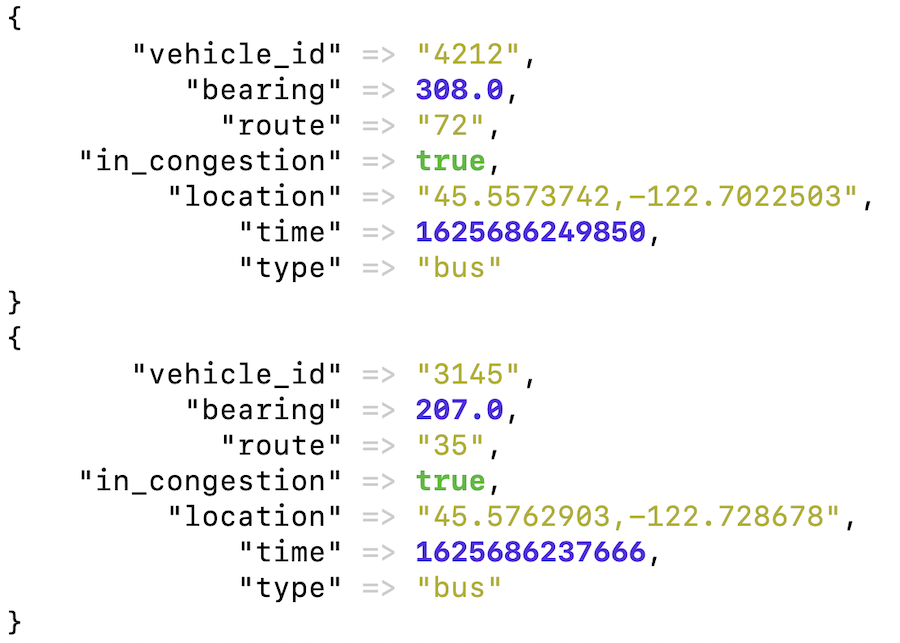
Wait for Logstash to initialize and confirm data is flowing. You should see messages similar to this:
- Leave the terminal window open and Logstash running throughout this tutorial.
Step 3: Create a Kibana index pattern for the tri_met_tracks Elasticsearch index
edit- In Kibana, open the main menu, and click Stack Management > Index Patterns.
- Click Create index pattern.
- Give the index pattern a name: tri_met_tracks*.
- Click Next step.
- Set the Time field to time.
- Click Create index pattern.
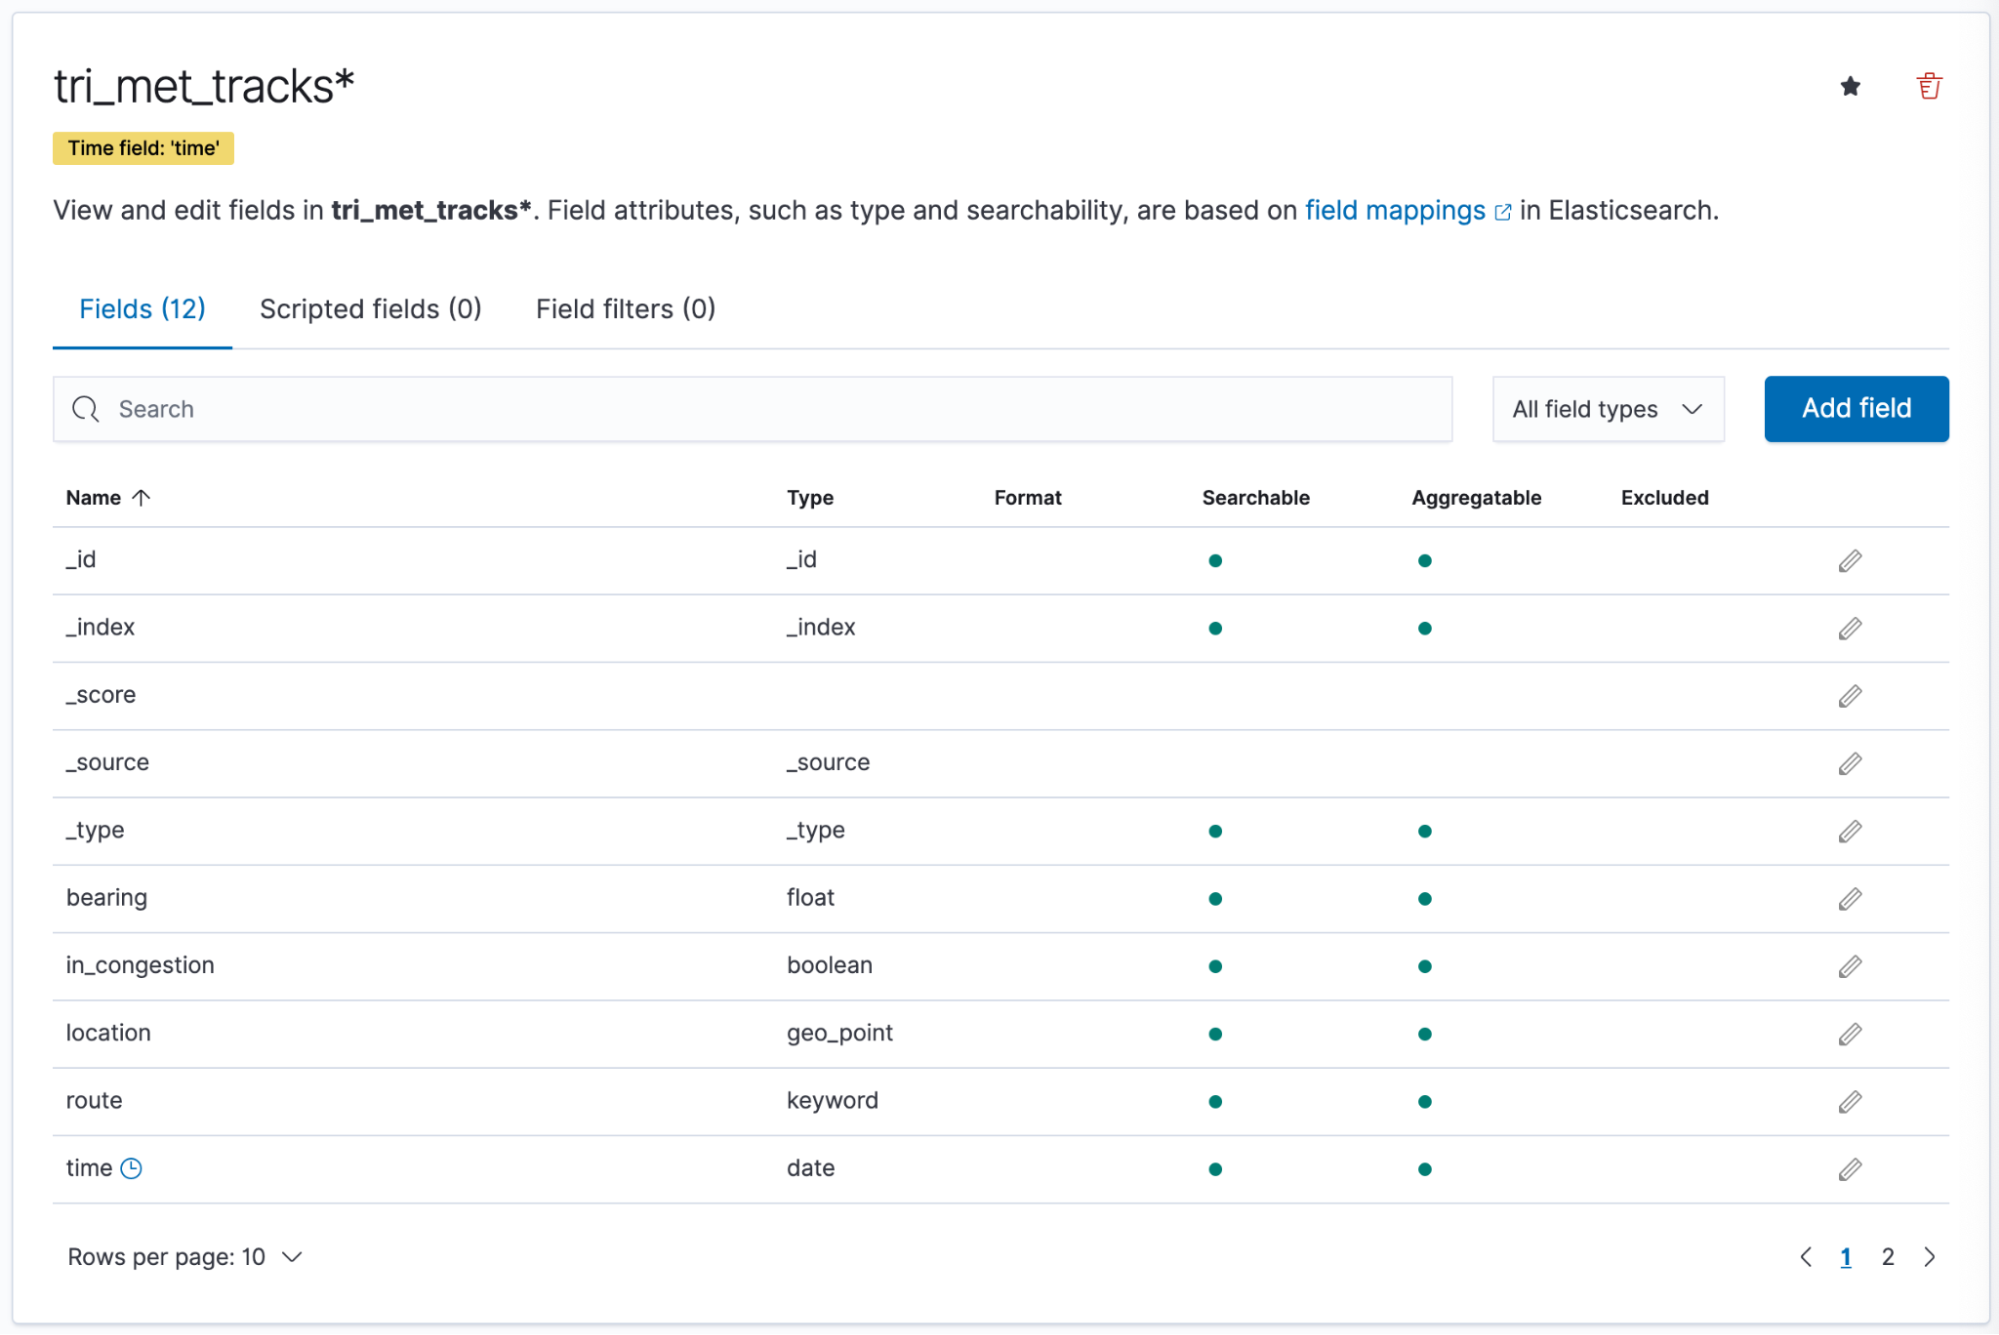
Kibana shows the fields in your index pattern.
Step 4: Explore the Portland bus data
edit- Open the main menu, and click Discover.
- Set the index pattern to tri_met_tracks*.
- Open the time filter, and set the time range to the last 15 minutes.
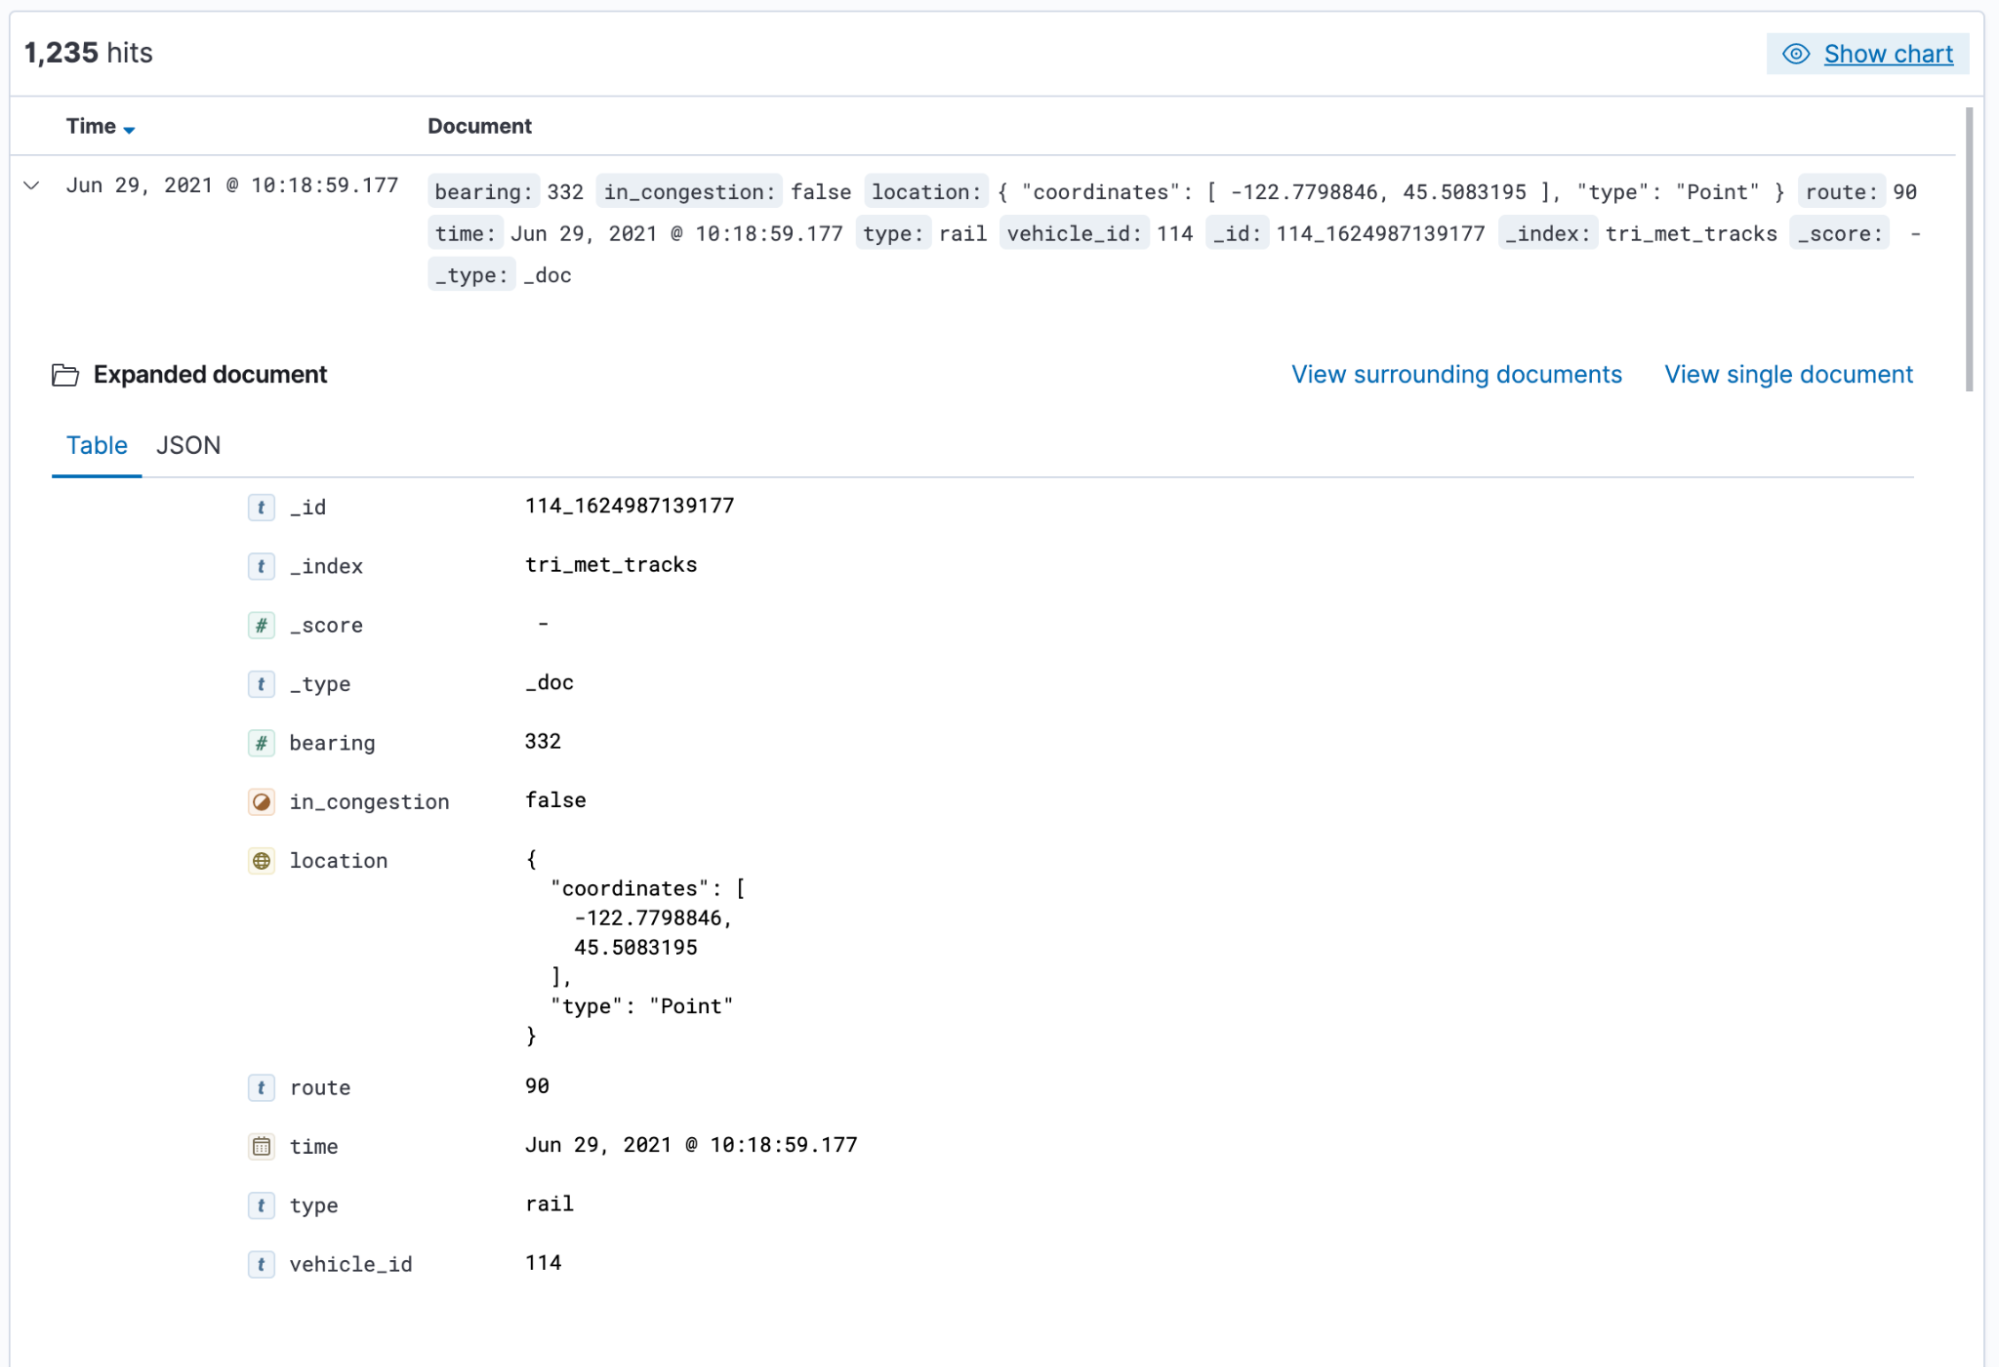
-
Expand a document and explore some of the fields that you will use later in this tutorial:
bearing,in_congestion,location, andvehicle_id.
Part 2: Build an operational map
editIt’s hard to get an overview of Portland buses by looking at individual events. Let’s create a map to show the bus routes and current location for each bus, along with the direction the buses are headed.
Step 1: Create your map
editCreate your map and set the theme for the default layer to dark mode.
- Open the main menu, and click Maps.
- Click Create map.
- In the Layers list, click Road map, and then click Edit layer settings.
- Open the Tile service dropdown, and select Road map - dark.
- Click Save & close.
Step 2. Add a tracks layer
editAdd a layer to show the bus routes for the last 15 minutes.
- Click Add layer.
- Click Tracks.
- Select the tri_met_tracks* index pattern.
-
Define the tracks:
- Set Entity to vehicle_id.
- Set Sort to time.
- Click Add layer.
-
In Layer settings:
- Set Name to Buses.
- Set Opacity to 80%.
- Scroll to Layer Style, and set Border color to pink.
- Click Save & close.
- In the Layers list, click Buses, and then click Fit to data.
At this point, you have a map with lines that represent the routes of the buses as they move around the city.
Step 3. Indicate the direction of the bus tracks
editAdd a layer that uses attributes in the data to set the style and orientation of the buses. You’ll see the direction buses are headed and what traffic is like.
- Click Add layer, and then select Top Hits per entity.
- Select the tri_met_tracks* index pattern.
-
To display the most recent location per bus:
- Set Entity to vehicle_id.
- Set Documents per entity to 1.
- Set Sort field to time.
- Set Sort order to descending.
- Click Add layer.
-
Scroll to Layer Style.
- Set Symbol type to icon.
- Set Icon to arrow-es.
-
Set the Fill color:
- Select By value styling, and set the field to in_congestion.
- Use a Custom color palette.
- Set the Other color to black.
- Add a green class for false, meaning the bus is not in traffic.
- Add a red class for true, meaning the bus is in congestion.
- Set Border width to 0.
-
Change Symbol orientation to use By value and the bearing field.
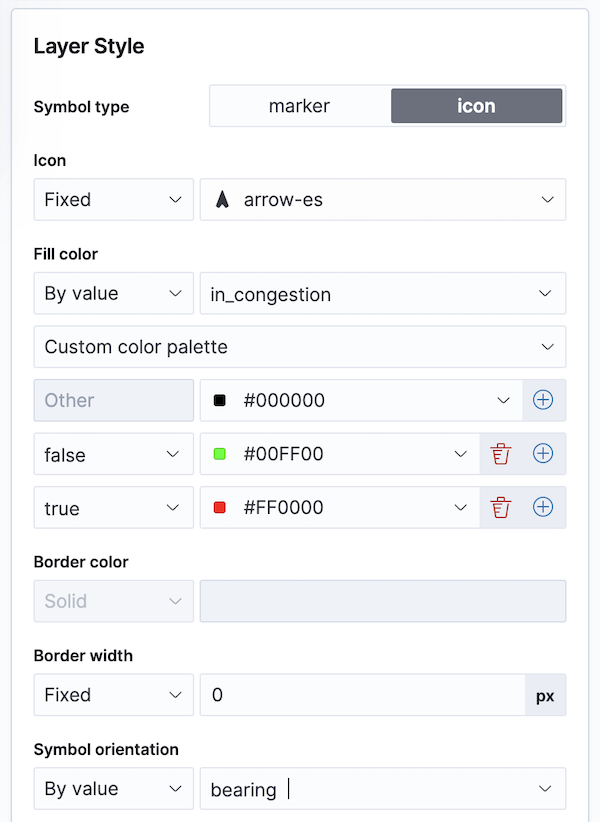
- Click Save & close.
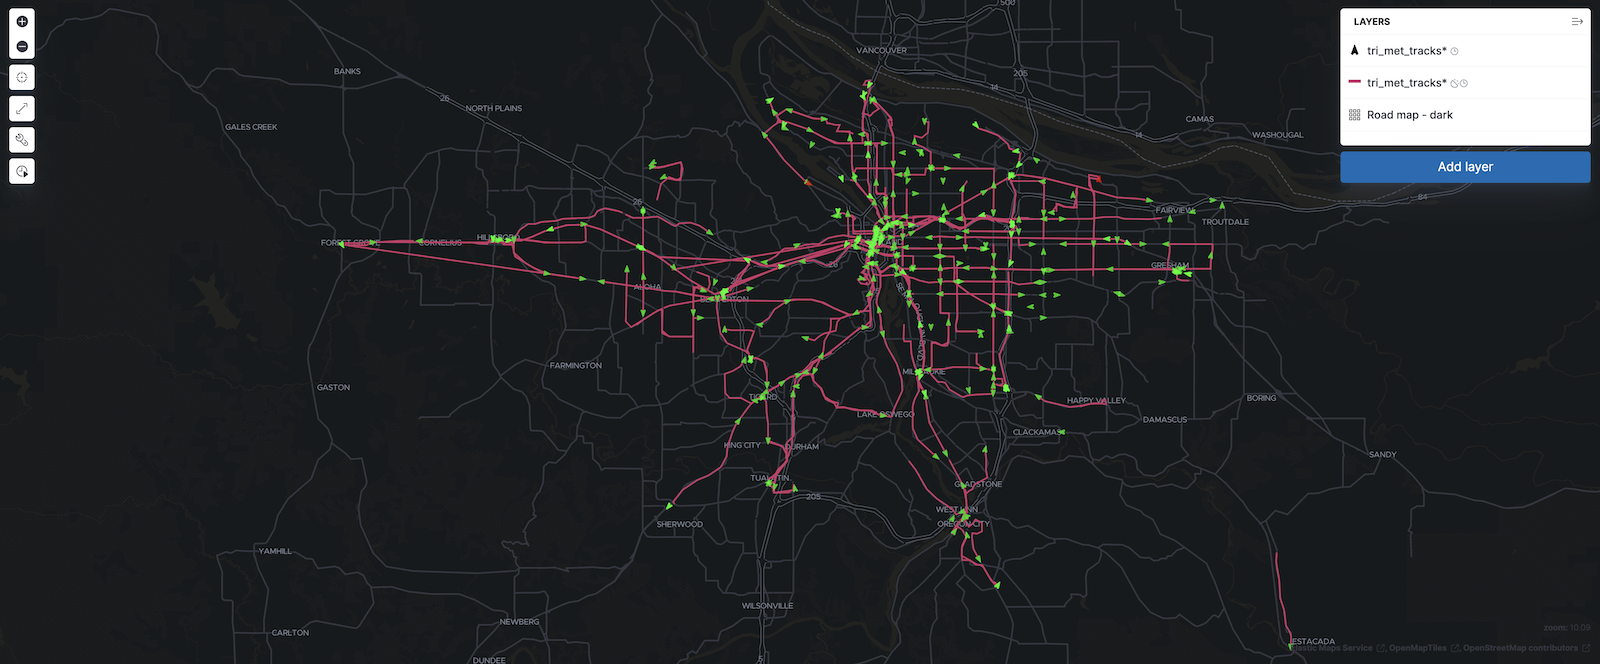
- Open the time filter, and set Refresh every to 10 seconds, and click Start.
Your map should automatically refresh every 10 seconds to show the lastest bus positions and tracks.
Part 3: Setup geo-fencing alerts
editLet’s make TriMet Portland bus data actionable and alert when buses enter construction zones.
Step 1. Add a construction zone
editAdd a layer for construction zones, which you will draw on the map. The construction zones will be used as your geofence boundary or threshold that serves as the basis for triggering alerts.
- Click Add layer.
- Click Create index.
- Set Index name to construction_zones.
- Click Create index.
-
Draw 2 or 3 construction zones on your map:
-
In the toolbar on left side of the map, select the bounding box icon
 .
.
- To draw a construction zone, click a start point on the map and drag.
- Click an endpoint to finish.
-
In the toolbar on left side of the map, select the bounding box icon
- When you finish drawing the construction zones, click Exit under the layer name in the legend.
- In Layer settings, set Name to Construction zones.
- Scroll to Layer Style, and set Fill color to yellow.
- Click Save & close.
-
Save the map.
- Give the map a title.
- Under Add to dashboard, select None.
- Click Save and add to library.
The map now represents an operational view of live bus traffic. You’ll see the direction that the buses are traveling, and whether they are near or have entered a construction zone.
Your map is now complete.
Step 2. Configure an alert
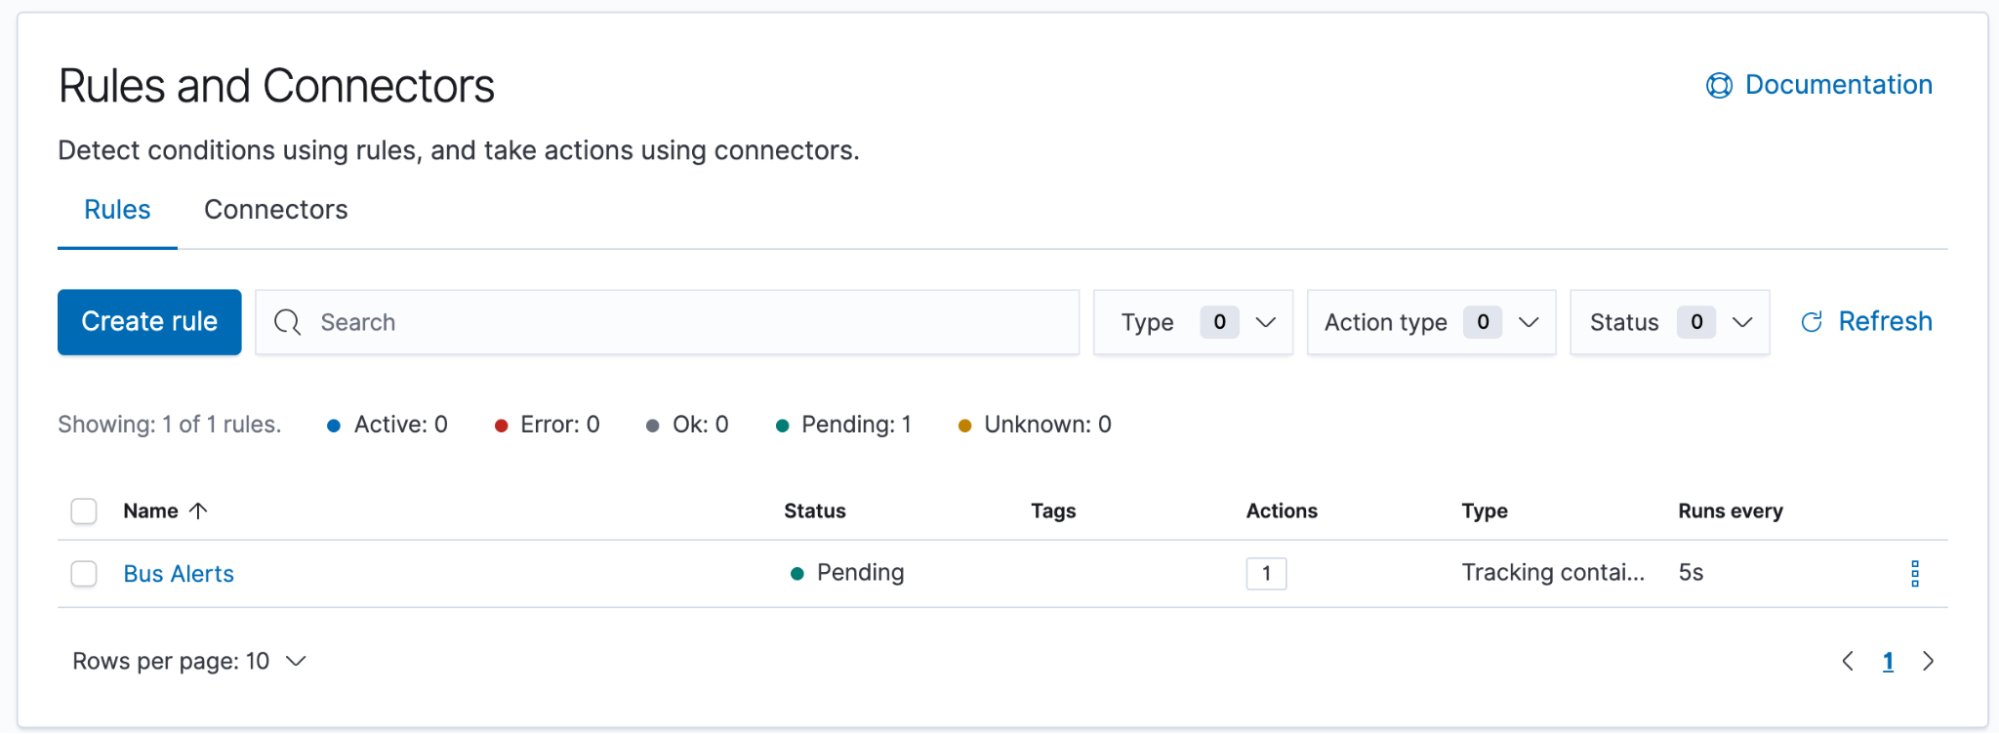
editCreate a new alert by defining a rule and a connector. The rule includes the conditions that will trigger the alert, and the connector defines what action takes place once the alert is triggered. In this case, each alert will log a message to the Kibana log.
- Open Stack Management, and then click Rules and Connectors.
- Click Create rule.
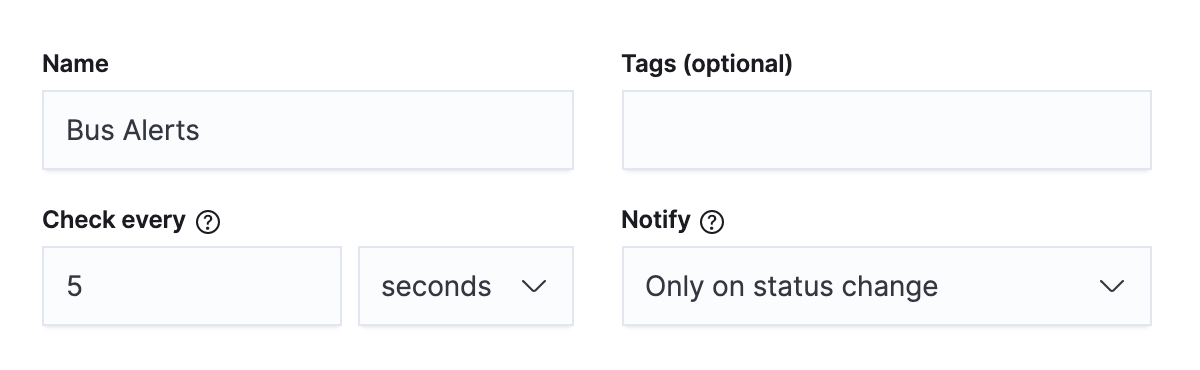
- Name the rule Bus Alerts.
- Set Check every to 5 seconds.
-
Notify Only on status change.
- Select the Tracking containment rule type.
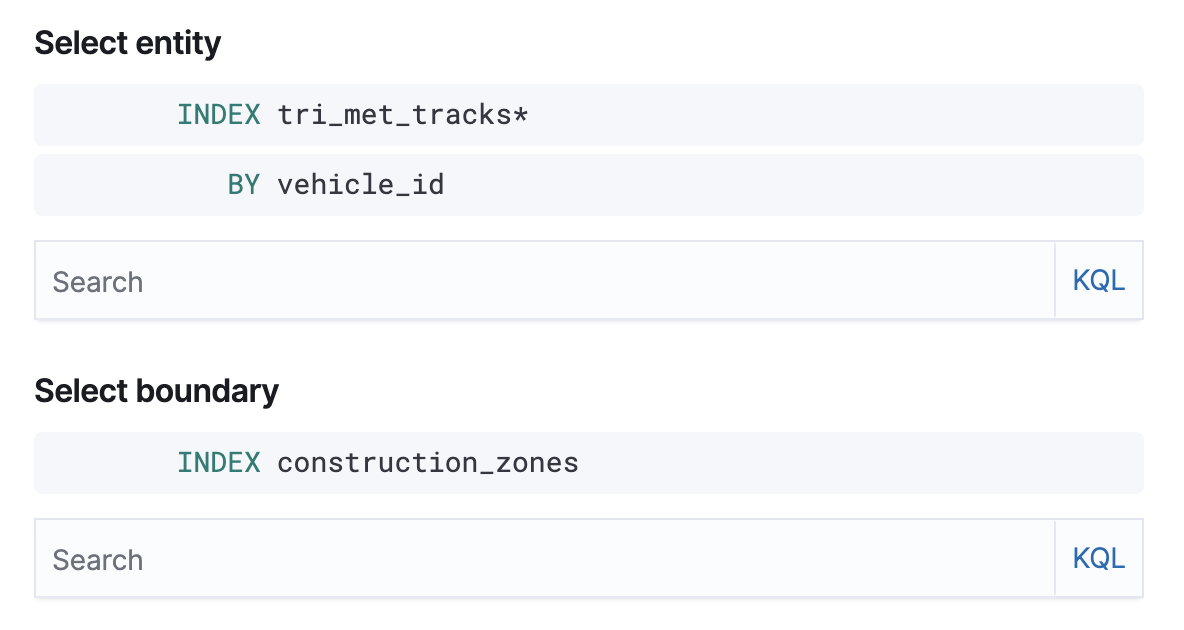
-
Set Select entity:
- Set INDEX to tri_met_tracks*.
- Set BY to vehicle_id.
-
Set Select boundary INDEX to construction_zones.
- Under Actions, select the Server log connector type.
- Click Create a connector.
-
In the Server log connector:
- Set Connector name to Bus alert connector.
- Click Save.
-
Complete the Actions configuration.
-
Set Message to :
{
  "entityId": "{{context.entityId}}",
  "entityDateTime": "{{context.entityDateTime}}",
  "entityDocumentId": "{{context.entityDocumentId}}",
  "detectionDateTime": "{{context.detectionDateTime}}",
  "entityLocation": "{{context.entityLocation}}",
  "containingBoundaryId": "{{context.containingBoundaryId}}",
  "containingBoundaryName": "{{context.containingBoundaryName}}"
}
-
- Click Save.
The Bus Alert connector is added to the Rules and Connectors page. For more information on common connectors, refer to the Slack and Email connectors.
Congratulations! You have completed the tutorial and have the recipe for tracking assets. You can now try replicating this same analysis with your own data.