Tutorial: Create a workpad for monitoring sales
editTutorial: Create a workpad for monitoring sales
editTo get up and running with Canvas, use the following tutorial where you’ll create a workpad for monitoring sales at an eCommerce store.
Before you begin
editFor this tutorial, you’ll need to add the Sample eCommerce orders data.
Create your workpad
editYour first step to working with Canvas is to create a workpad.
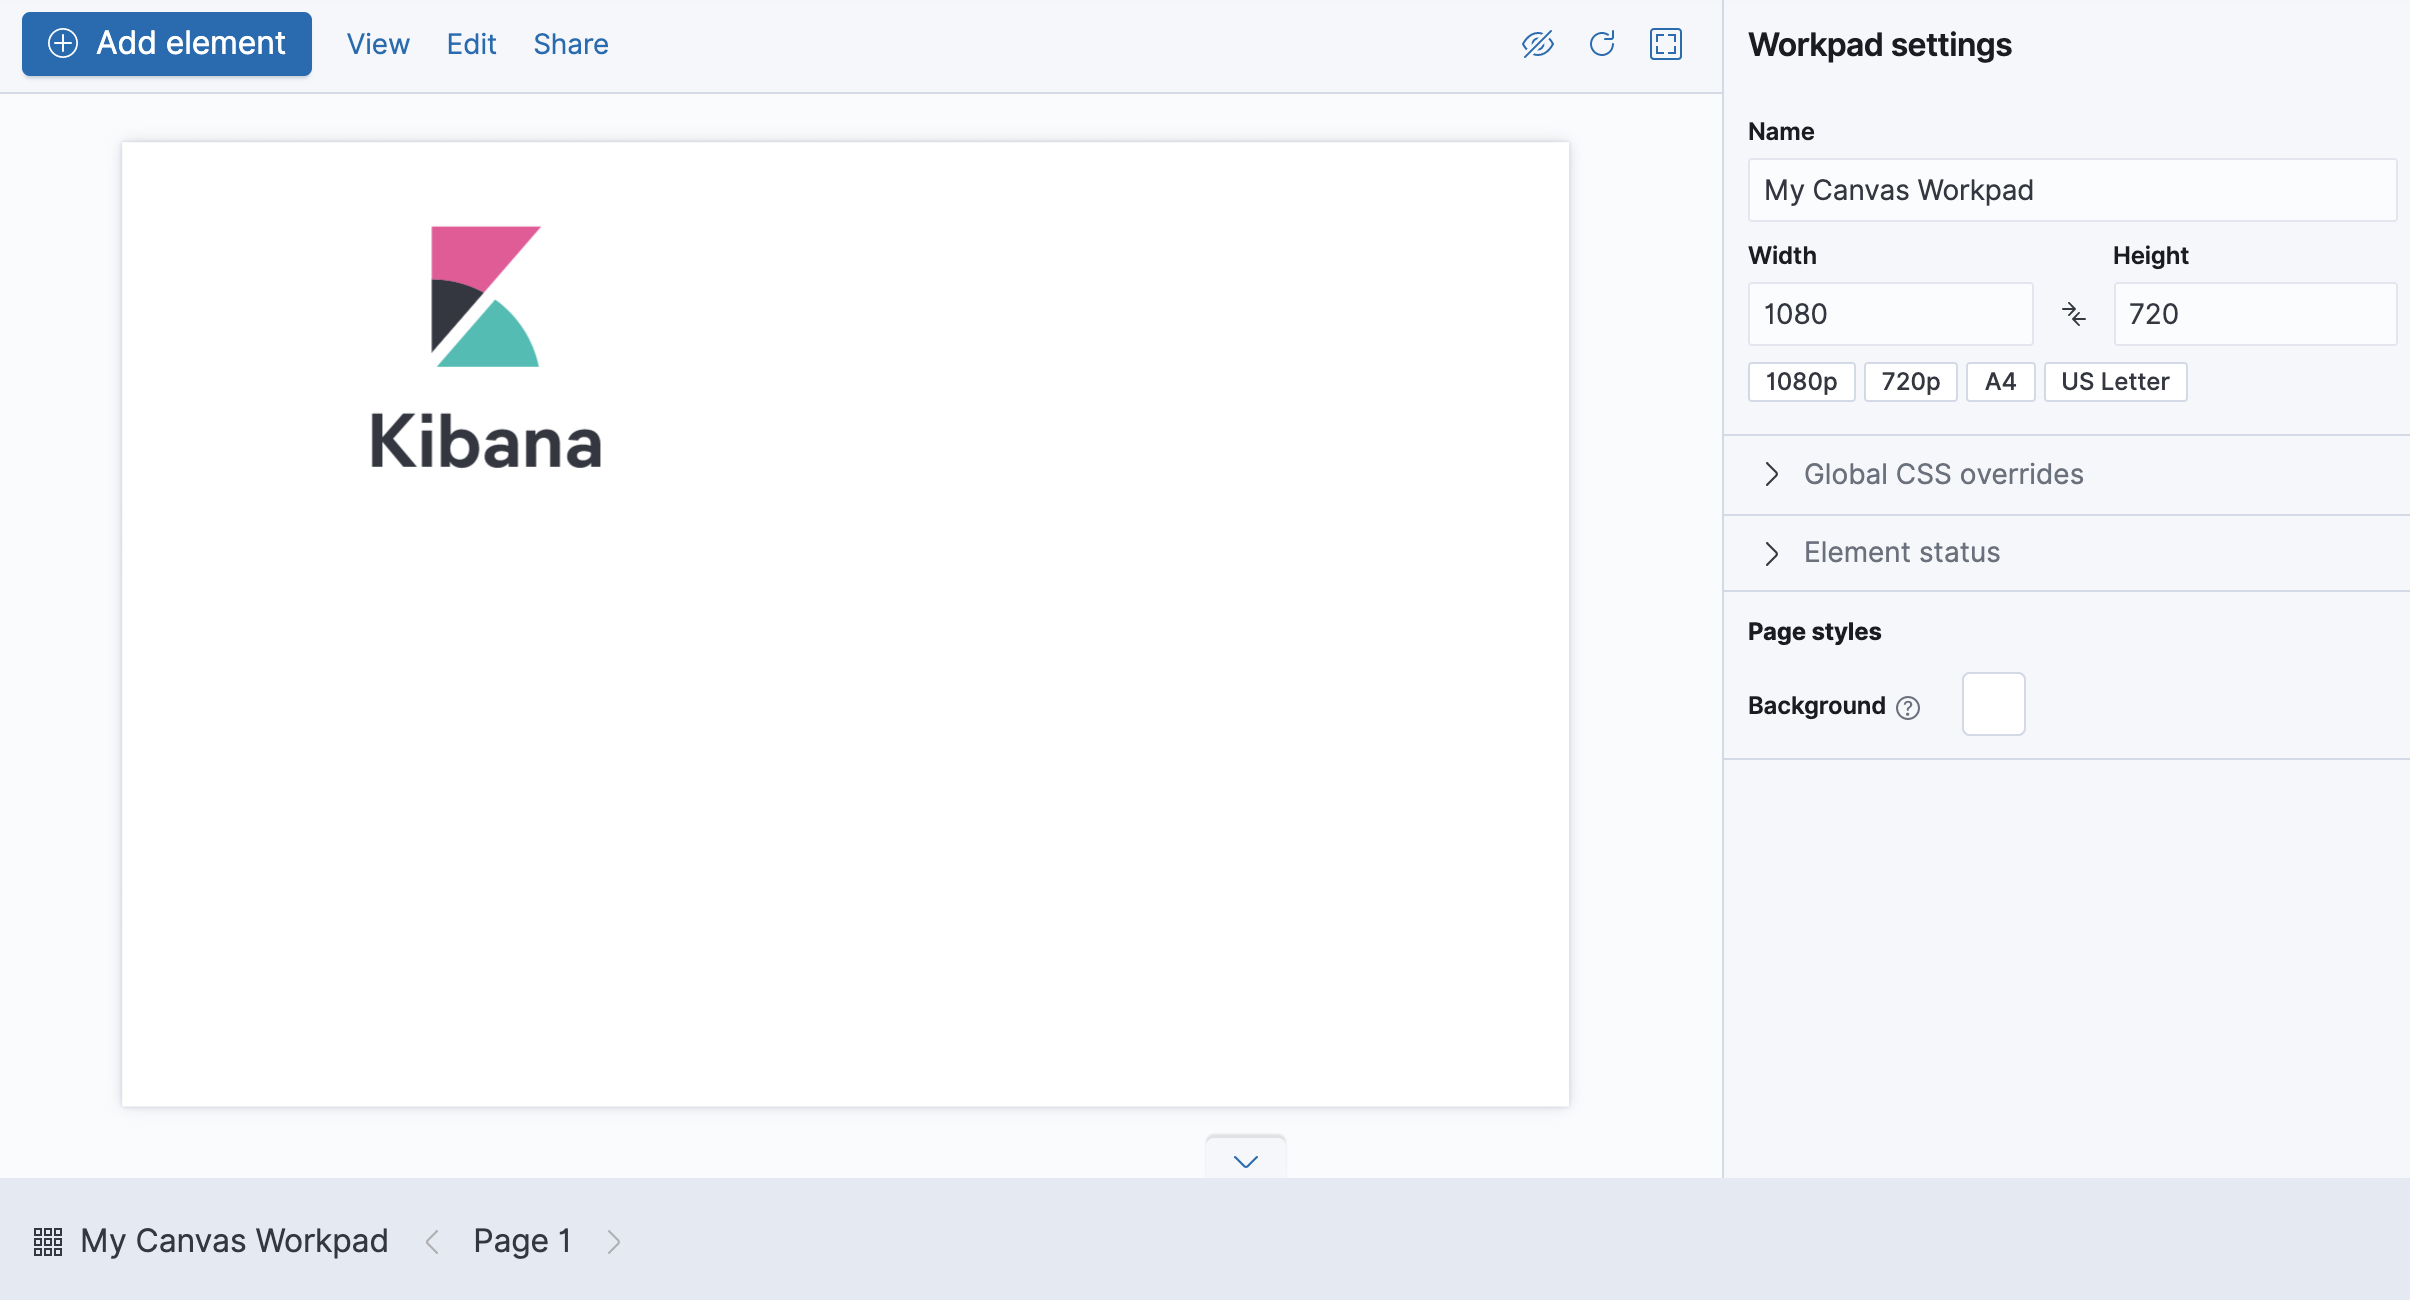
- Open the menu, then go to Canvas.
- On the Canvas workpads page, click Create workpad.
Customize your workpad with images
editTo customize your workpad to look the way you want, add your own images.
-
Click Add element > Image > Image.
The default Elastic logo image appears on the page.
- To replace the Elastic logo with your own image, select the image, then use the editor.
Customize your data with metrics
editCustomize your data by connecting it to the Sample eCommerce orders data.
-
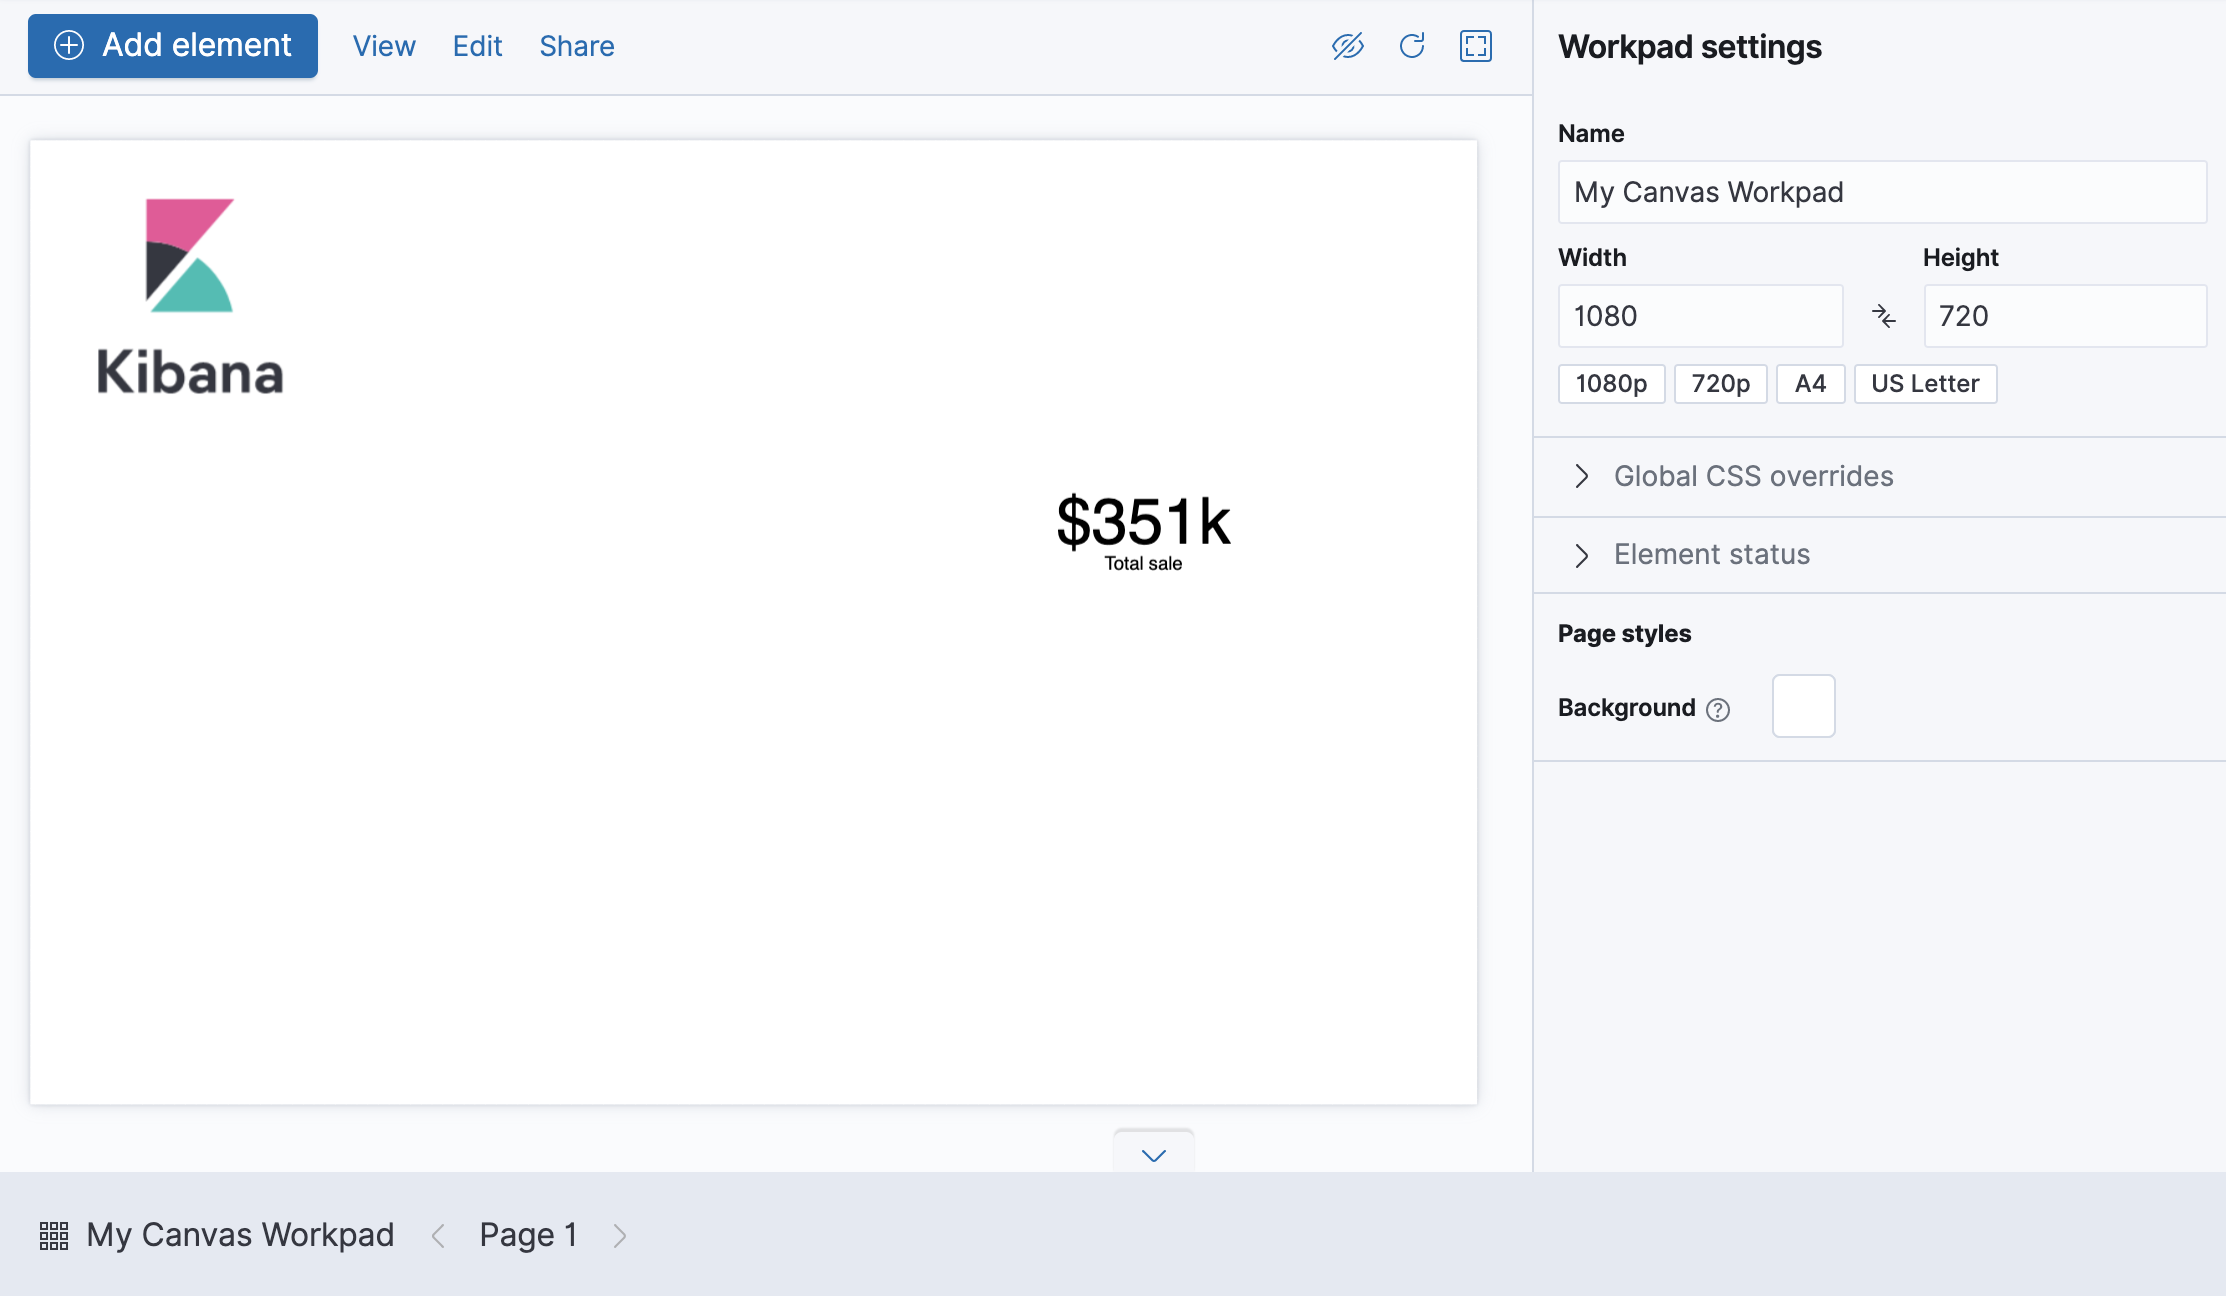
Click Add element > Chart > Metric.
By default, the element is connected to the demo data, which enables you to experiment with the element before you connect it to your own data source.
-
To connect the element to your own data source, make sure that the element is selected, click Data > Demo data > Elasticsearch SQL.
-
In the Query field, enter the following:
SELECT sum(taxless_total_price) AS sum_total_price FROM "kibana_sample_data_ecommerce" -
Click Save.
The query selects the total price field and sets it to the sum_total_price field. All fields are pulled from the kibana_sample_data_ecommerce index.
-
-
At this point, the element appears as an error, so you need to change the element display options.
- Click Display
- From the Value drop-down lists, make sure that Unique is selected, then select sum_total_price.
-
Change the Label to
Total sales.
-
The error is gone, but the element could use some formatting. To format the number, use the Canvas expression language.
-
Click Expression editor.
You’re now looking at the raw data syntax that Canvas uses to display the element.
-
Change
metricFormat="0,0.[000]"tometricFormat="$0a". - Click Run.
-
Show off your data with charts
editTo show what your data can do, add charts, graphs, progress monitors, and more to your workpad.
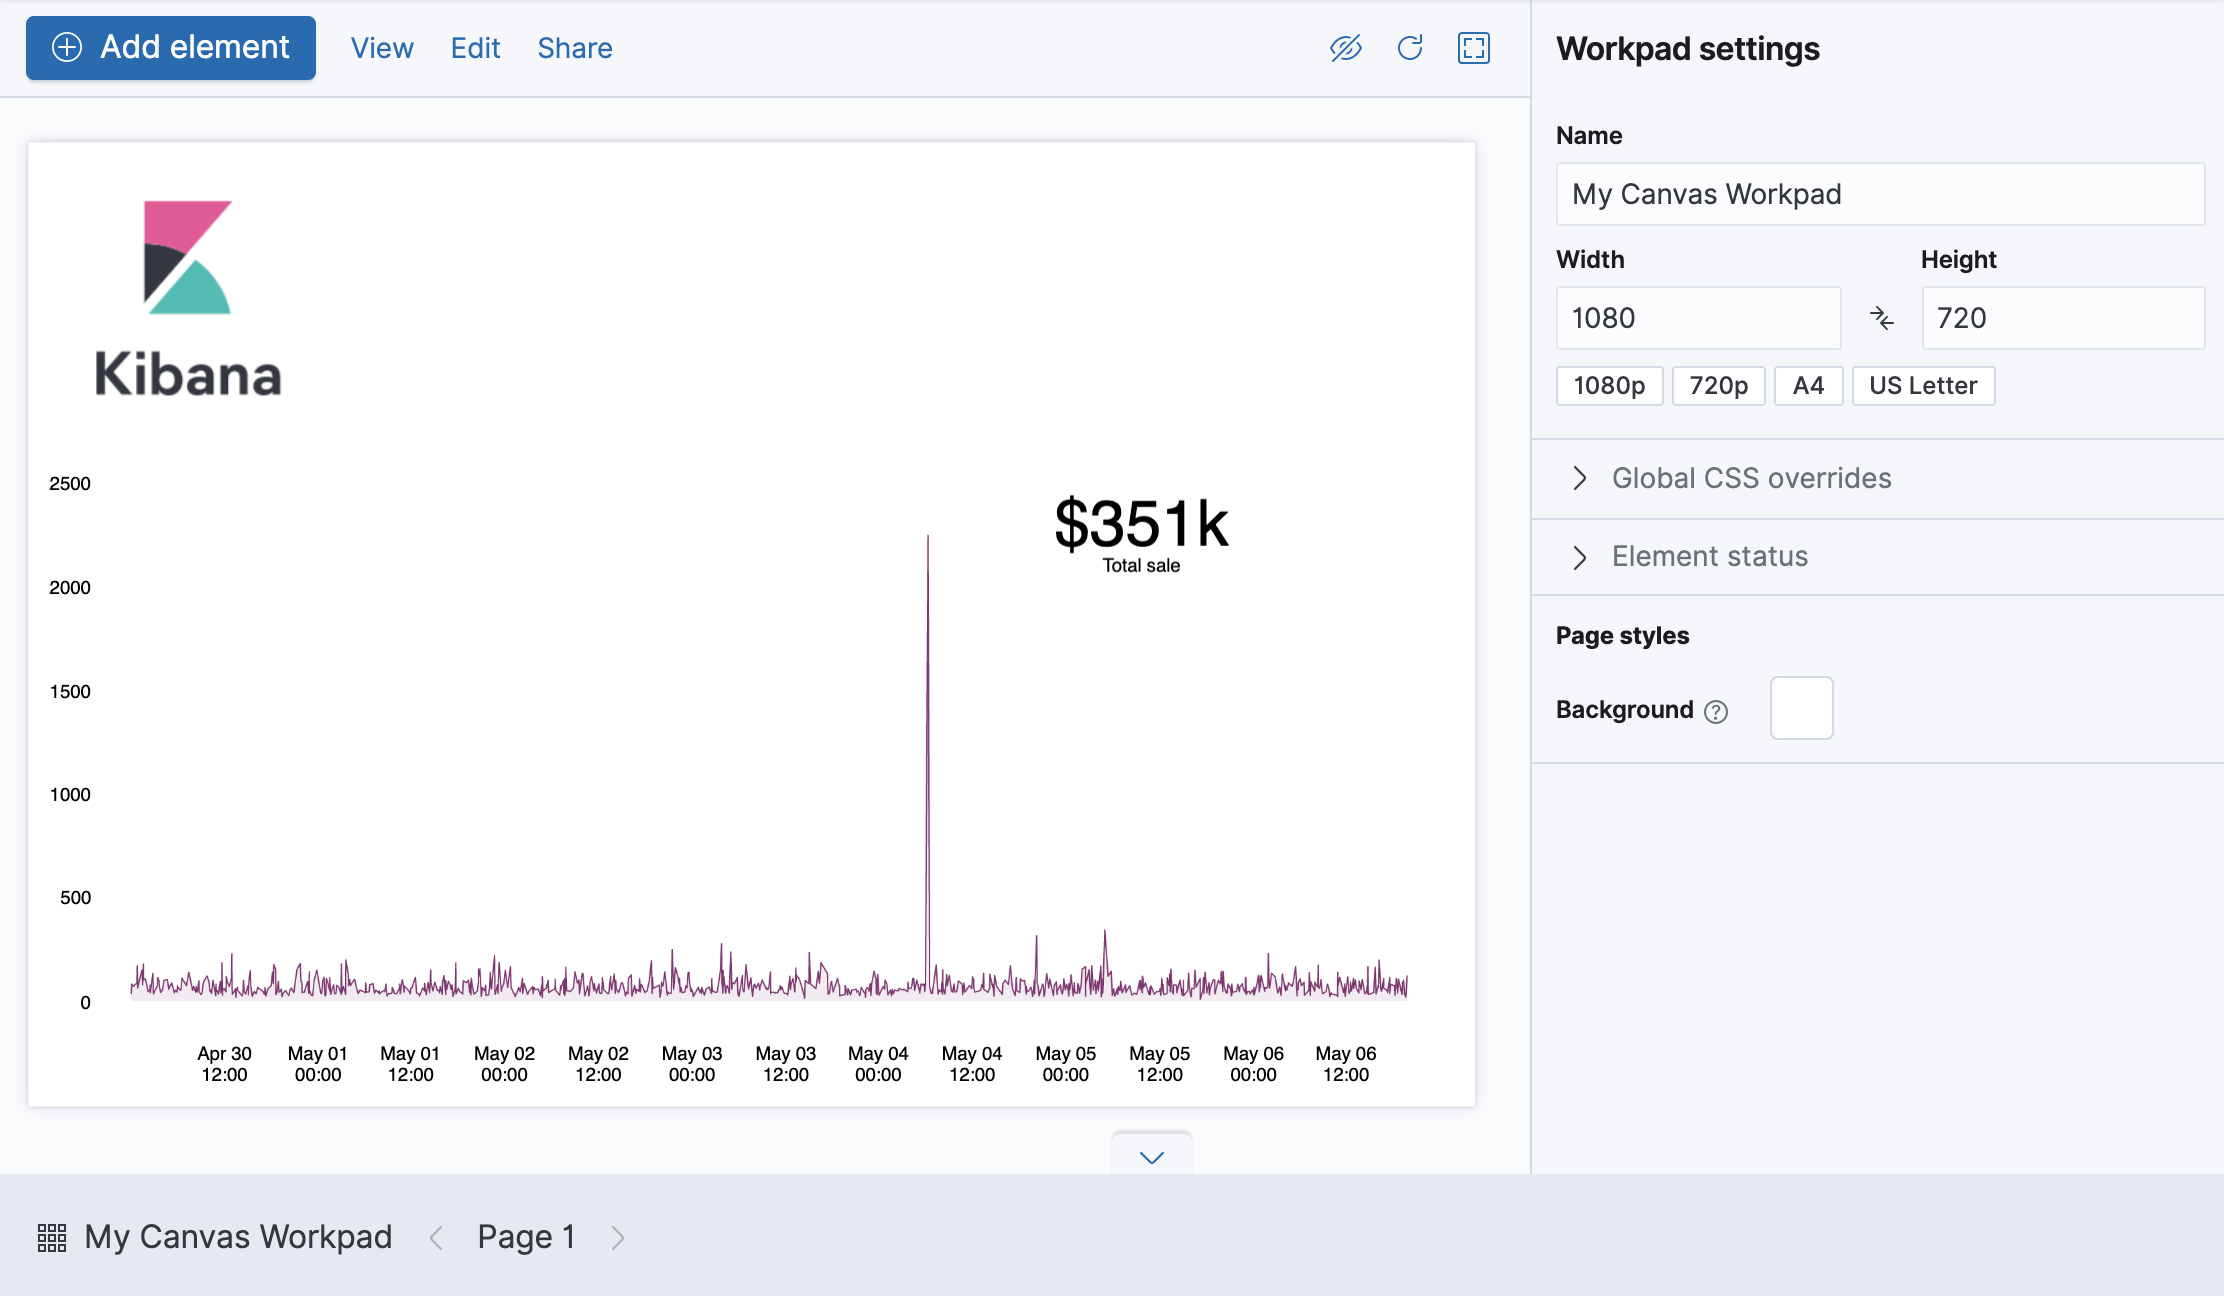
- Click Add element > Chart > Area.
-
Make sure that the element is selected, then click Data > Demo data > Elasticsearch SQL.
-
To obtain the taxless total price by date, enter the following in the Query field:
SELECT order_date, taxless_total_price FROM "kibana_sample_data_ecommerce" ORDER BY order_date - Click Save.
-
-
Change the display options.
- Click Display
- From the X-axis drop-down lists, select Value, then select order_date.
- From the Y-axis drop-down lists, select Value, then select taxless_total_price.
Show how your data changes over time
editTo focus your data on a specific time range, add the time filter.
- Click Add element > Filter > Time filter.
- Click Display
-
To use the date time field from the sample data, enter
order_datein the Column field, then click Set.
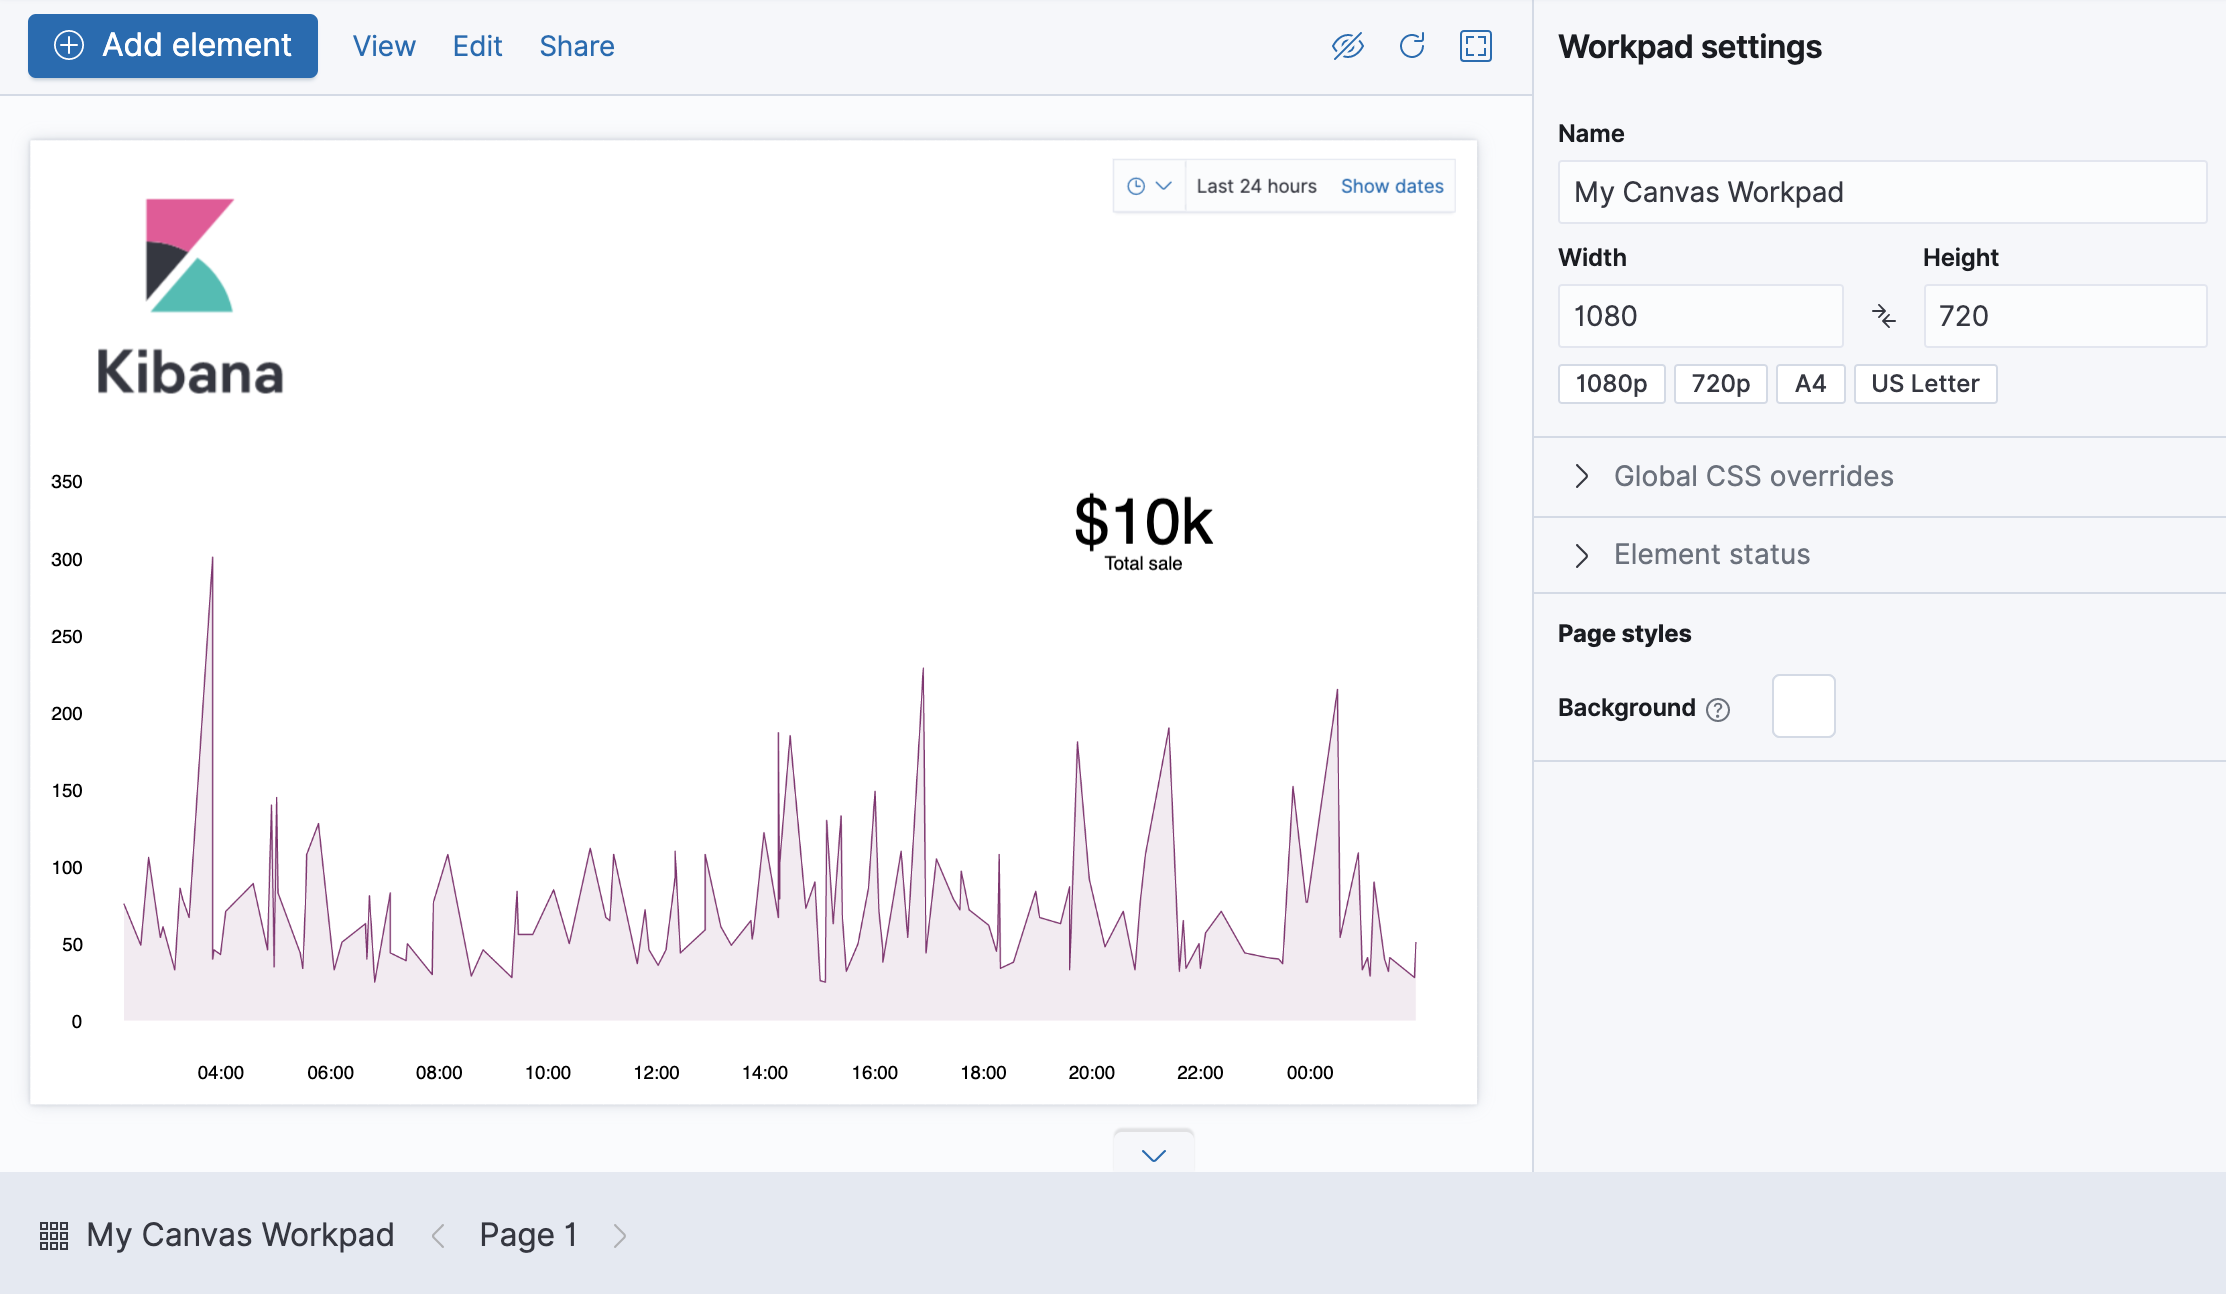
To see how the data changes, set the time filter to Last 7 days. As you change the time filter options, the elements automatically update.
Your workpad is now complete!
Next steps
editNow that you know the Canvas basics, you’re ready to explore on your own.
Here are some things to try:
- Play with the sample Canvas workpads.
- Build presentations of your own live data with workpads.
- Learn more about elements — the building blocks of your workpad.
- Deep dive into the expression language and functions that drive Canvas.