Machine learning
editMachine learning
editAs data sets increase in size and complexity, the human effort required to inspect dashboards or maintain rules for spotting infrastructure problems, cyber attacks, or business issues becomes impractical. Elastic machine learning features such as anomaly detection and outlier detection make it easier to notice suspicious activities with minimal human interference.
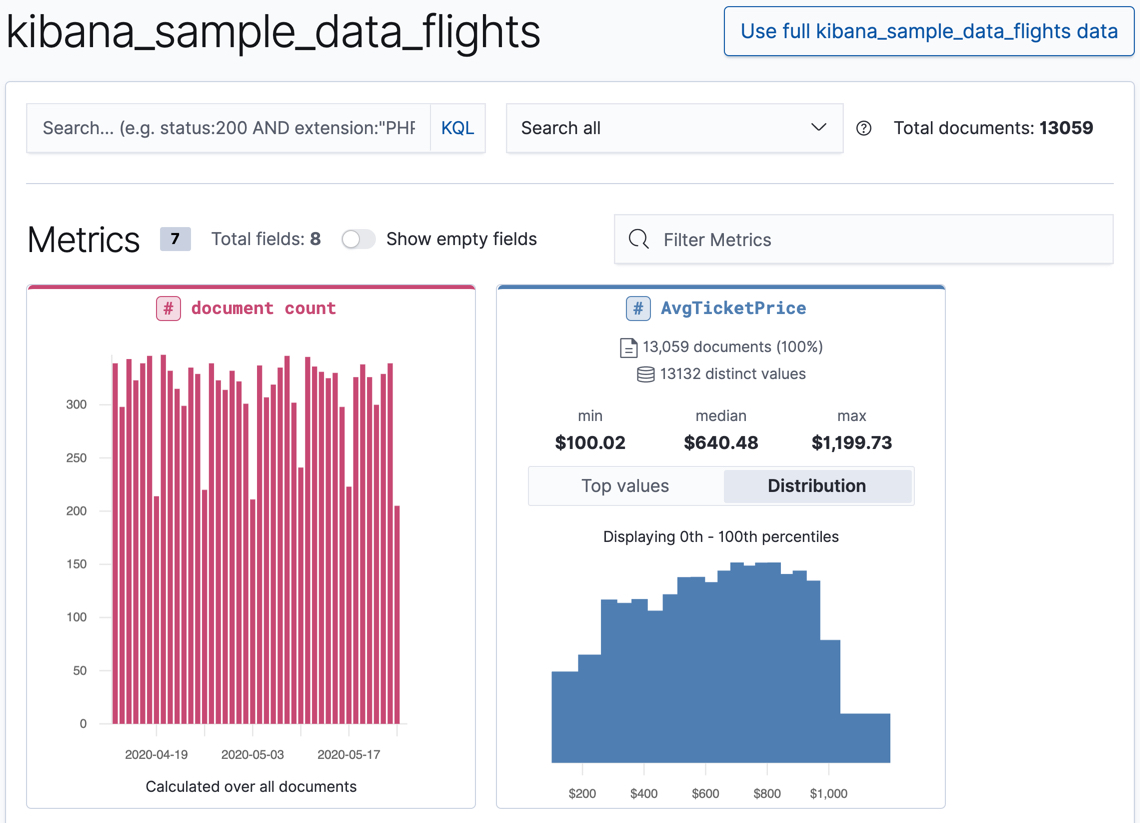
Kibana includes a free Data Visualizer to learn more about your data. In particular, if your data is stored in Elasticsearch and contains a time field, you can use the Data Visualizer to identify possible fields for anomaly detection:
[preview] This functionality is in technical preview and may be changed or removed in a future release. Elastic will work to fix any issues, but features in technical preview are not subject to the support SLA of official GA features. You can also upload a CSV, NDJSON, or log file. The Data Visualizer identifies the file format and field mappings. You can then optionally import that data into an Elasticsearch index. To change the default file size limit, see Machine learning.
You need the following permissions to use the Data Visualizer with file upload:
-
cluster privileges:
monitor,manage_ingest_pipelines -
index privileges:
read,manage,index
For more information, see Security privileges and Set up machine learning features.