Monitor
editMonitor
editThe Monitor page will help you get further insight into the performance
of a specific network endpoint. You’ll see a detailed visualization of
the monitor’s request duration over time, as well as the up/down
status over time. You can also also detect anomalies in response time data
by configuring Machine Learning jobs on this page.
Status panel
edit
The Status panel displays a quick summary of the latest information regarding your monitor. You can view its latest status, click a link to visit the targeted URL, see its most recent request duration, and determine the amount of time that has elapsed since the last check.
When two Heartbeat instances are configured in different geographic locations the map will show each location as a pinpoint on the map, along with the amount of time elapsed since data was last received from that location.
Monitor charts
edit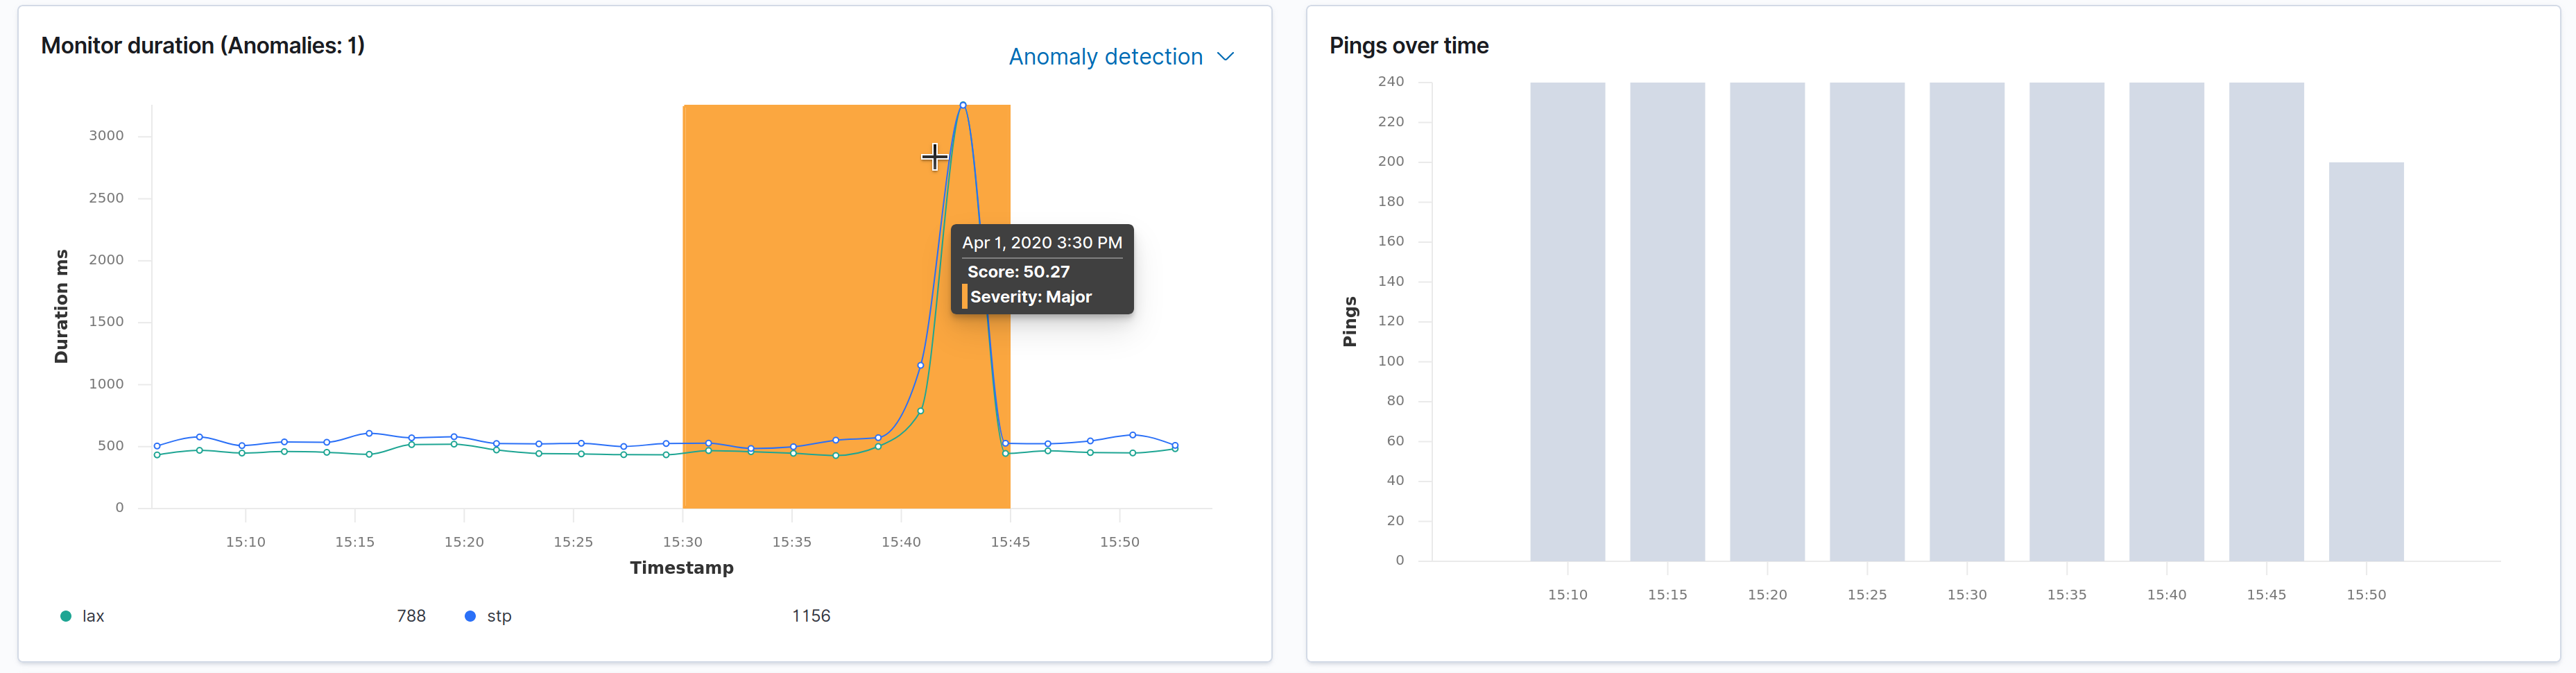
The Monitor charts visualize information over the time specified in the date range. These charts can help you gain insight into how quickly requests are being resolved by the targeted endpoint, and give you a sense of how frequently a host or endpoint was down in your selected timespan.
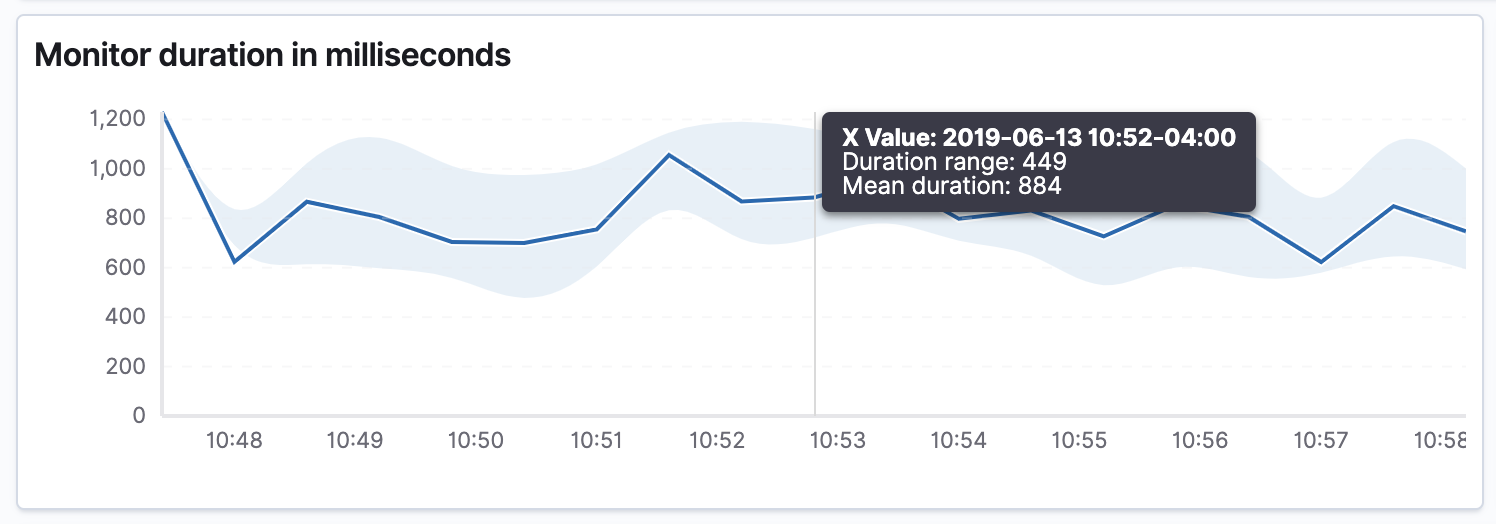
The Monitor duration chart displays request duration information for your monitor. The area surrounding the line is the range of request time for the corresponding bucket. The line is the average time. Anomaly detection using Machine Learning can be configured in the upper right hand of this panel. When response times change in an unexpected way the time range in which they occurred will be given filled with a color.
The pings over time chart is a graphical representation of the check statuses over time. Hover over the charts to display crosshairs with more specific numeric data.
Check history
edit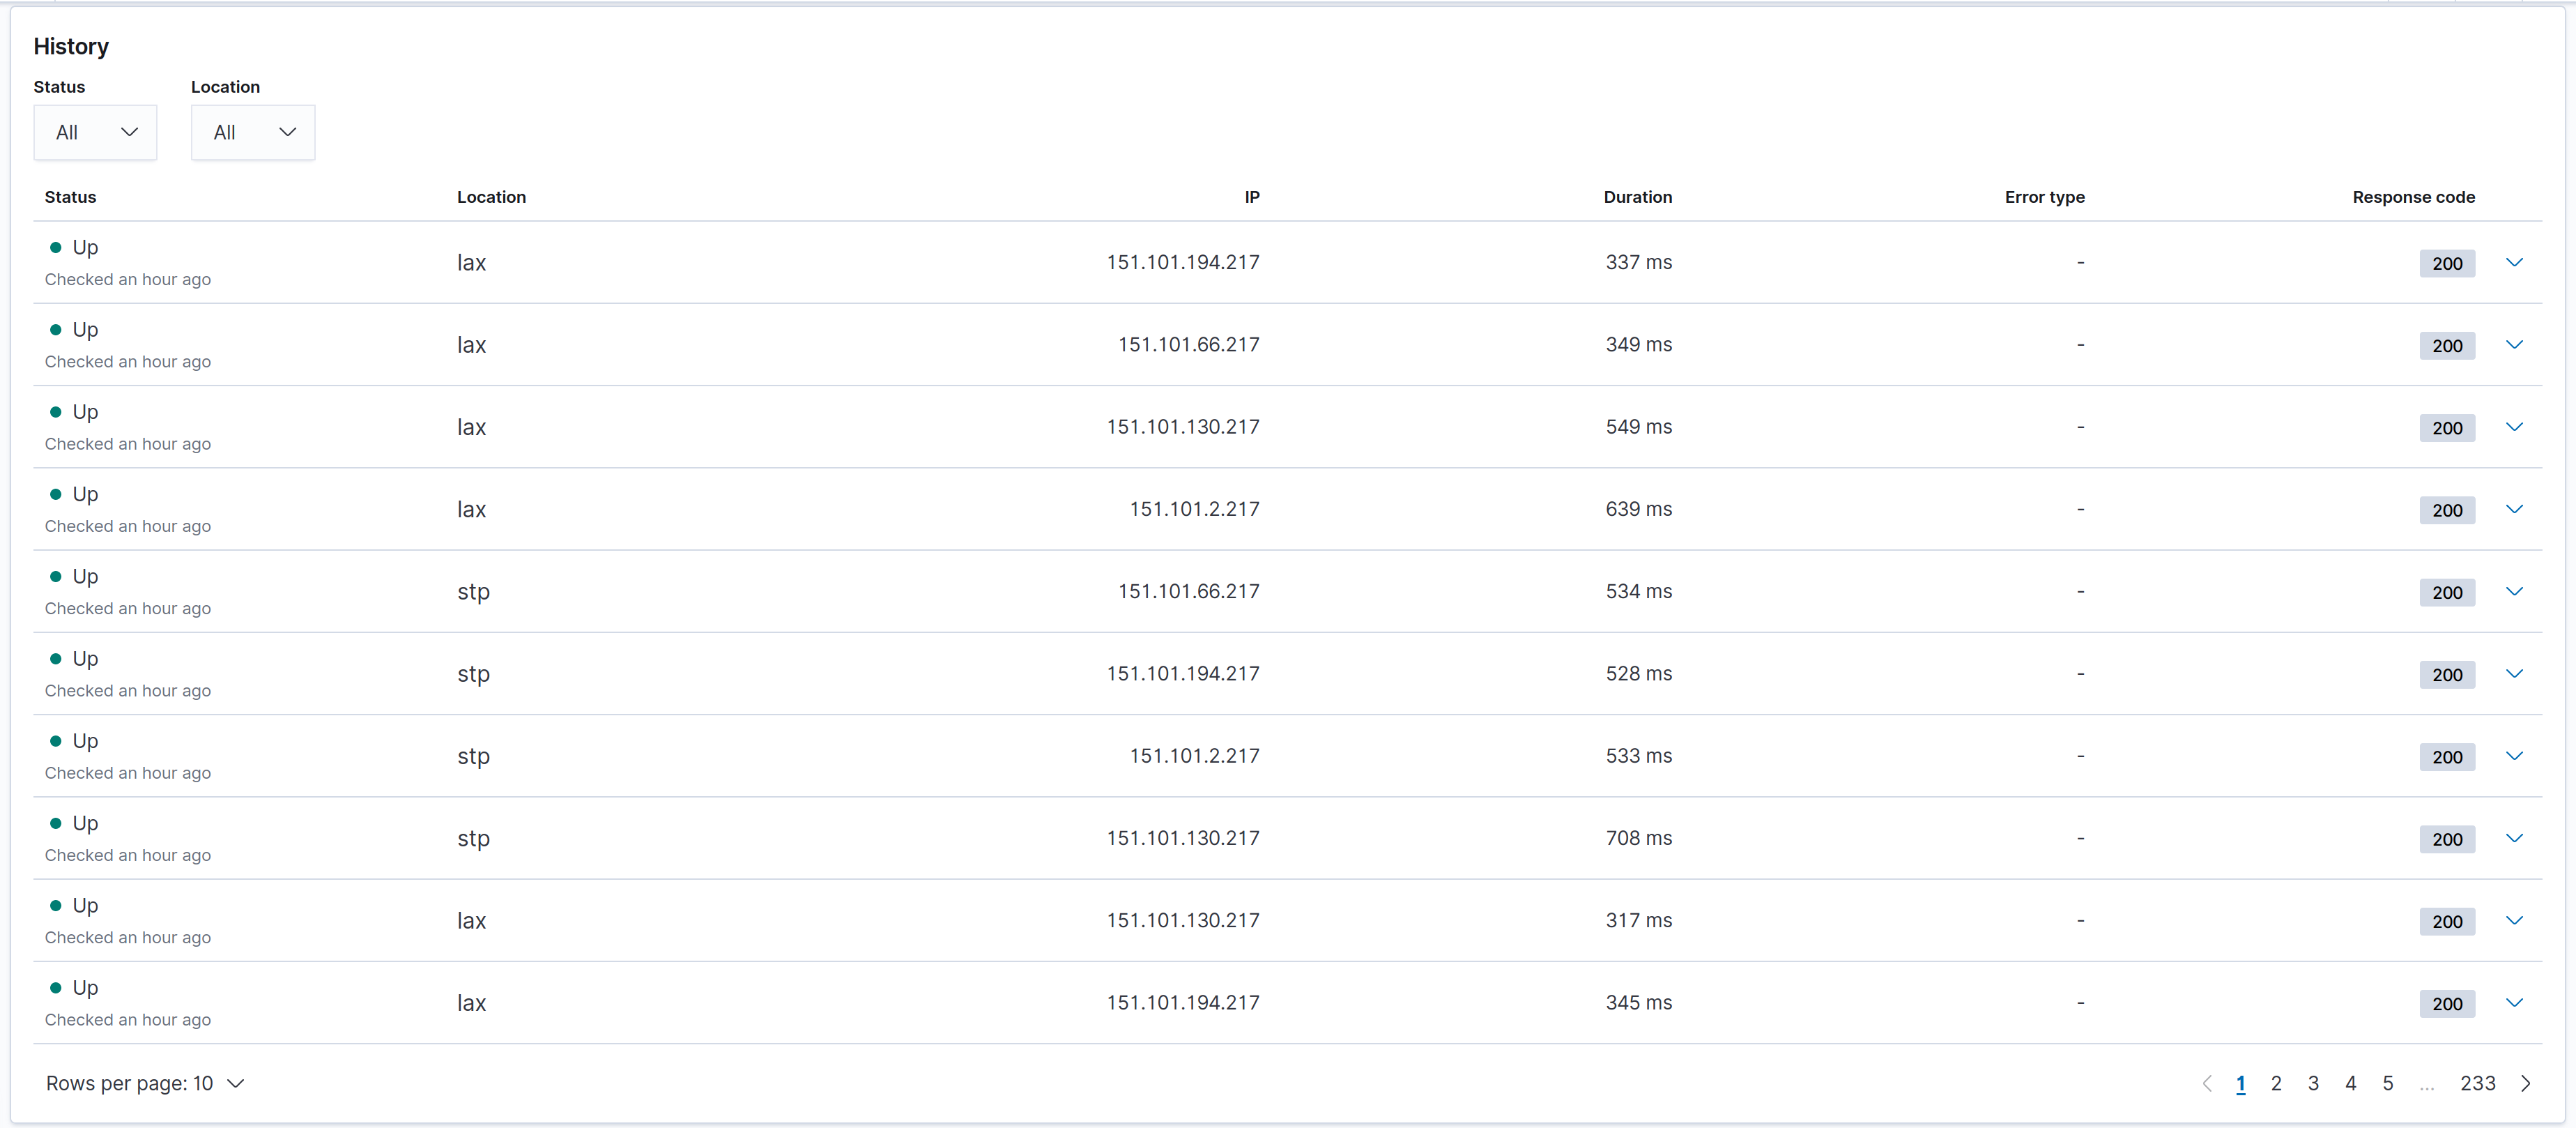
The Check history displays the total count of this monitor’s checks for the selected date range. You can additionally filter the checks by status and location to help find recent problems on a per-check basis. This table can help you gain some insight into more granular details about recent individual data points Heartbeat is logging about your host or endpoint.