Adding layers for Elasticsearch data
editAdding layers for Elasticsearch data
editTo avoid overwhelming the user with too much data at once, you’ll add two layers for Elasticsearch data.
- The first layer will display individual documents. The layer will appear when the user zooms in the map to show smaller regions.
- The second layer will show aggregated data that represents many documents. The layer will appear when the user zooms out the map to show larger amounts of the globe.
Add a vector layer from the document source
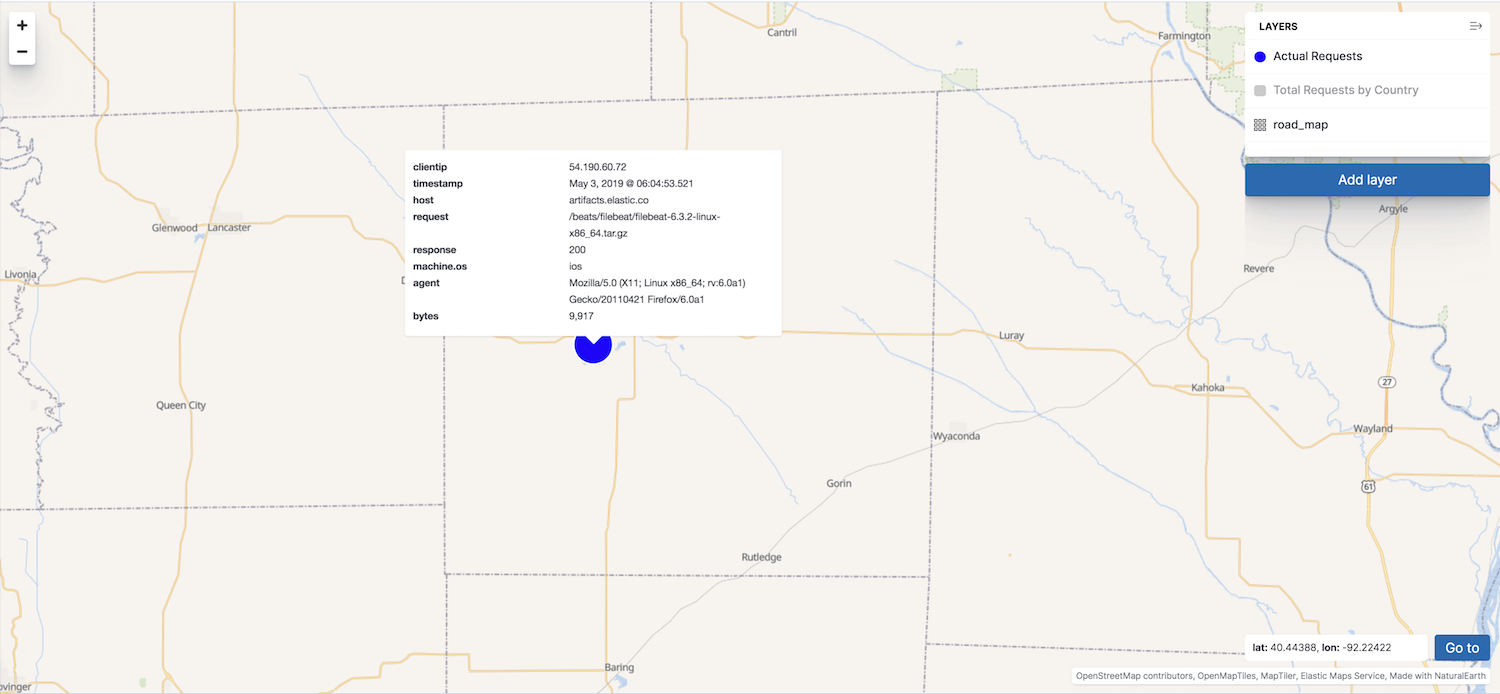
editThis layer displays web log documents as points. The layer is only visible when users zoom in the map past zoom level 9.
- In the map legend, click Add layer.
- Click the Documents data source.
- Set Index pattern to kibana_sample_data_logs.
- Click the Add layer button.
-
Set Name to
Actual Requests. - Set Visibilty to the range [9, 24].
- Set Opacity to 100%.
- Click Add under Tooltip fields.
- In the popover, select clientip, timestamp, host, request, response, machine.os, agent, and bytes and click Add.
- Set Fill color to #2200ff.
-
Click Save & close.
Your map now looks like this between zoom levels 9 and 24:
Add a vector layer from the grid aggregation source
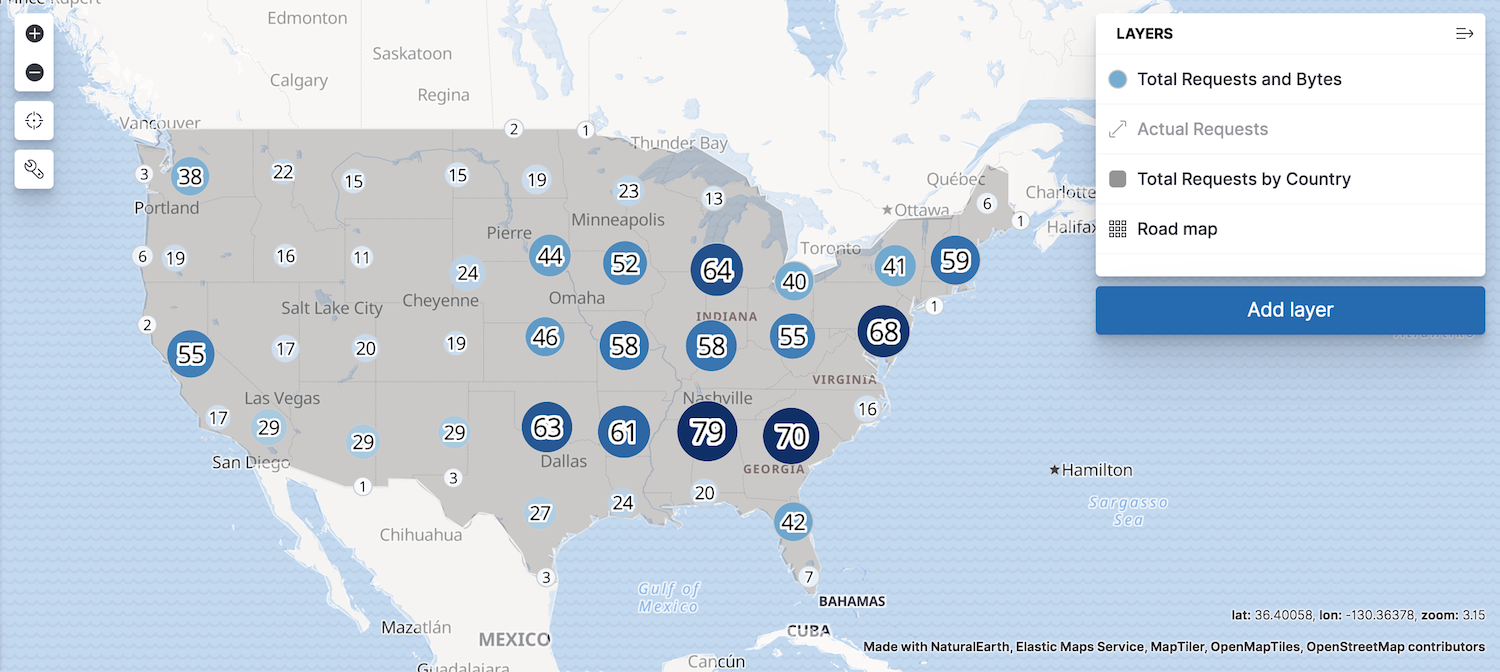
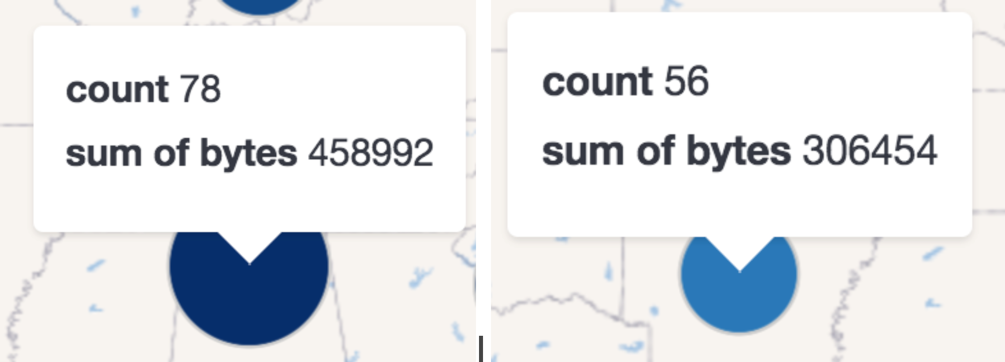
editAggregations group Elasticsearch documents into grids. You can calculate metrics for each gridded cell.
You’ll create a layer for aggregated data and make it visible only when the map is zoomed out past zoom level 9. Darker colors will symbolize grids with more web log traffic, and lighter colors will symbolize grids with less traffic. Larger circles will symbolize grids with more total bytes transferred, and smaller circles will symbolize grids with less bytes transferred.
Add the layer
edit- In the map legend, click Add layer.
- Click the Grid aggregation data source.
- Set Index pattern to kibana_sample_data_logs.
- Set Show as to clusters.
- Click the Add layer button.
-
Set Name to
Total Requests and Bytes. - Set Visibility to the range [0, 9].
- Set Opacity to 100%.
Configure the aggregation metrics
edit- Click Add metric under of Metrics label.
- Select Sum in the aggregation select.
- Select bytes in the field select.
Set the layer style
edit-
In Layer style, change Symbol size:
- Set Min size to 7.
- Set Max size to 25.
- Change the field select from count to sum of bytes.
-
Click Save & close button.
Your map now looks like this between zoom levels 0 and 9: