Create a graph
editCreate a graph
editYou must index data into Elasticsearch before you can create a graph. Learn how or get started with a sample data set.
Graph a data connection
edit-
From the side navigation, open Graph.
If this is your first graph, follow the prompts to create it. For subsequent graphs, click New.
- Select a data source to explore.
-
Add one or more multi-value fields that contain the terms you want to graph.
The vertices in the graph are selected from these terms.
-
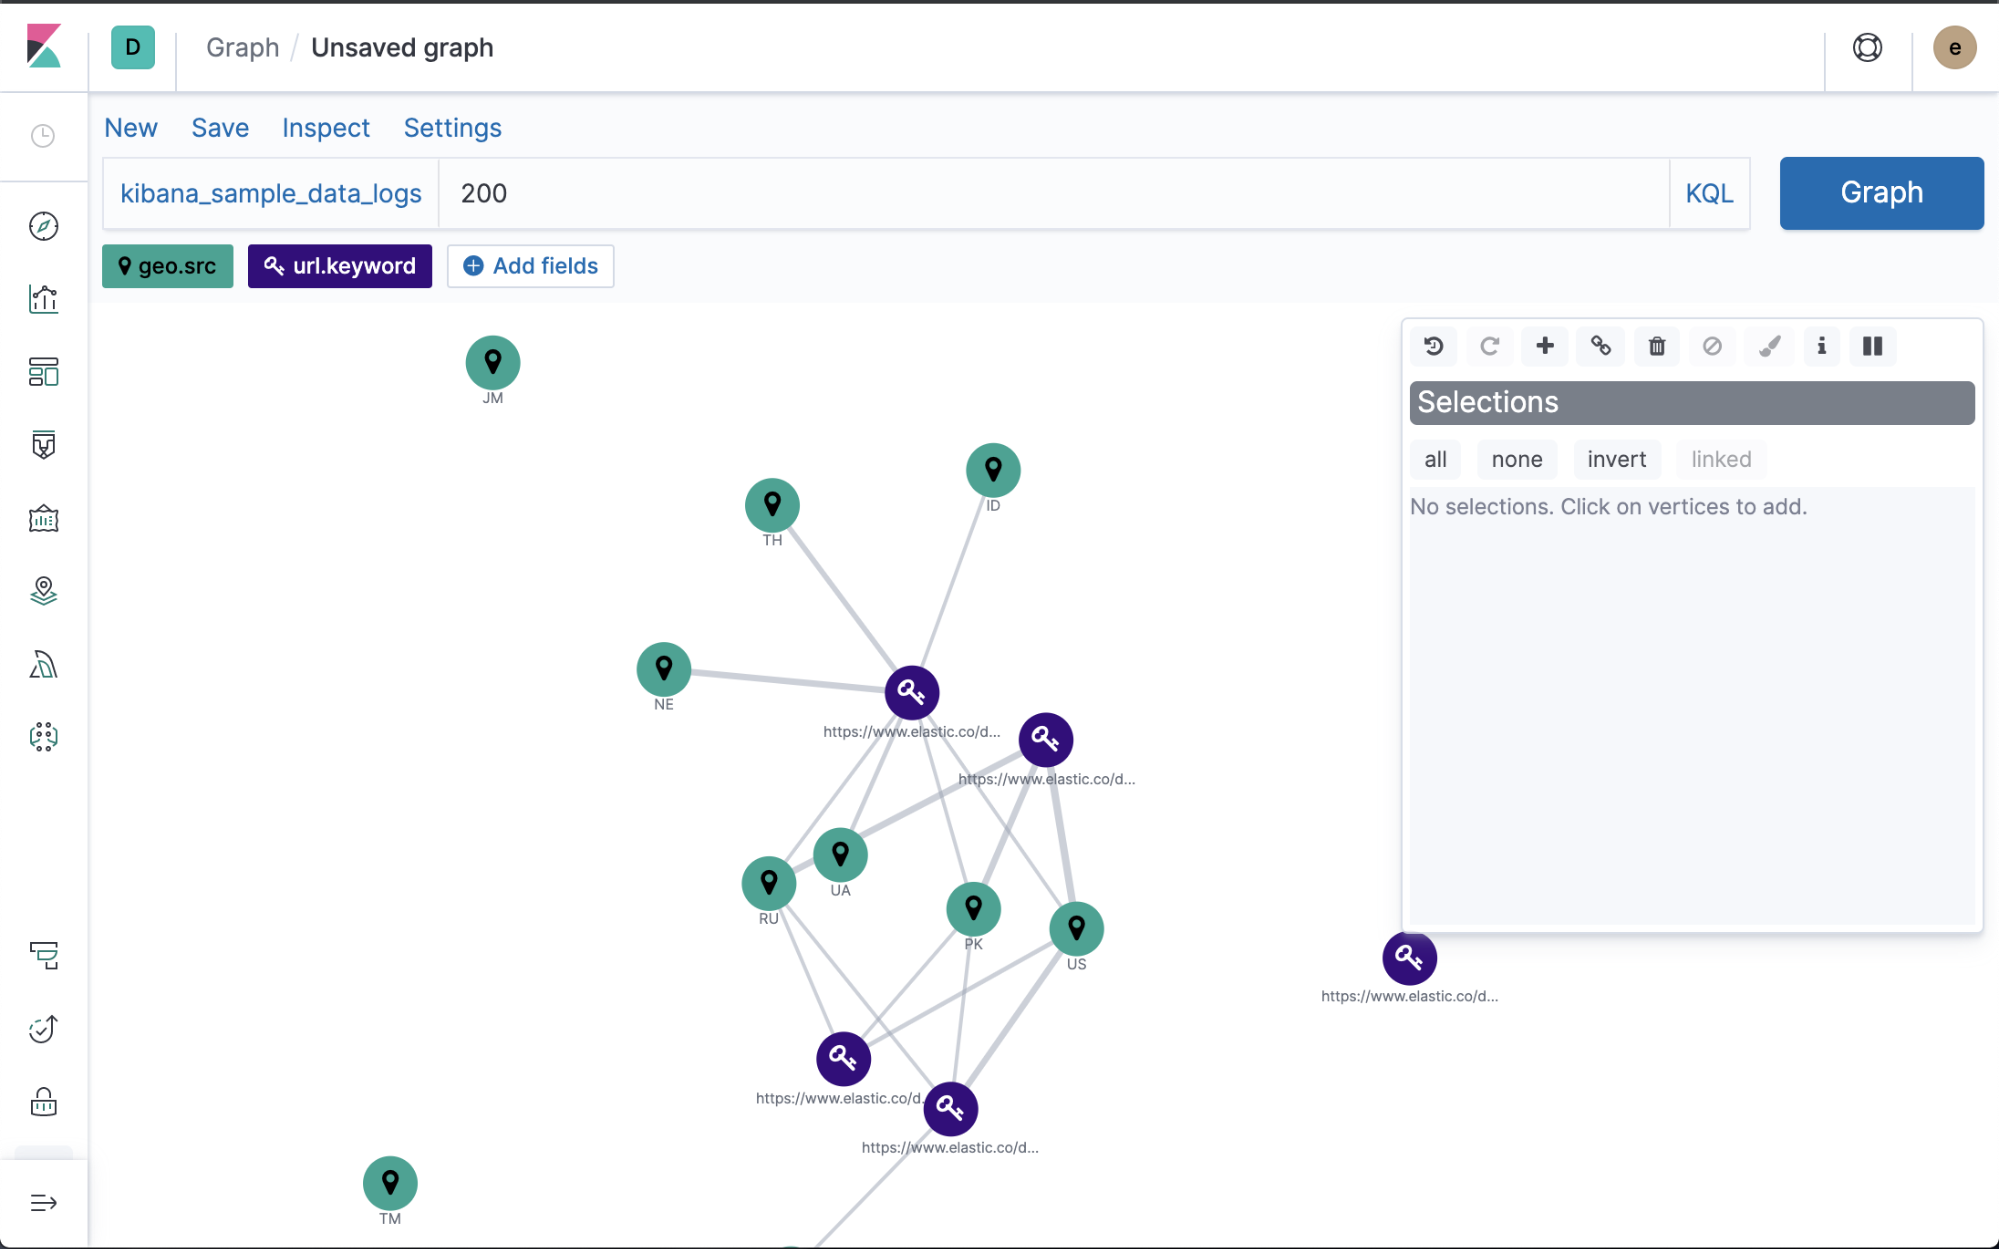
Enter a search query to discover relationships between terms in the selected fields.
For example, if you are using the Kibana sample web logs data set, and you want to generate a graph of the successful requests to particular pages from different locations, you could search for the 200 response code. The weight of the connection between two vertices indicates how strongly they are related.
-
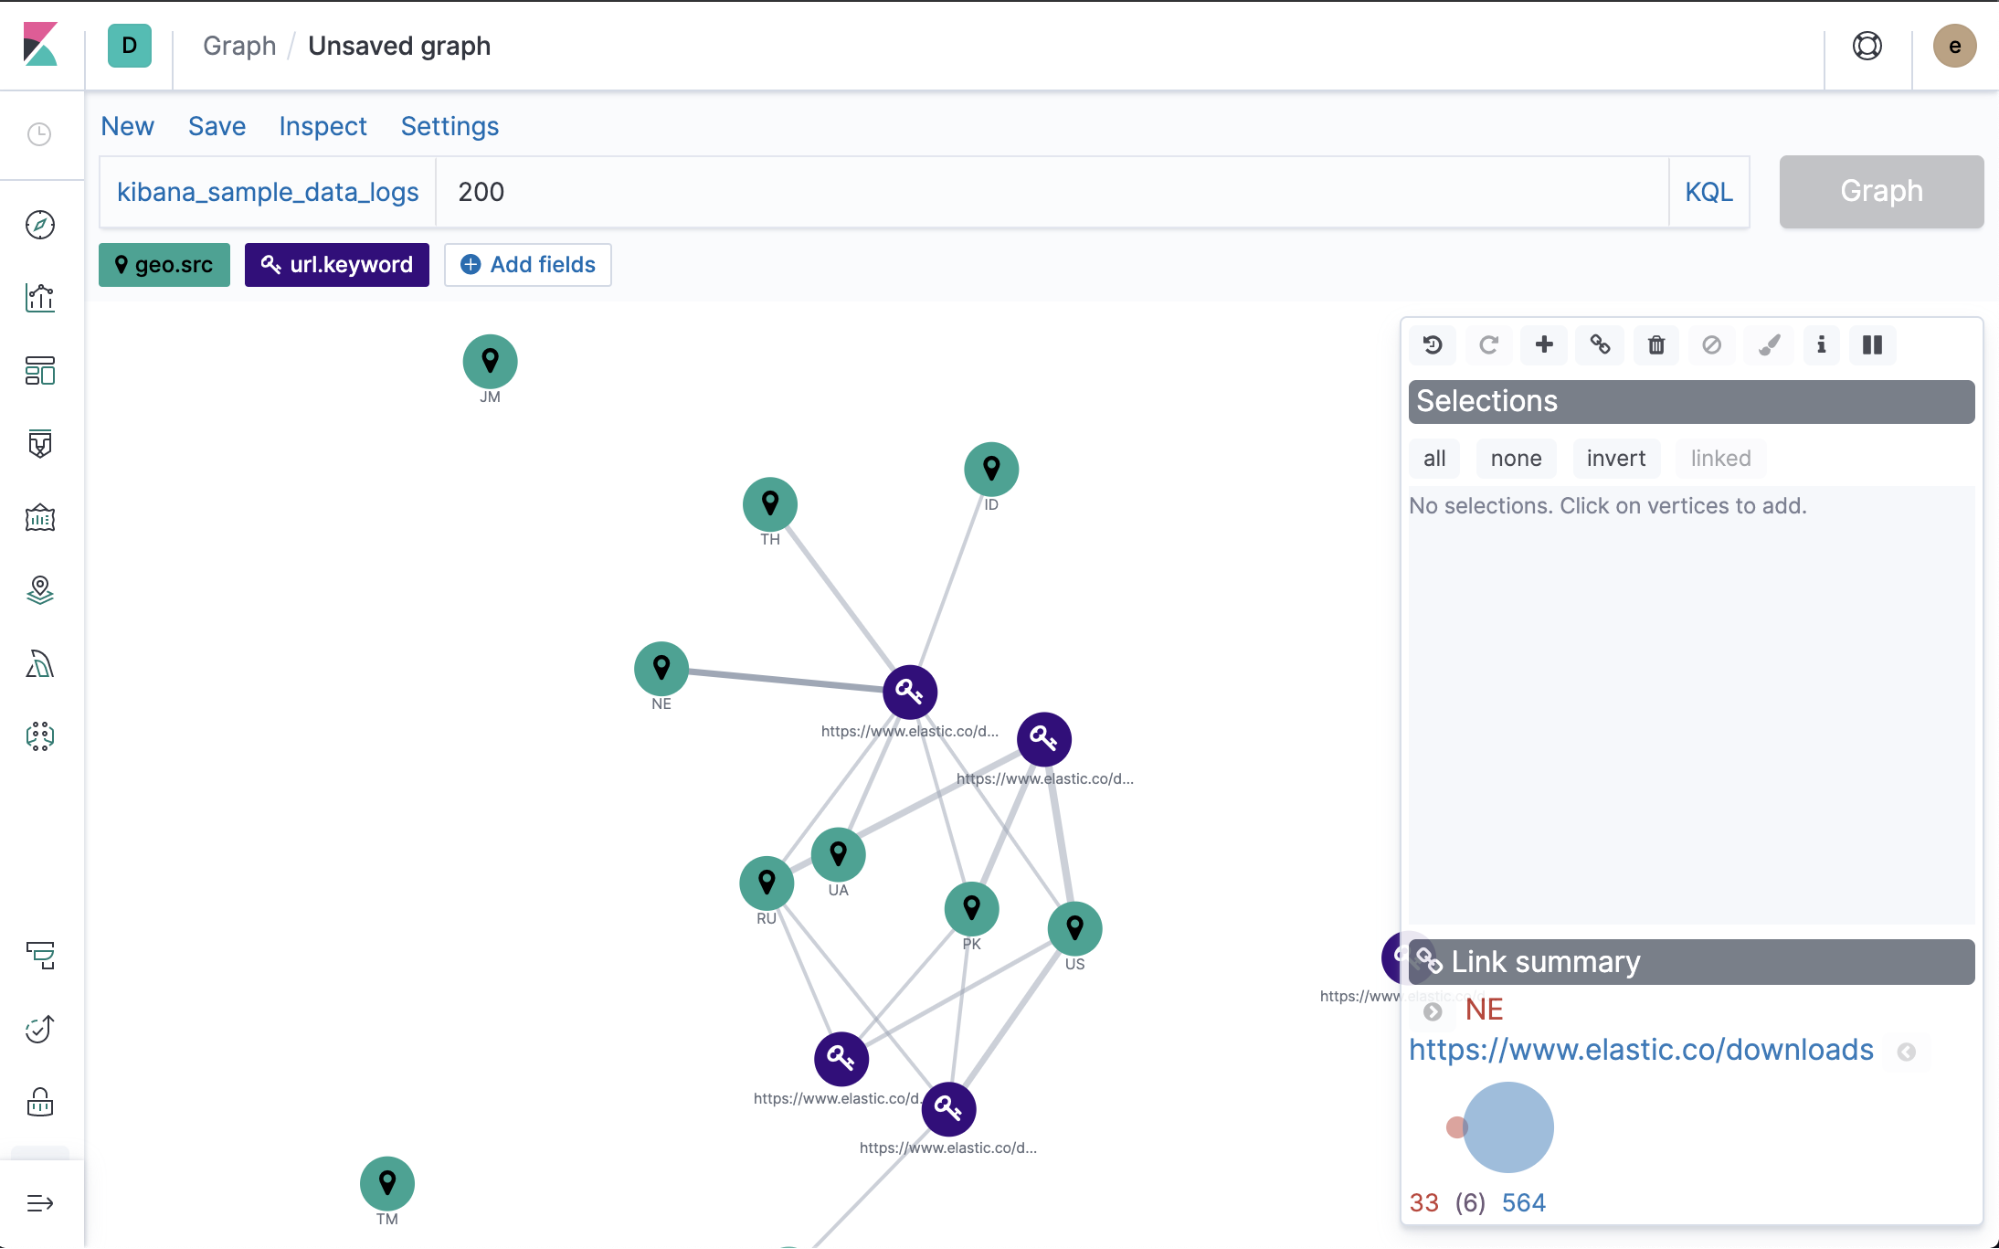
To view more information about the relationship, click any connection.
-
Use the control bar to explore additional connections:
-
To display additional vertices that connect to your graph, click the expand icon
 .
.
-
To display additional
connections between the displayed vertices, click the link icon
 .
.
- To explore a particular area of the graph, select the vertices you are interested in, and then click expand or link.
-
To step back through your changes to the graph, click undo
 and redo
 .
.
-
To display additional vertices that connect to your graph, click the expand icon
-
To see more relationships in your data, submit additional queries.
- Save your graph.
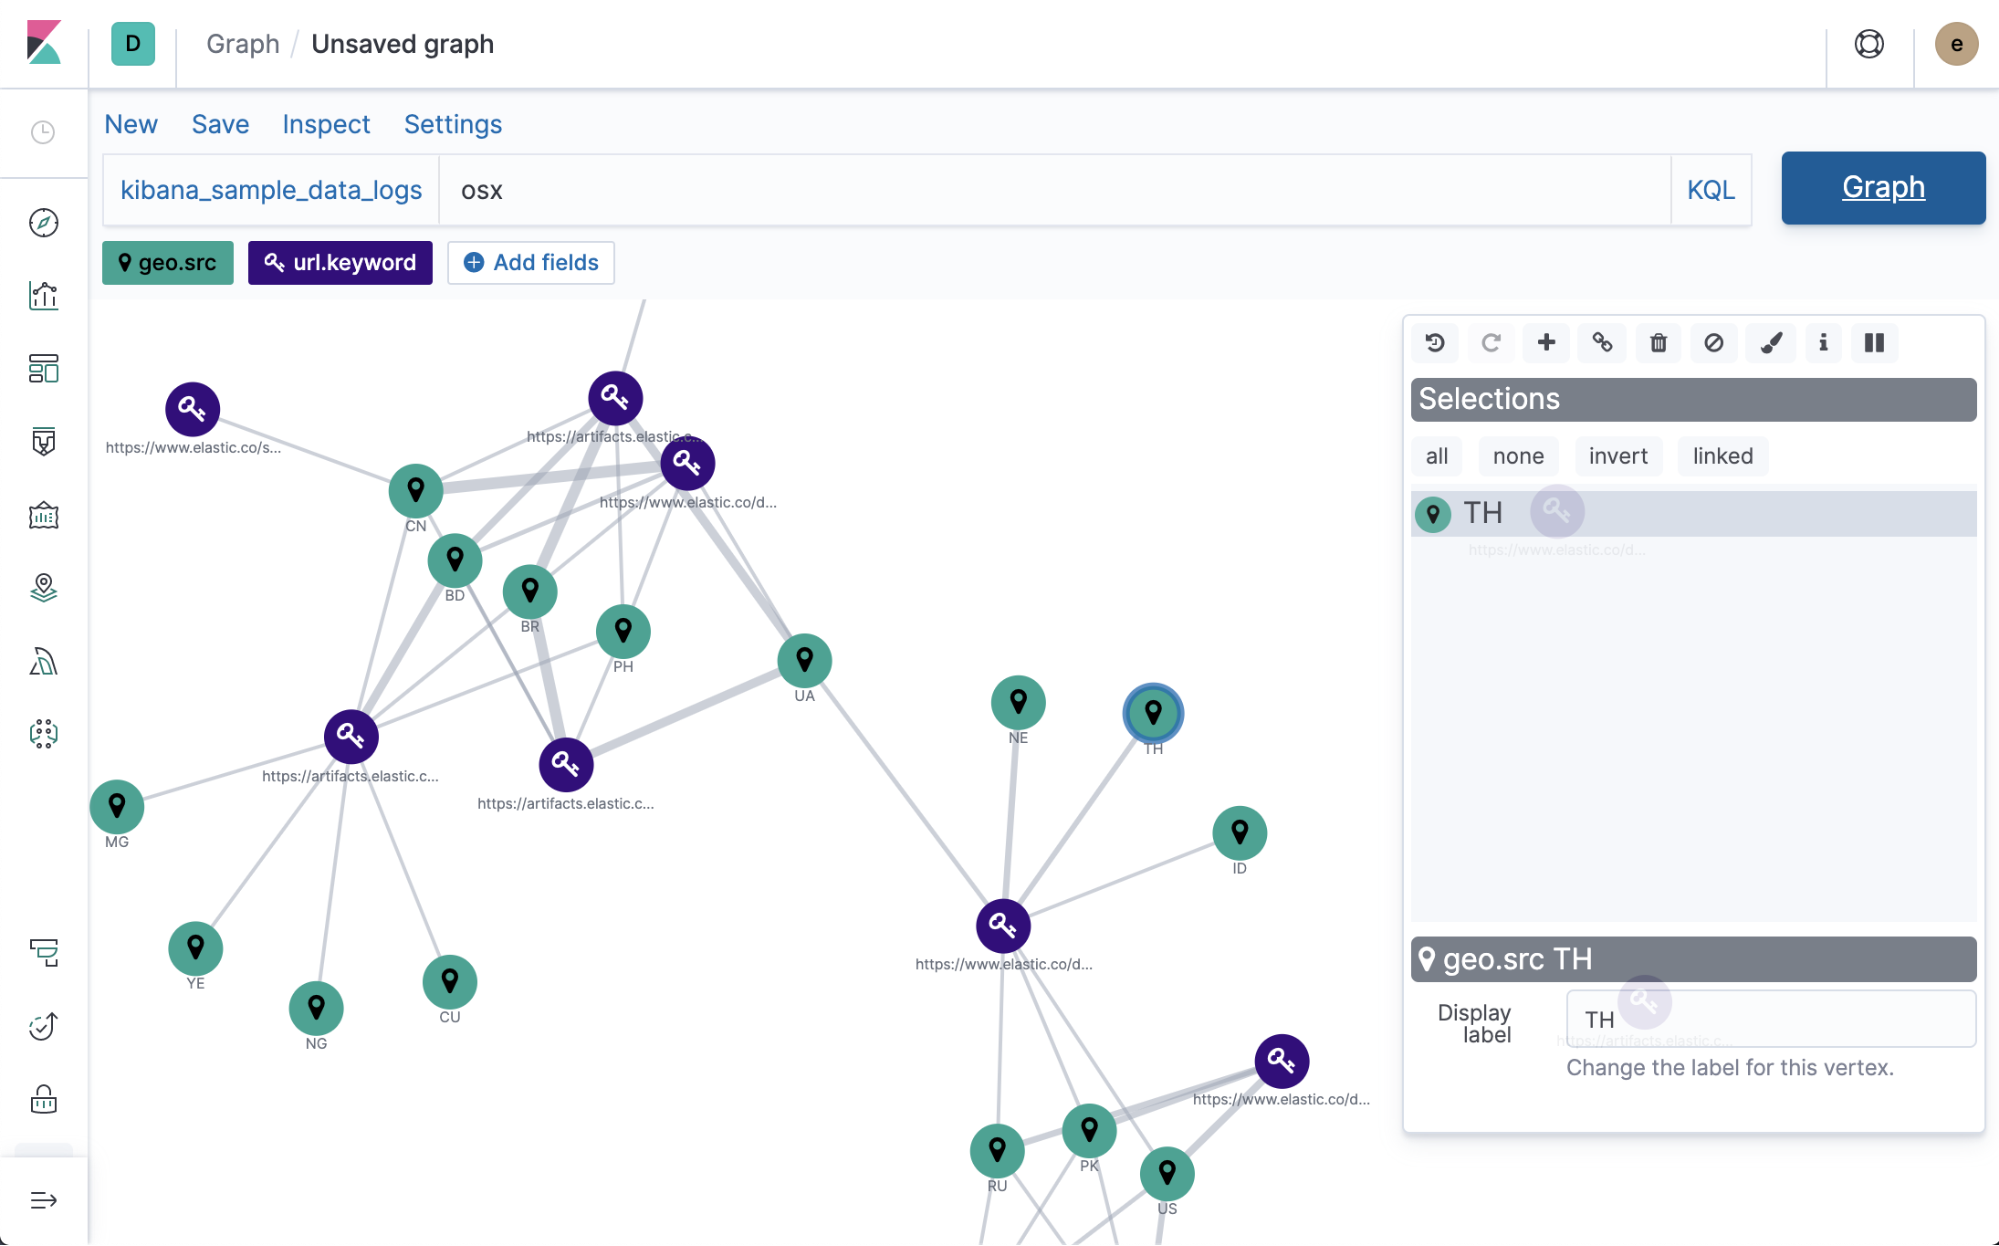
Style vertex properties
editEach vertex has a color, icon, and label. To change the color or icon of all vertices of a certain field, click it’s badge, and then select Edit settings.
To change the color and label of selected vertices,
click the style icon  in the control bar.
Edit graph settings
editBy default, Graph is configured to tune out noise in your data. If this isn’t a good fit for your data, use Settings > Advanced settings to adjust the way Graph queries your data. You can tune the graph to show only the results relevant to you and to improve performance. For more information, see Graph troubleshooting.
You can configure the number of vertices that a search or expand operation adds to the graph. By default, only the five most relevant terms for any given field are added at a time. This keeps the graph from overflowing. To increase this number, click a field, select Edit Settings, and change Terms per hop.
Block terms from the graph
editDocuments that match a blocked term are not allowed in the graph.
To block a term, select its vertex and click
the block icon
 in the control panel.
For a list of blocked terms, go to Settings > Blocked terms.
in the control panel.
For a list of blocked terms, go to Settings > Blocked terms.
Drill down into raw documents
editWith drilldowns, you can display additional information about a selected vertex in a new browser window. For example, you might configure a drilldown URL to perform a web search for the selected vertex term.
Use the drilldown icon ![]() in the control panel to show the drilldown buttons for the selected vertices.
To configure drilldowns, go to Settings > Drilldowns. See also
Disabling drilldown configuration.
in the control panel to show the drilldown buttons for the selected vertices.
To configure drilldowns, go to Settings > Drilldowns. See also
Disabling drilldown configuration.
Run and pause layout
editGraph uses a "force layout", where vertices behave like magnets,
pushing off of one another. By default, when you add a new vertex to
the graph, all vertices begin moving. In some cases, the movement might
go on for some time. To freeze the current vertex position,
click the pause icon
 in the control panel.