Using the Metrics app
editUsing the Metrics app
editUse the Metrics app in Kibana to monitor your infrastructure metrics and identify problems in real time. You can explore metrics for hosts, containers, and services. You can also drill down to view more detailed metrics, or seamlessly switch to view the corresponding logs, application traces, and uptime information.
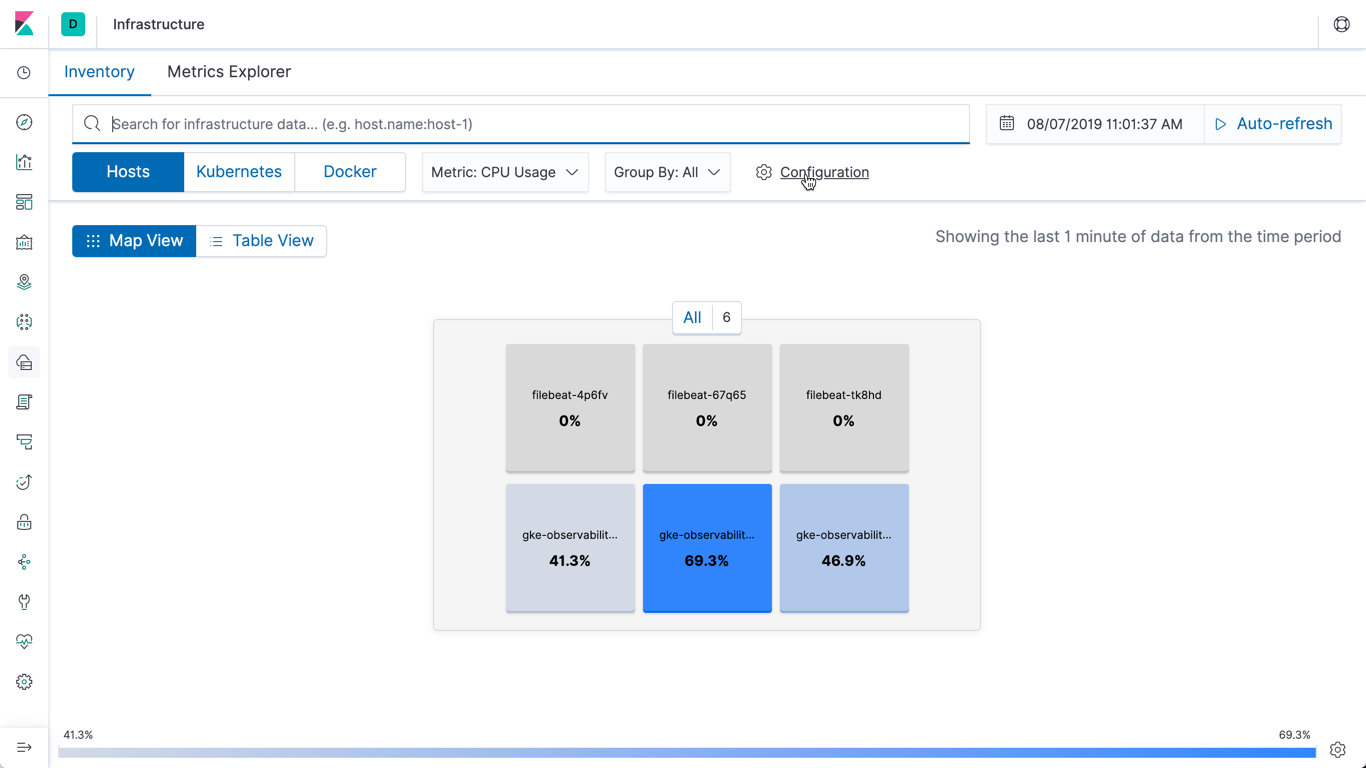
Initially, the Inventory tab shows an overview of the hosts in of your infrastructure and the current CPU usage for each host. From here, you can view other metrics or drill down into areas of interest.
Choose the high-level view of your infrastructure
editSelect the high-level view from Hosts, Kubernetes, or Docker. When you change views, you see the same data through the perspective of a different category.
The default representation is the Map view, which shows your components in a waffle map of one or more rectangular grids. If the view you select has a large number of components, you can hover over a component to see the details for that component. Alternatively, if you would prefer to see your infrastructure as a table, click Table view.
Select the metric to view
editSelect the metric to view from the Metric dropdown list. The available metrics are those that are most relevant for the high-level view you selected.
Group components
editSelect the way you want to group the infrastructure components from the Group By dropdown list. The available options are specific to your physical, virtual, or container-based infrastructure. Examples of grouping options include Availability Zone, Machine Type, Project ID, and Cloud Provider for hosts, and Namespace and Node for Kubernetes.
Use the power of search
editUse the search bar to perform ad hoc searches for specific text.
You can also create structured searches using Kibana Query Language.
For example, enter host.hostname : "host1" to see only the information for host1.
Specify the time and date
editClick the time filter  to choose the timeframe for the metrics.
The values shown are the values for the last minute at the specified time and date.
to choose the timeframe for the metrics.
The values shown are the values for the last minute at the specified time and date.
Auto-refresh metrics
editSelect Auto-refresh to keep up-to-date metrics information coming in, or Stop refreshing to focus on historical data without new distractions.
Configure the data to use for your metrics
editIf your metrics have custom index patterns, or use non-default field settings, you can override the default configuration settings.
The default source configuration for metrics is specified in the Metrics app settings in the Kibana configuration file.
The default configuration uses the metricbeat-* index pattern to query the data.
The default configuration also defines field settings for things like timestamps and container names.
To change the configuration settings, click the Settings tab.
These settings are shared with logs. Changes you make here may also affect the settings used by the Logs app.
In the Settings tab, you can change the values in these sections:
- Name: the name of the source configuration
- Indices: the index pattern or patterns in the Elasticsearch indices to read metrics data and log data from
- Fields: the names of specific fields in the indices that are used to query and interpret the data correctly
When you have completed your changes, click Apply.
If the fields are greyed out and cannot be edited, you may not have sufficient privileges to change the source configuration. For more information see Granting access to Kibana.
If Spaces are enabled in your Kibana instance, any configuration changes you make here are specific to the current space. You can make different subsets of data available by creating multiple spaces with different data source configurations.
Visualize multiple metrics in Metrics Explorer
editMetrics Explorer allows you to visualize and analyze metrics for multiple components in a powerful and configurable way. Click the Metrics Explorer tab to get started.
Drill down for related information
editHover over a component to see more information about that component.
Click a component to see the other actions available for that component. You can:
- Select View Metrics to view detailed infrastructure metrics.
- Select View Logs to view the logs in the Logs app.
Depending on the features you have installed and configured, you may also be able to:
- Select View APM to view APM traces in the APM app.
- Select View Uptime to view uptime information in the Uptime app.