Using the Logs app
editUsing the Logs app
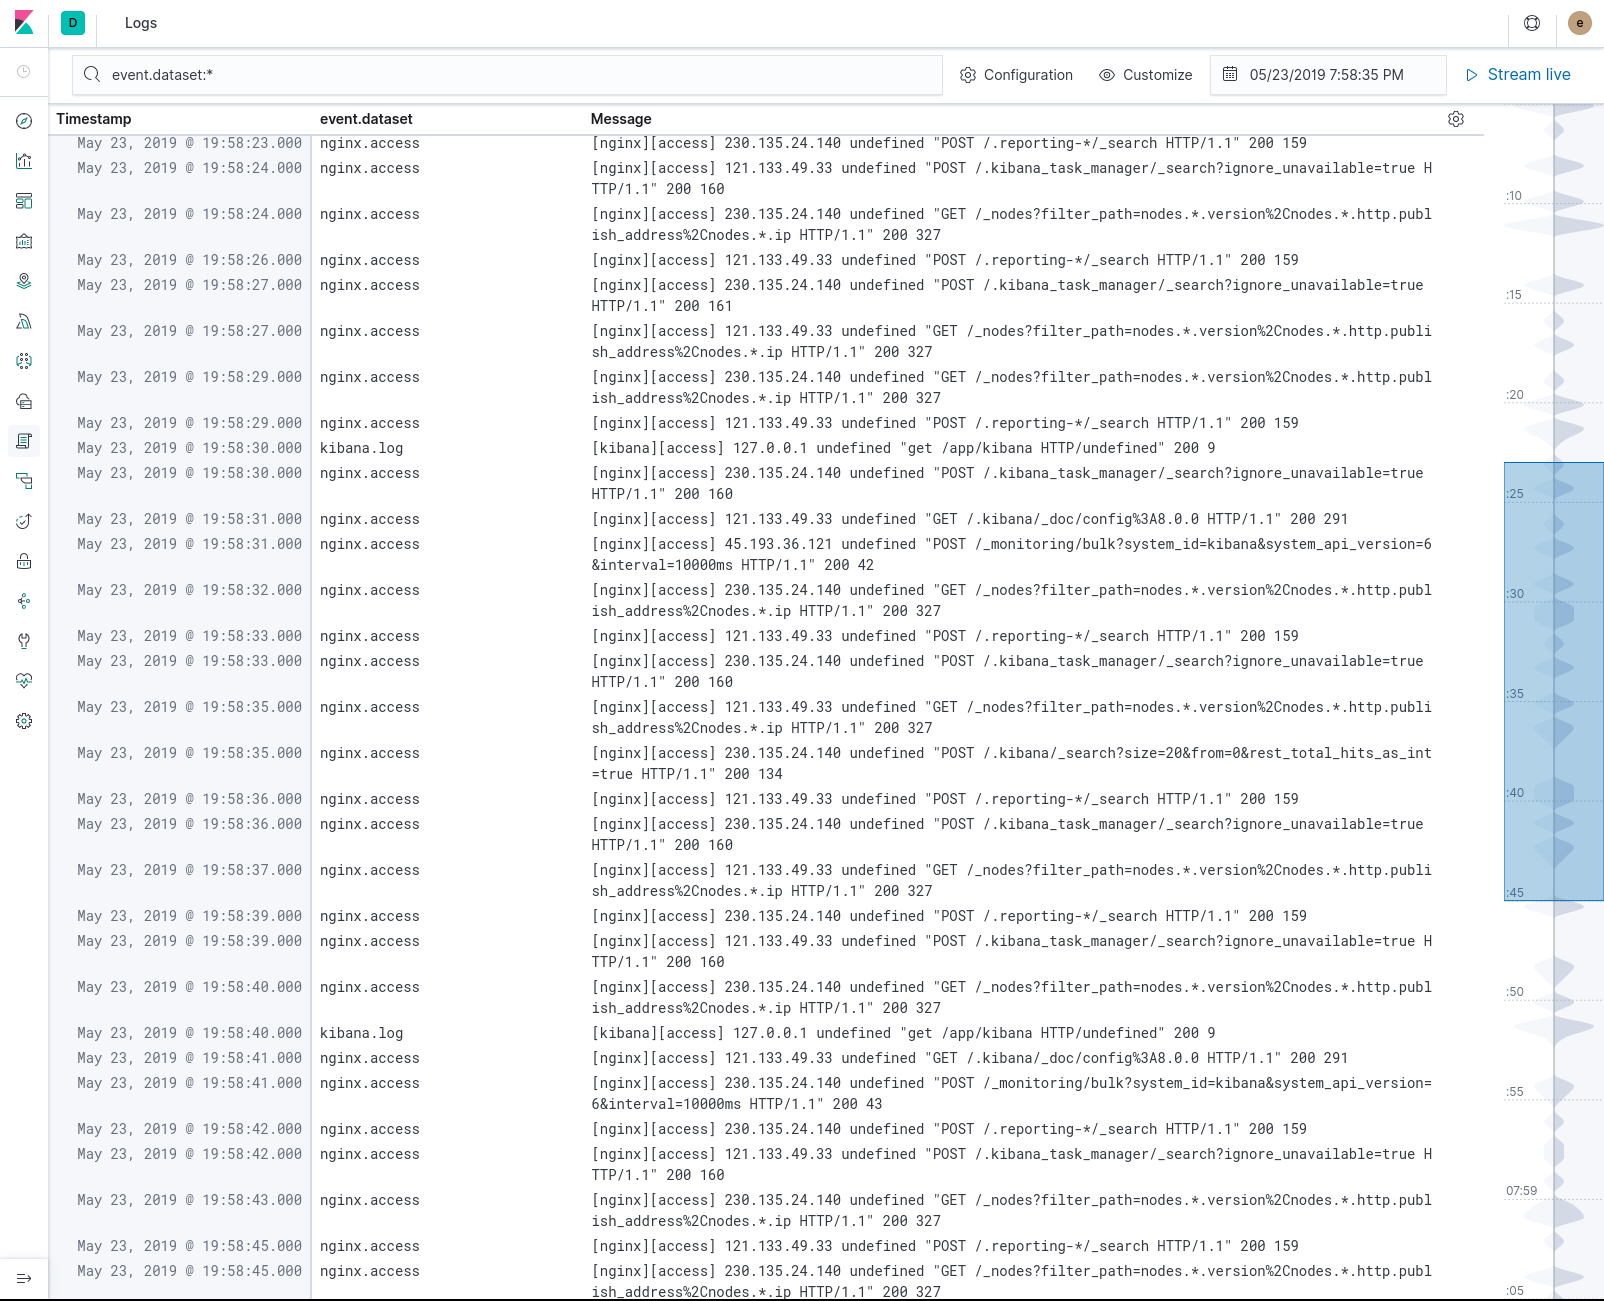
editUse the Logs app in Kibana to explore and filter your logs in real time.
You can customize the output to focus on the data you want to see and to control how you see it. You can also view related application traces or uptime information where available.
Use the power of search
editUse the search bar to perform ad hoc searches for specific text.
You can also create structured queries using Kibana Query Language.
For example, enter host.hostname : "host1" to see only the information for host1.
Configure the data to use for your logs
editAre you using a custom index pattern to store the log entries? Do you want to limit the entries shown or change the fields displayed in the columns? If so, configure the logs source data to change the index pattern and other settings.
Specify the time and date
editClick  , then choose the time range for the logs.
Log entries for the specified time appear in the middle of the page, with the earlier entries above and the later entries below.
To quickly jump to a nearby point in time, click the minimap timeline to the right.
Customize your view
editClick Customize to customize the view. Here, you can set the scale to use for the minimap timeline, choose whether to wrap long lines, and choose your preferred text size.
Stream or pause logs
editClick Stream live to start streaming live log data, or click Stop streaming to focus on historical data.
When you are viewing historical data, you can scroll back through the entries as far as there is data available.
When you are streaming live data, the most recent log appears at the bottom of the page. In live streaming mode, you are not able to choose a different time in the time selector or use the minimap timeline. To do either of these things, you need to stop live streaming first.
Highlight a phrase in the logs stream
editTo highlight a word or phrase in the logs stream, click Highlights and enter your search phrase.
Inspect a log event
editTo inspect a log event, hover over it, then click the View details icon  beside the event.
This opens the Log event document details fly-out that shows the fields associated with the log event.
beside the event.
This opens the Log event document details fly-out that shows the fields associated with the log event.
To quickly filter the logs stream by one of the field values, click the View event with filter icon  beside the field.
This automatically adds a search filter to the logs stream to filter the entries by this field and value.
beside the field.
This automatically adds a search filter to the logs stream to filter the entries by this field and value.
In the log event details, click Actions to see the other actions related to the event. Depending on the event and the features you have installed and configured, you may also be able to:
- Select View monitor status to view related uptime information in the Uptime app.
- Select View in APM to view related APM traces in the APM app.