Monitor
editMonitor
editThe Monitor page will help you get further insight into the performance
of a specific network endpoint. You’ll see a detailed visualization of
the monitor’s request duration over time, as well as the up/down
status over time.
Status bar
edit
The Status bar displays a quick summary of the latest information regarding your monitor. You can view its latest status, click a link to visit the targeted URL, see its most recent request duration, and determine the amount of time that has elapsed since the last check.
You can use the Status bar to get a quick summary of current performance,
beyond simply knowing if the monitor is up or down.
Monitor charts
edit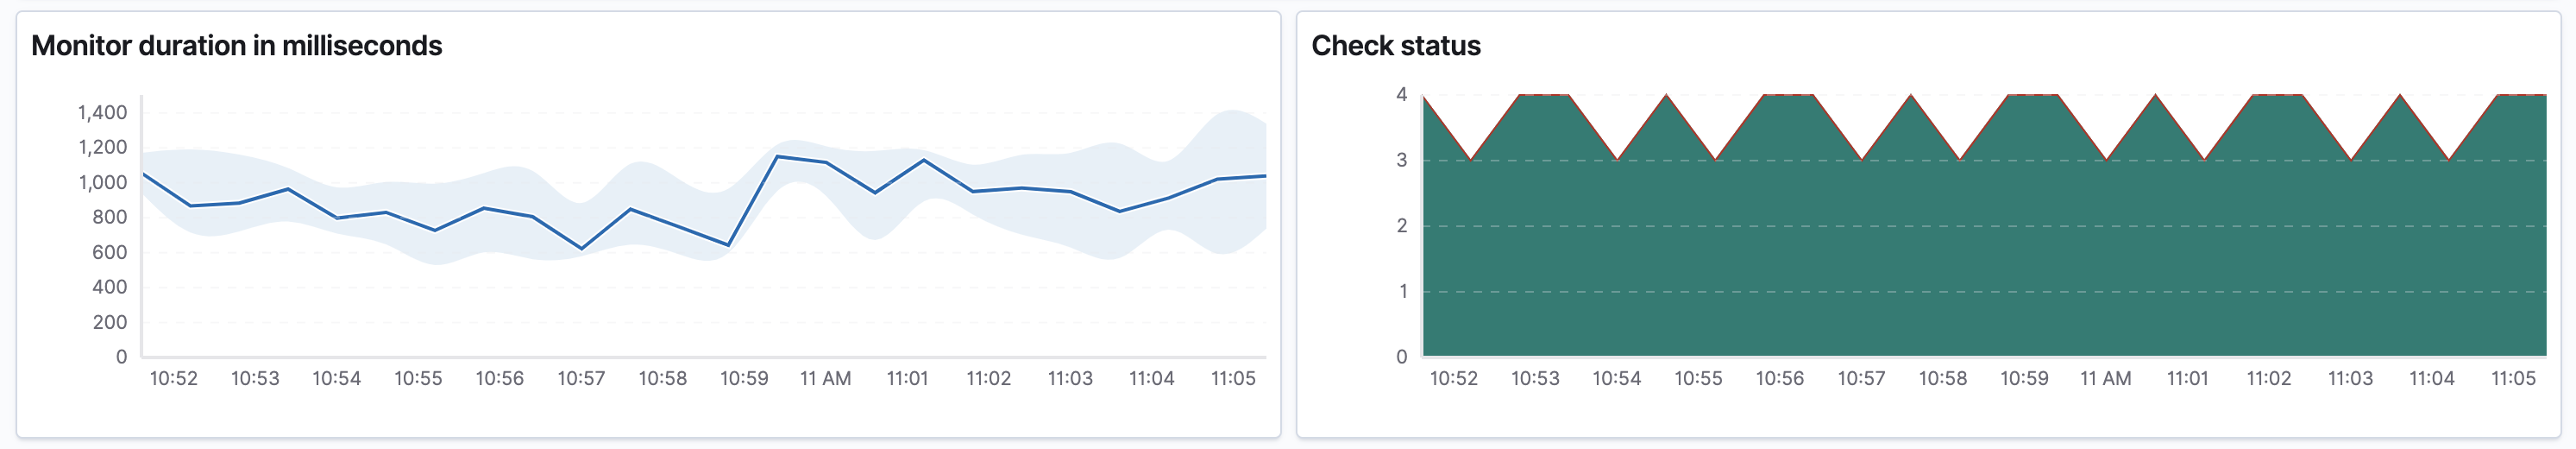
The Monitor charts visualize information over the time specified in the date range. These charts can help you gain insight into how quickly requests are being resolved by the targeted endpoint, and give you a sense of how frequently a host or endpoint was down in your selected timespan.
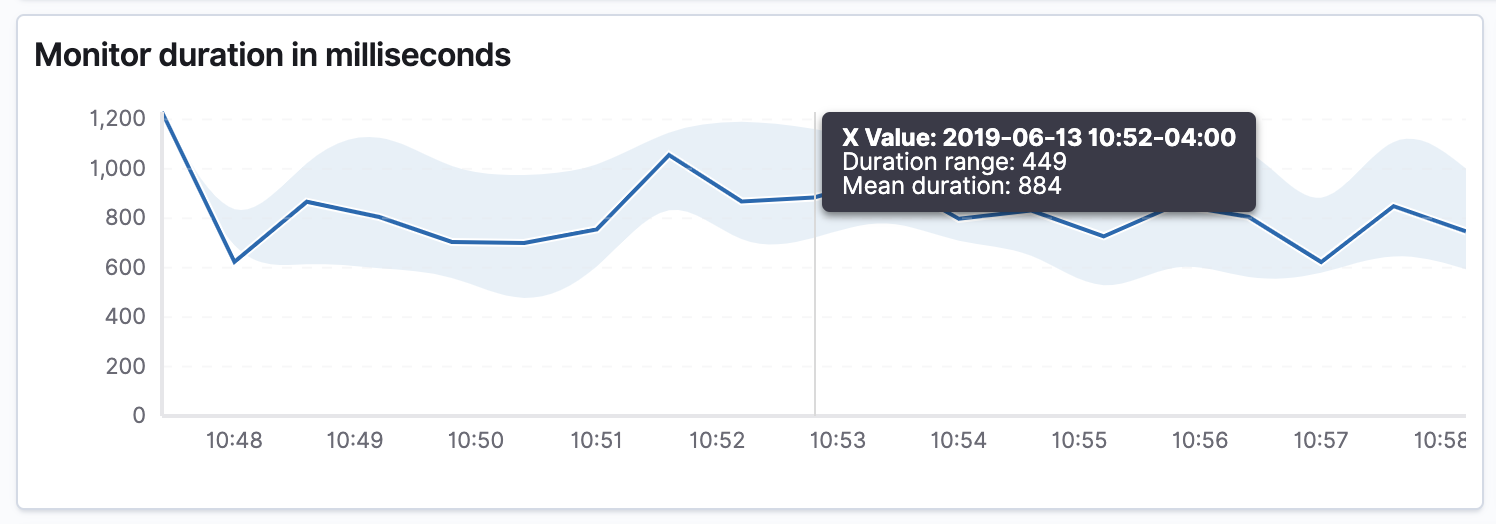
The first chart displays request duration information for your monitor. The area surrounding the line is the range of request time for the corresponding bucket. The line is the average time.
Next, is a graphical representation of the check statuses over time. Hover over the charts to display crosshairs with more specific numeric data.
Check history
edit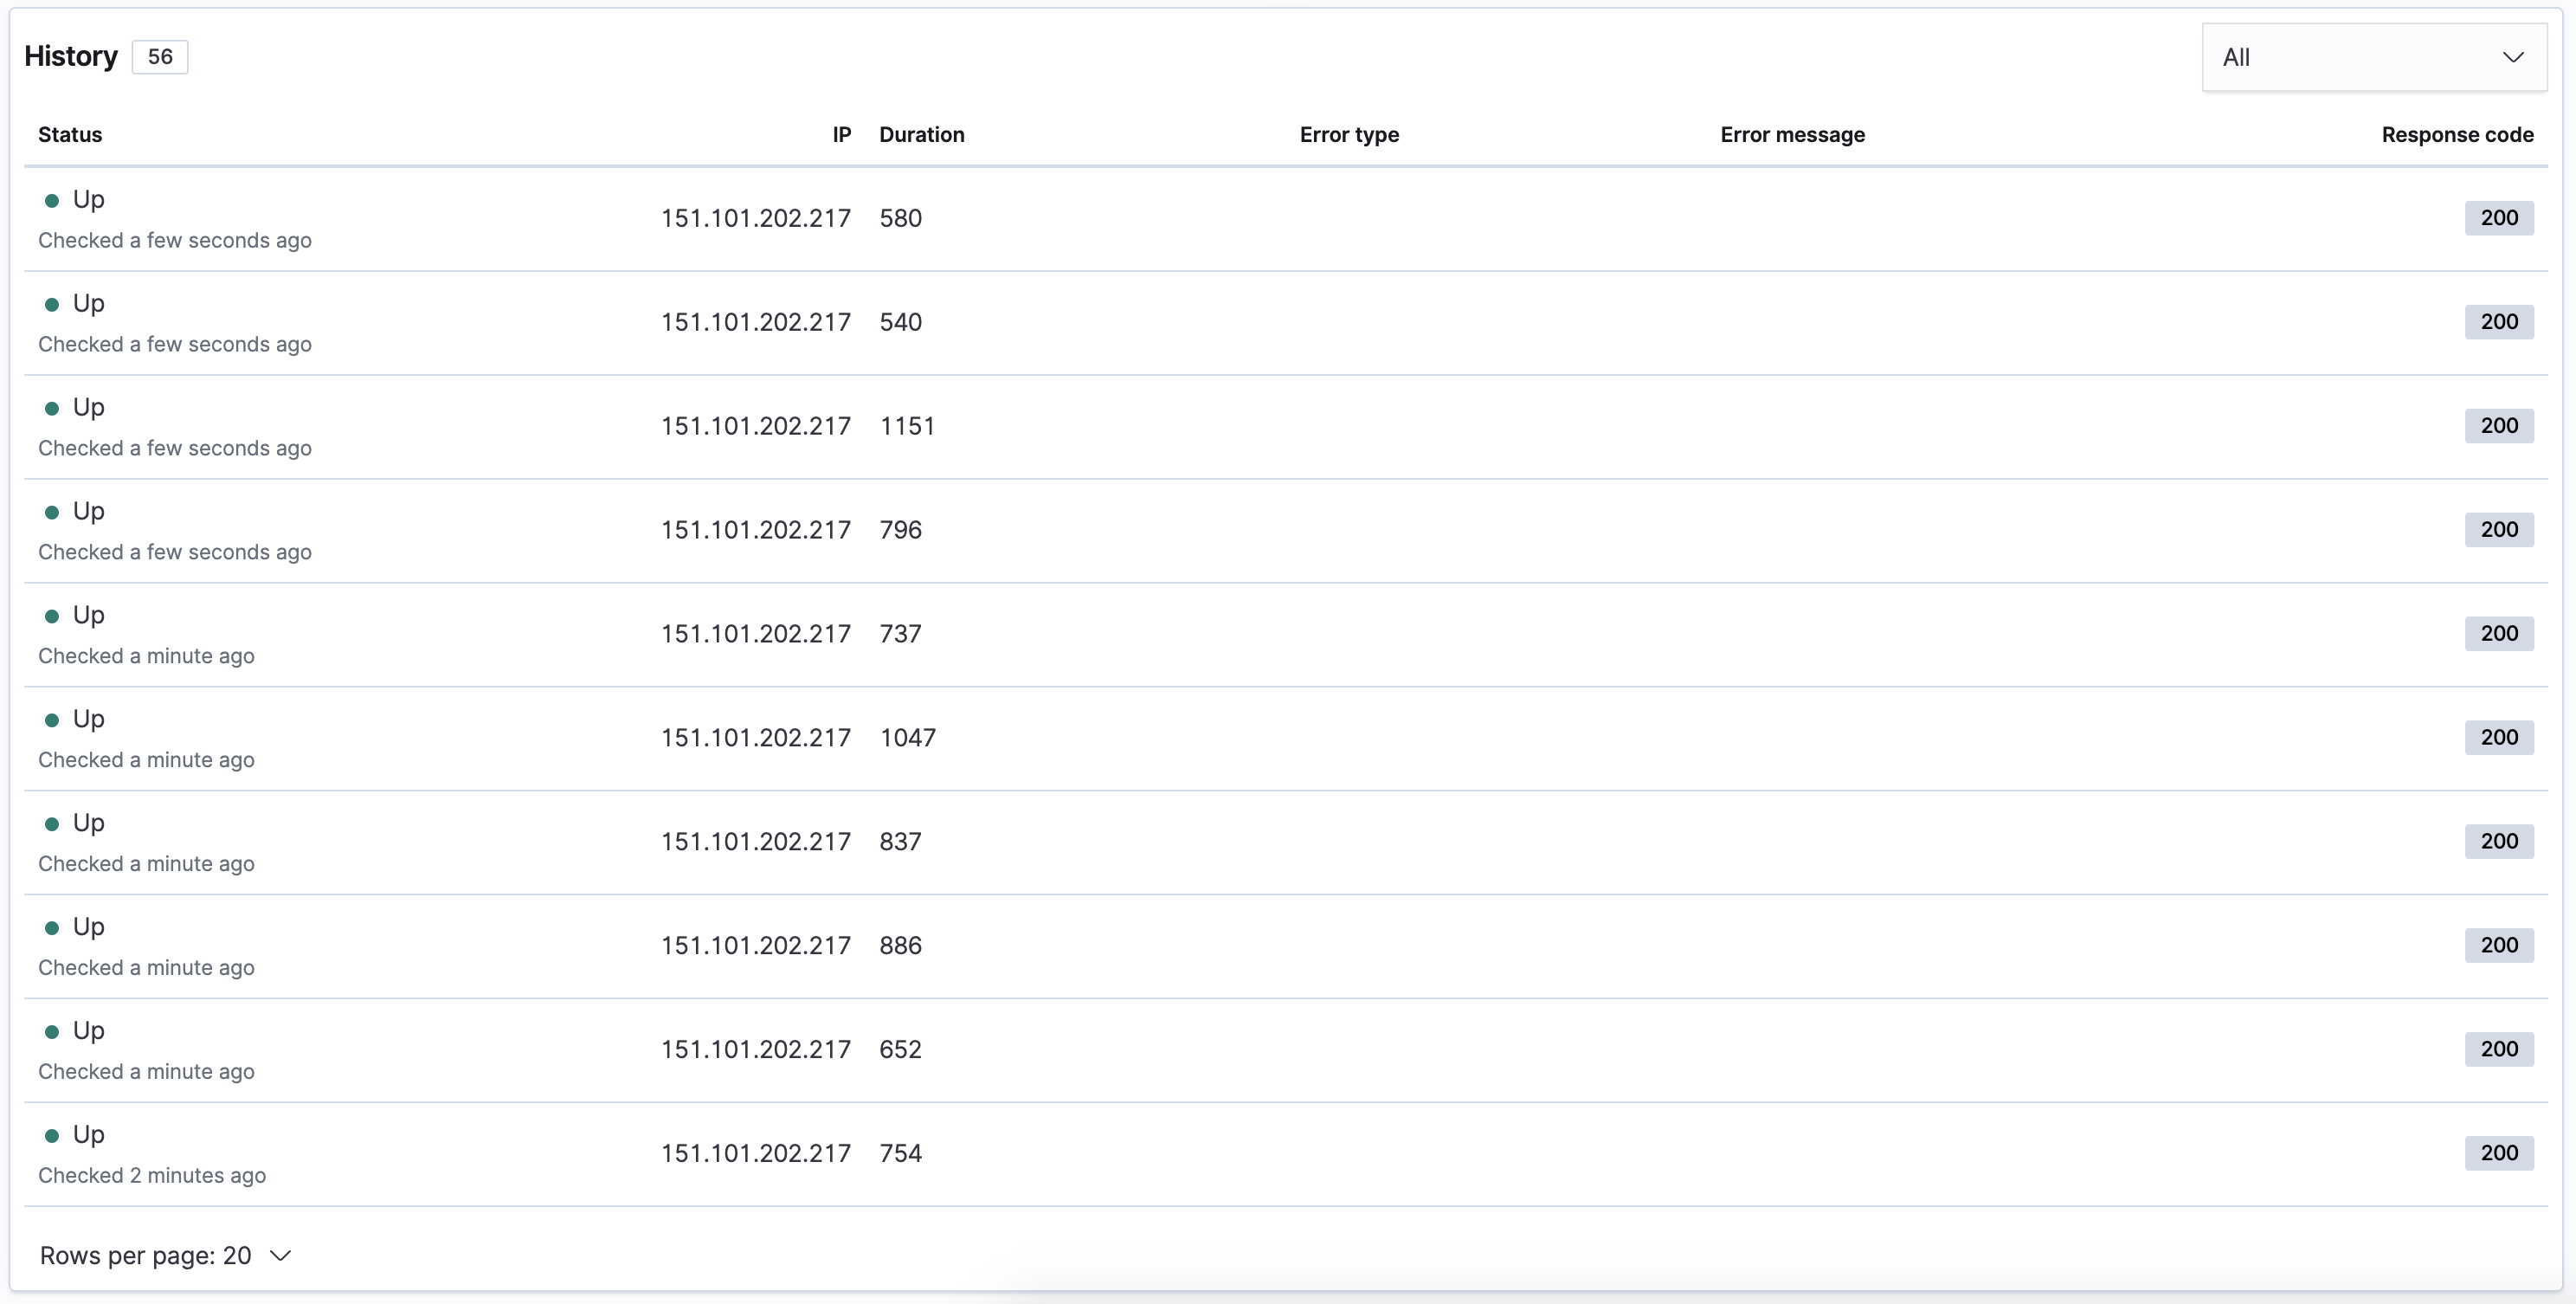
The Check history displays the total count of this monitor’s checks for the selected
date range. You can additionally filter the checks by status to help find recent problems
on a per-check basis. This table can help you gain some insight into more granular details
about recent individual data points Heartbeat is logging about your host or endpoint.