Explore Kibana using sample data
editExplore Kibana using sample data
editReady to get some hands-on experience with Kibana? In this tutorial, you’ll work with Kibana sample data and learn to:
If security is enabled, you must have read, write, and manage privileges
on the kibana_sample_data_* indices. See
Security privileges for more information.
Add sample data
editInstall the Flights sample data set, if you haven’t already.
- On the Kibana home page, click the link underneath Add sample data.
- On the Sample flight data card, click Add data.
-
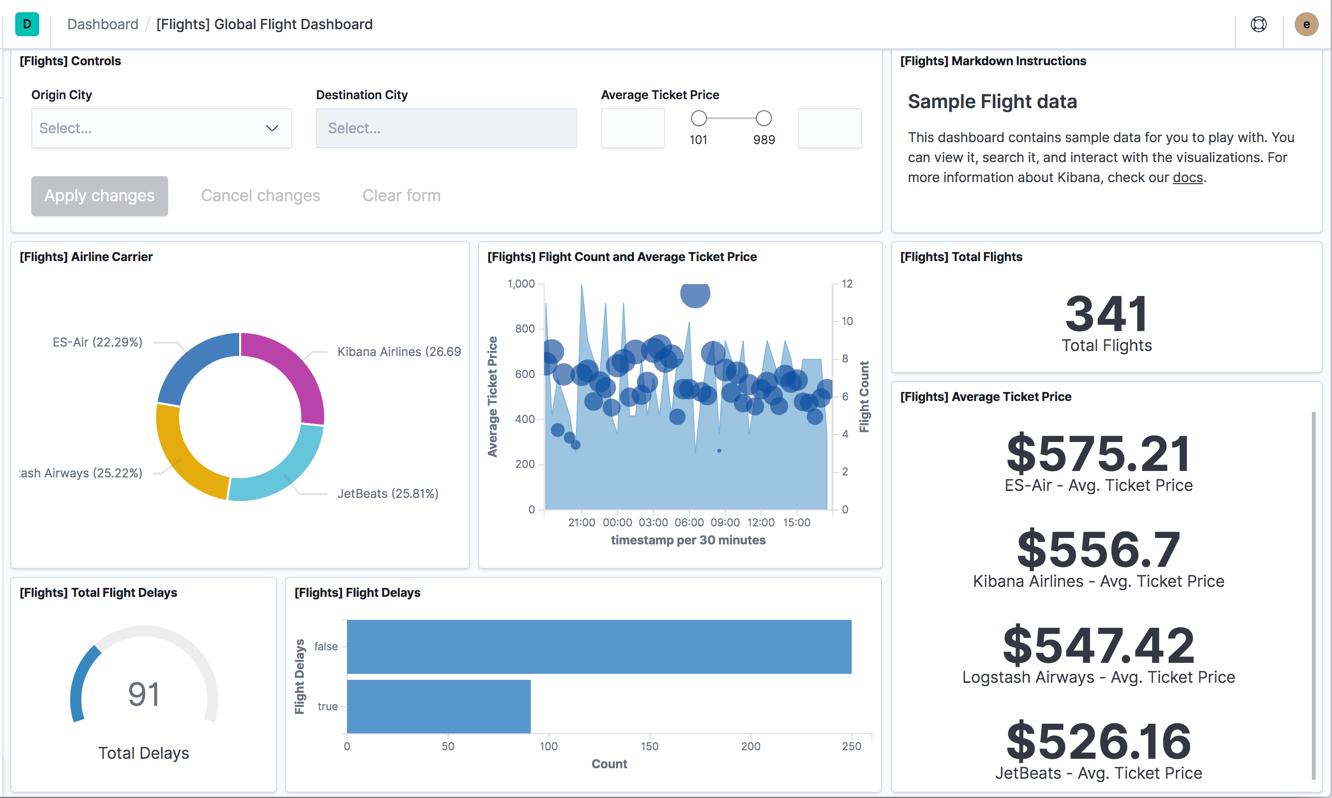
Once the data is added, click View data > Dashboard.
You’re taken to the Global Flight dashboard, a collection of charts, graphs, maps, and other visualizations of the the data in the
kibana_sample_data_flightsindex.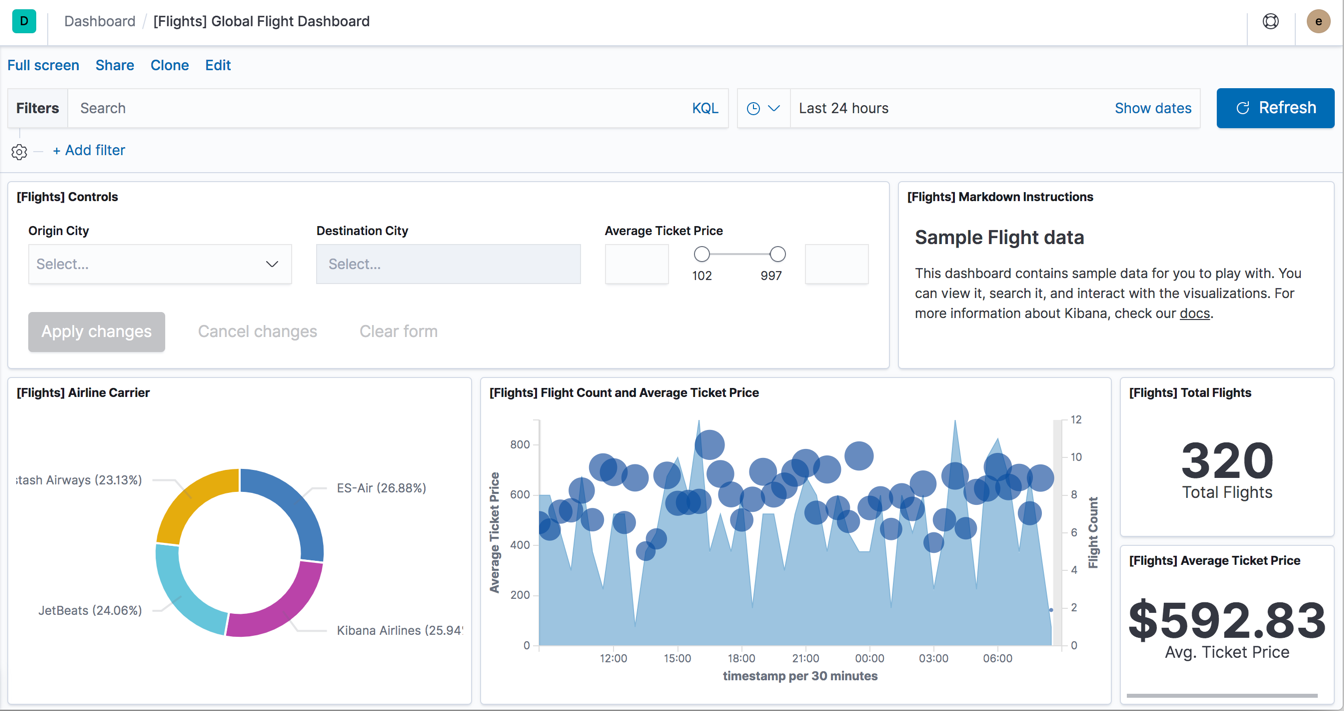
Filter and query the data
editYou can use filters and queries to narrow the view of the data. For more detailed information on these actions, see Query and filter context.
Filter the data
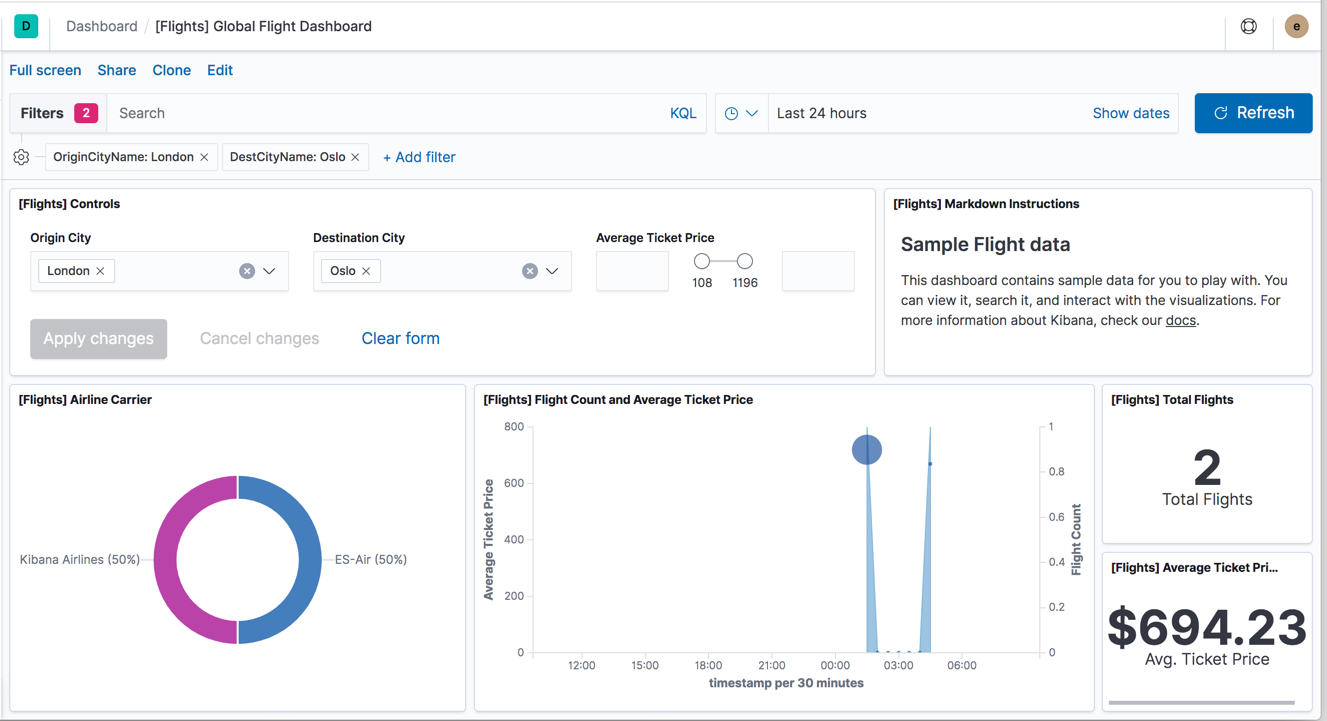
edit- In the Controls visualization, set an Origin City and a Destination City.
-
Click Apply changes.
The
OriginCityNameand theDestCityNamefields are filtered to match the data you specified.For example, this dashboard shows the data for flights from London to Oslo.
- To add a filter manually, click Add filter in the filter bar, and specify the data you want to view.
- When you are finished experimenting, remove all filters.
Query the data
edit-
To find all flights out of Rome, enter this query in the query bar and click Update:
OriginCityName:Rome
-
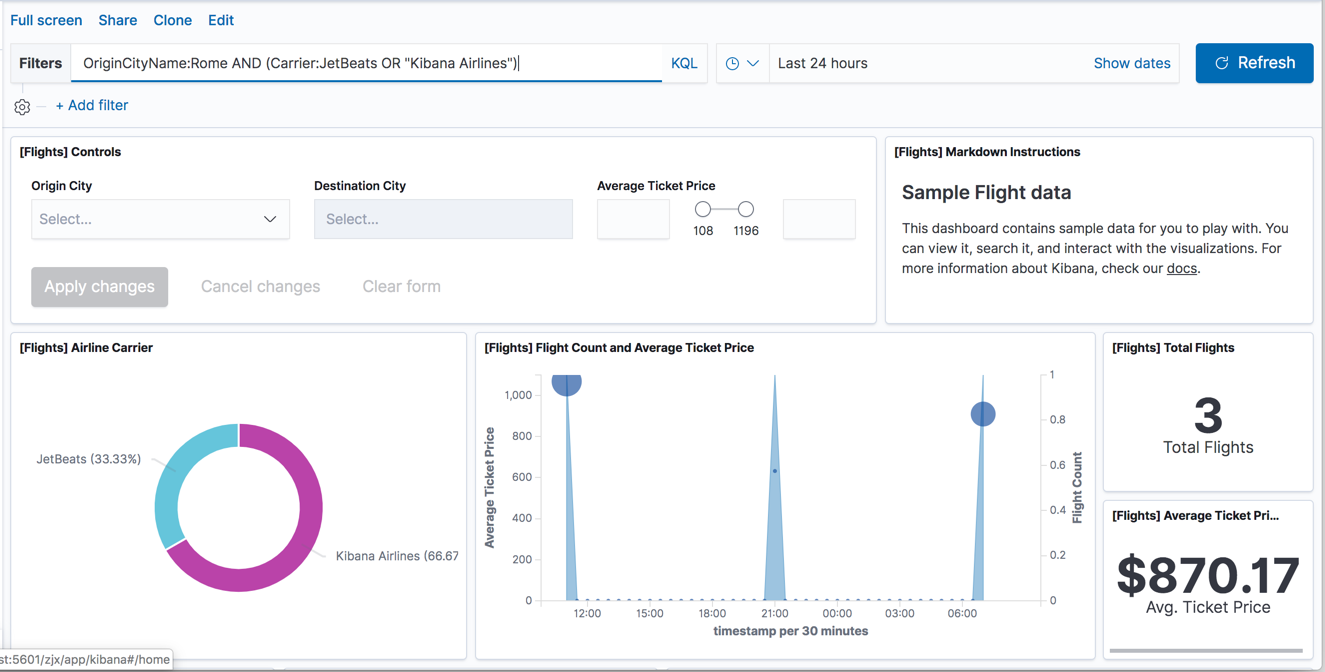
For a more complex query with AND and OR, try this:
OriginCityName:Rome AND (Carrier:JetBeats OR "Kibana Airlines")
The dashboard updates to show data for the flights out of Rome on JetBeats and Kibana Airlines.
- When you are finished exploring the dashboard, remove the query by clearing the contents in the query bar and clicking Update.
Discover the data
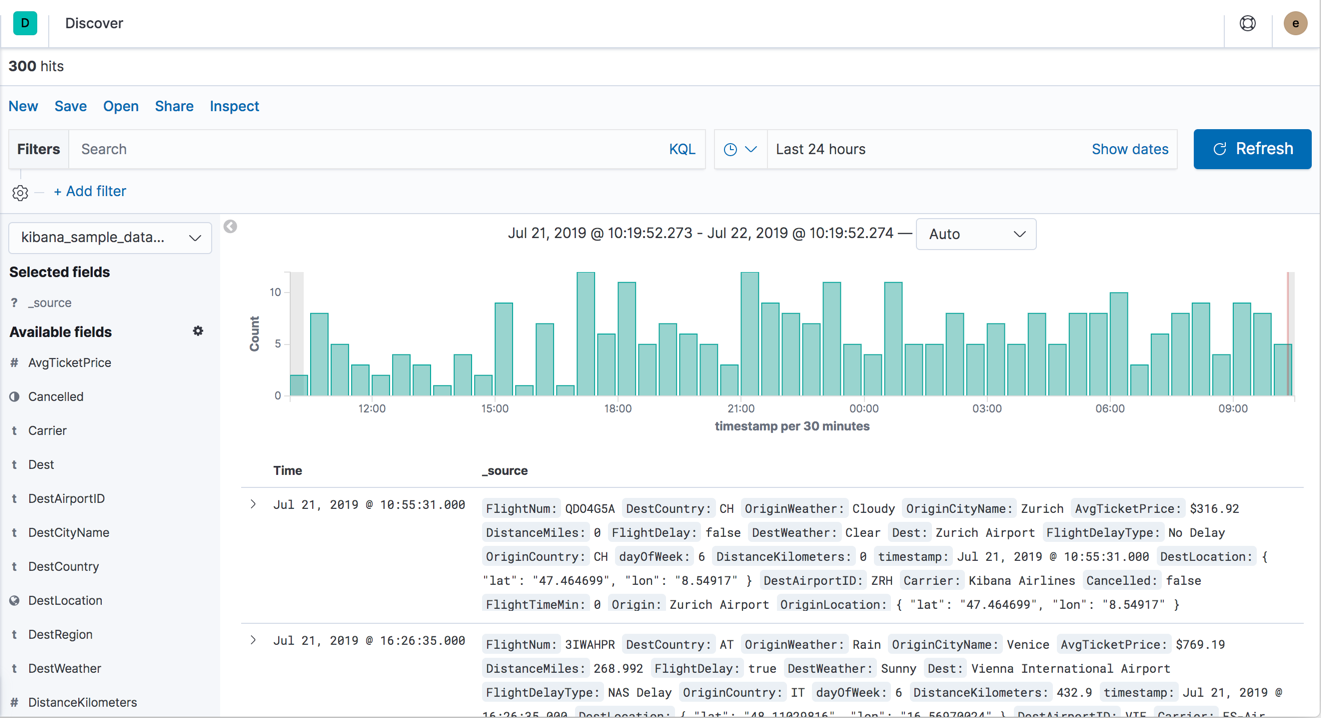
editIn Discover, you have access to every document in every index that matches the selected index pattern. The index pattern tells Kibana which Elasticsearch index you are currently exploring. You can submit search queries, filter the search results, and view document data.
- In the side navigation, click Discover.
-
Ensure
kibana_sample_data_flightsis the current index pattern. You might need to click New in the menu bar to refresh the data.You’ll see a histogram that shows the distribution of documents over time. A table lists the fields for each matching document. By default, all fields are shown.
-
To choose which fields to display, hover the pointer over the list of Available fields, and then click add next to each field you want include as a column in the table.
For example, if you add the
DestAirportIDandDestWeatherfields, the display includes columns for those two fields.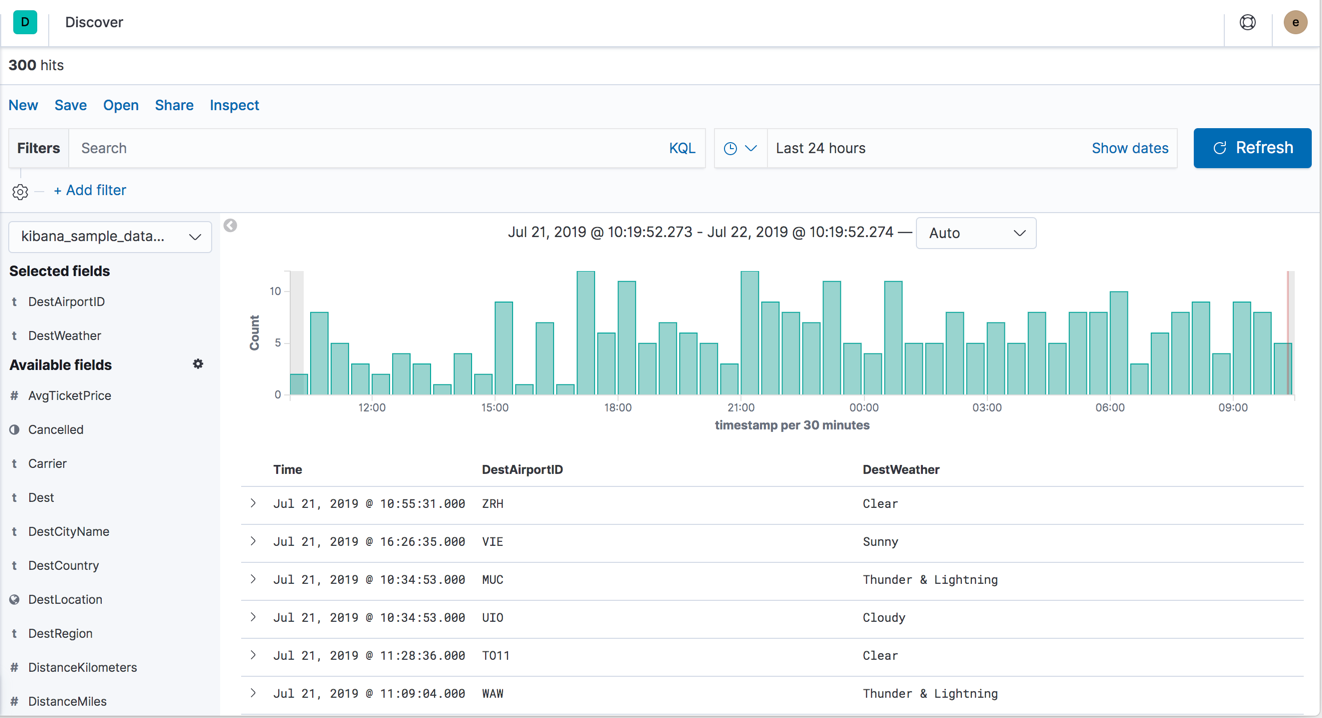
Edit a visualization
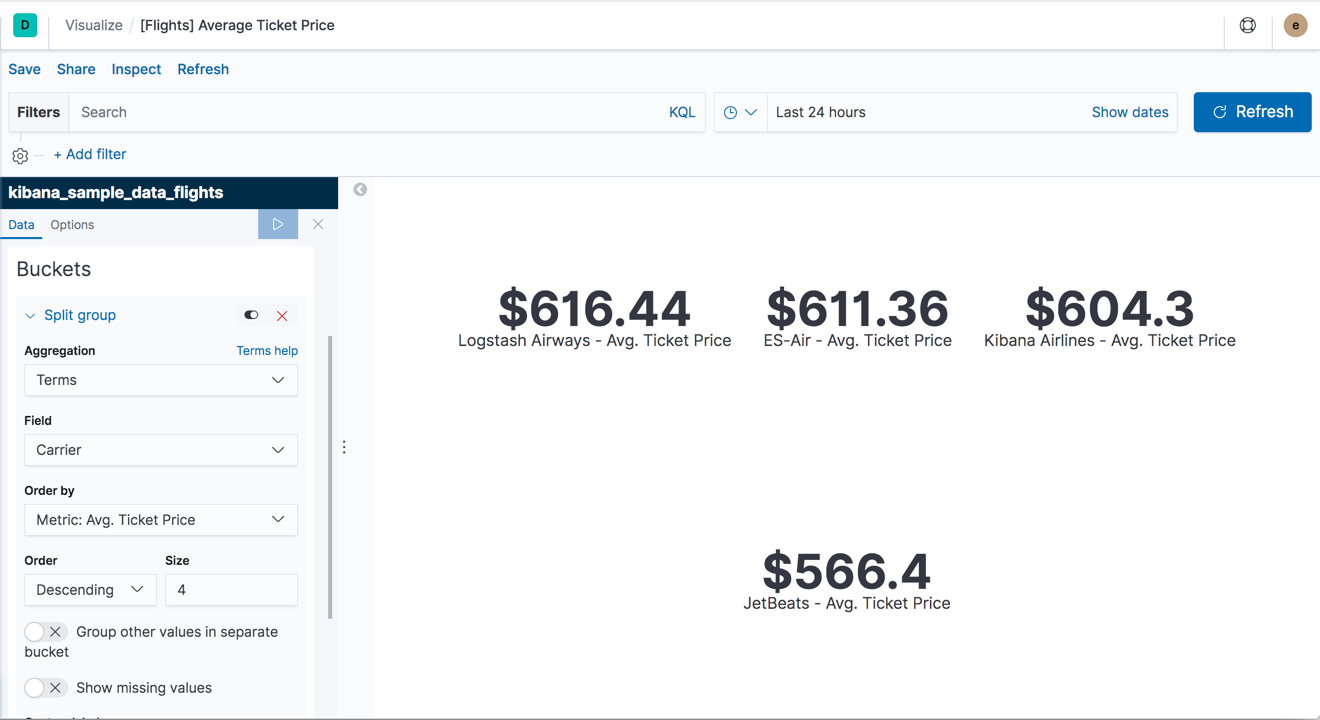
editYou have edit permissions for the Global Flight dashboard, so you can change the appearance and behavior of the visualizations. For example, you might want to see which airline has the lowest average fares.
- In the side navigation, click Recently viewed and open the Global Flight Dashboard.
- In the menu bar, click Edit.
- In the Average Ticket Price visualization, click the gear icon in the upper right.
-
From the Options menu, select Edit visualization.
Average Ticket Price is a metric visualization. To specify which groups to display in this visualization, you use an Elasticsearch bucket aggregation. This aggregation sorts the documents that match your search criteria into different categories, or buckets.
Create a bucket aggregation
edit- In the Buckets pane, select Add > Split group.
- In the Aggregation dropdown, select Terms.
- In the Field dropdown, select Carrier.
- Set Descending to 4.
-
Click Apply changes
 .
.You now see the average ticket price for all four airlines.
Save the visualization
edit- In the menu bar, click Save.
- Leave the visualization name as is and confirm the save.
- Go to the Global Flight dashboard and scroll the Average Ticket Price visualization to see the four prices.
-
Optionally, edit the dashboard. Resize the panel for the Average Ticket Price visualization by dragging the handle in the lower right. You can also rearrange the visualizations by clicking the header and dragging. Be sure to save the dashboard.
Inspect the data
editSeeing visualizations of your data is great, but sometimes you need to look at the actual data to understand what’s really going on. You can inspect the data behind any visualization and view the Elasticsearch query used to retrieve it.
- In the dashboard, hover the pointer over the pie chart, and then click the icon in the upper right.
-
From the Options menu, select Inspect.
The initial view shows the document count.
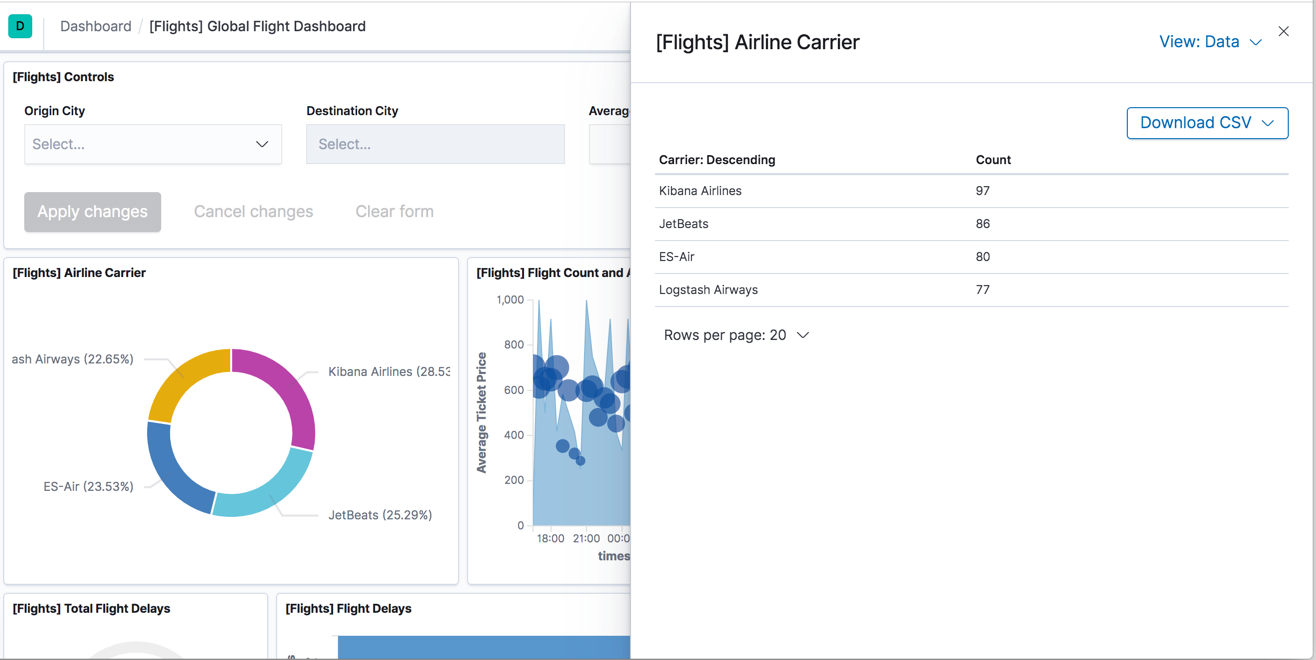
- To look at the query used to fetch the data for the visualization, select View > Requests in the upper right of the Inspect pane.
Remove the sample data set
editWhen you’re done experimenting with the sample data set, you can remove it.
- Go to the Sample data page.
- On the Sample flight data card, click Remove.
Next steps
editNow that you have a handle on the Kibana basics, you might be interested in the tutorial Build your own dashboard, where you’ll learn to:
- Load data
- Define an index pattern
- Discover and explore data
- Create visualizations
- Add visualizations to a dashboard