Overview
editOverview
editThe Uptime overview is intended to help you quickly identify and diagnose outages and other connectivity issues within your network or environment. There is a date range selection that is global to the Uptime UI; you can use this selection to highlight an absolute date range, or a relative one, similar to other areas of Kibana.
Filter bar
edit
The filter bar is designed to let you quickly view specific groups of monitors, or even an individual monitor, if you have defined many.
This control allows you to use automated filter options, as well as input custom filter text to select specific monitors by field, URL, ID, and other attributes.
Snapshot view
edit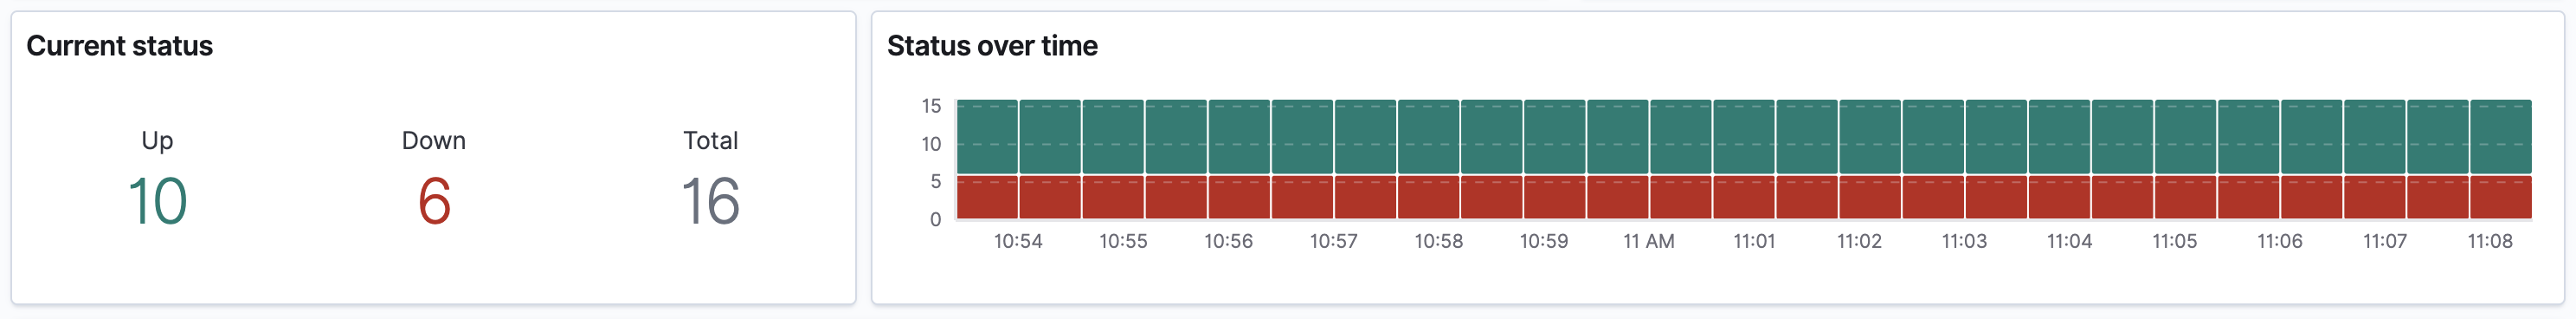
This view is intended to quickly give you a sense of the overall
status of the environment you’re monitoring, or a subset of those monitors.
Here, you can see the total number of detected monitors within the selected
Uptime date range. In addition to the total, the counts for the number of monitors
in an up or down state are displayed, based on the last check reported by Heartbeat
for each monitor.
Next to the counts, there is a histogram displaying the change over time throughout the selected date range.
Monitor list
edit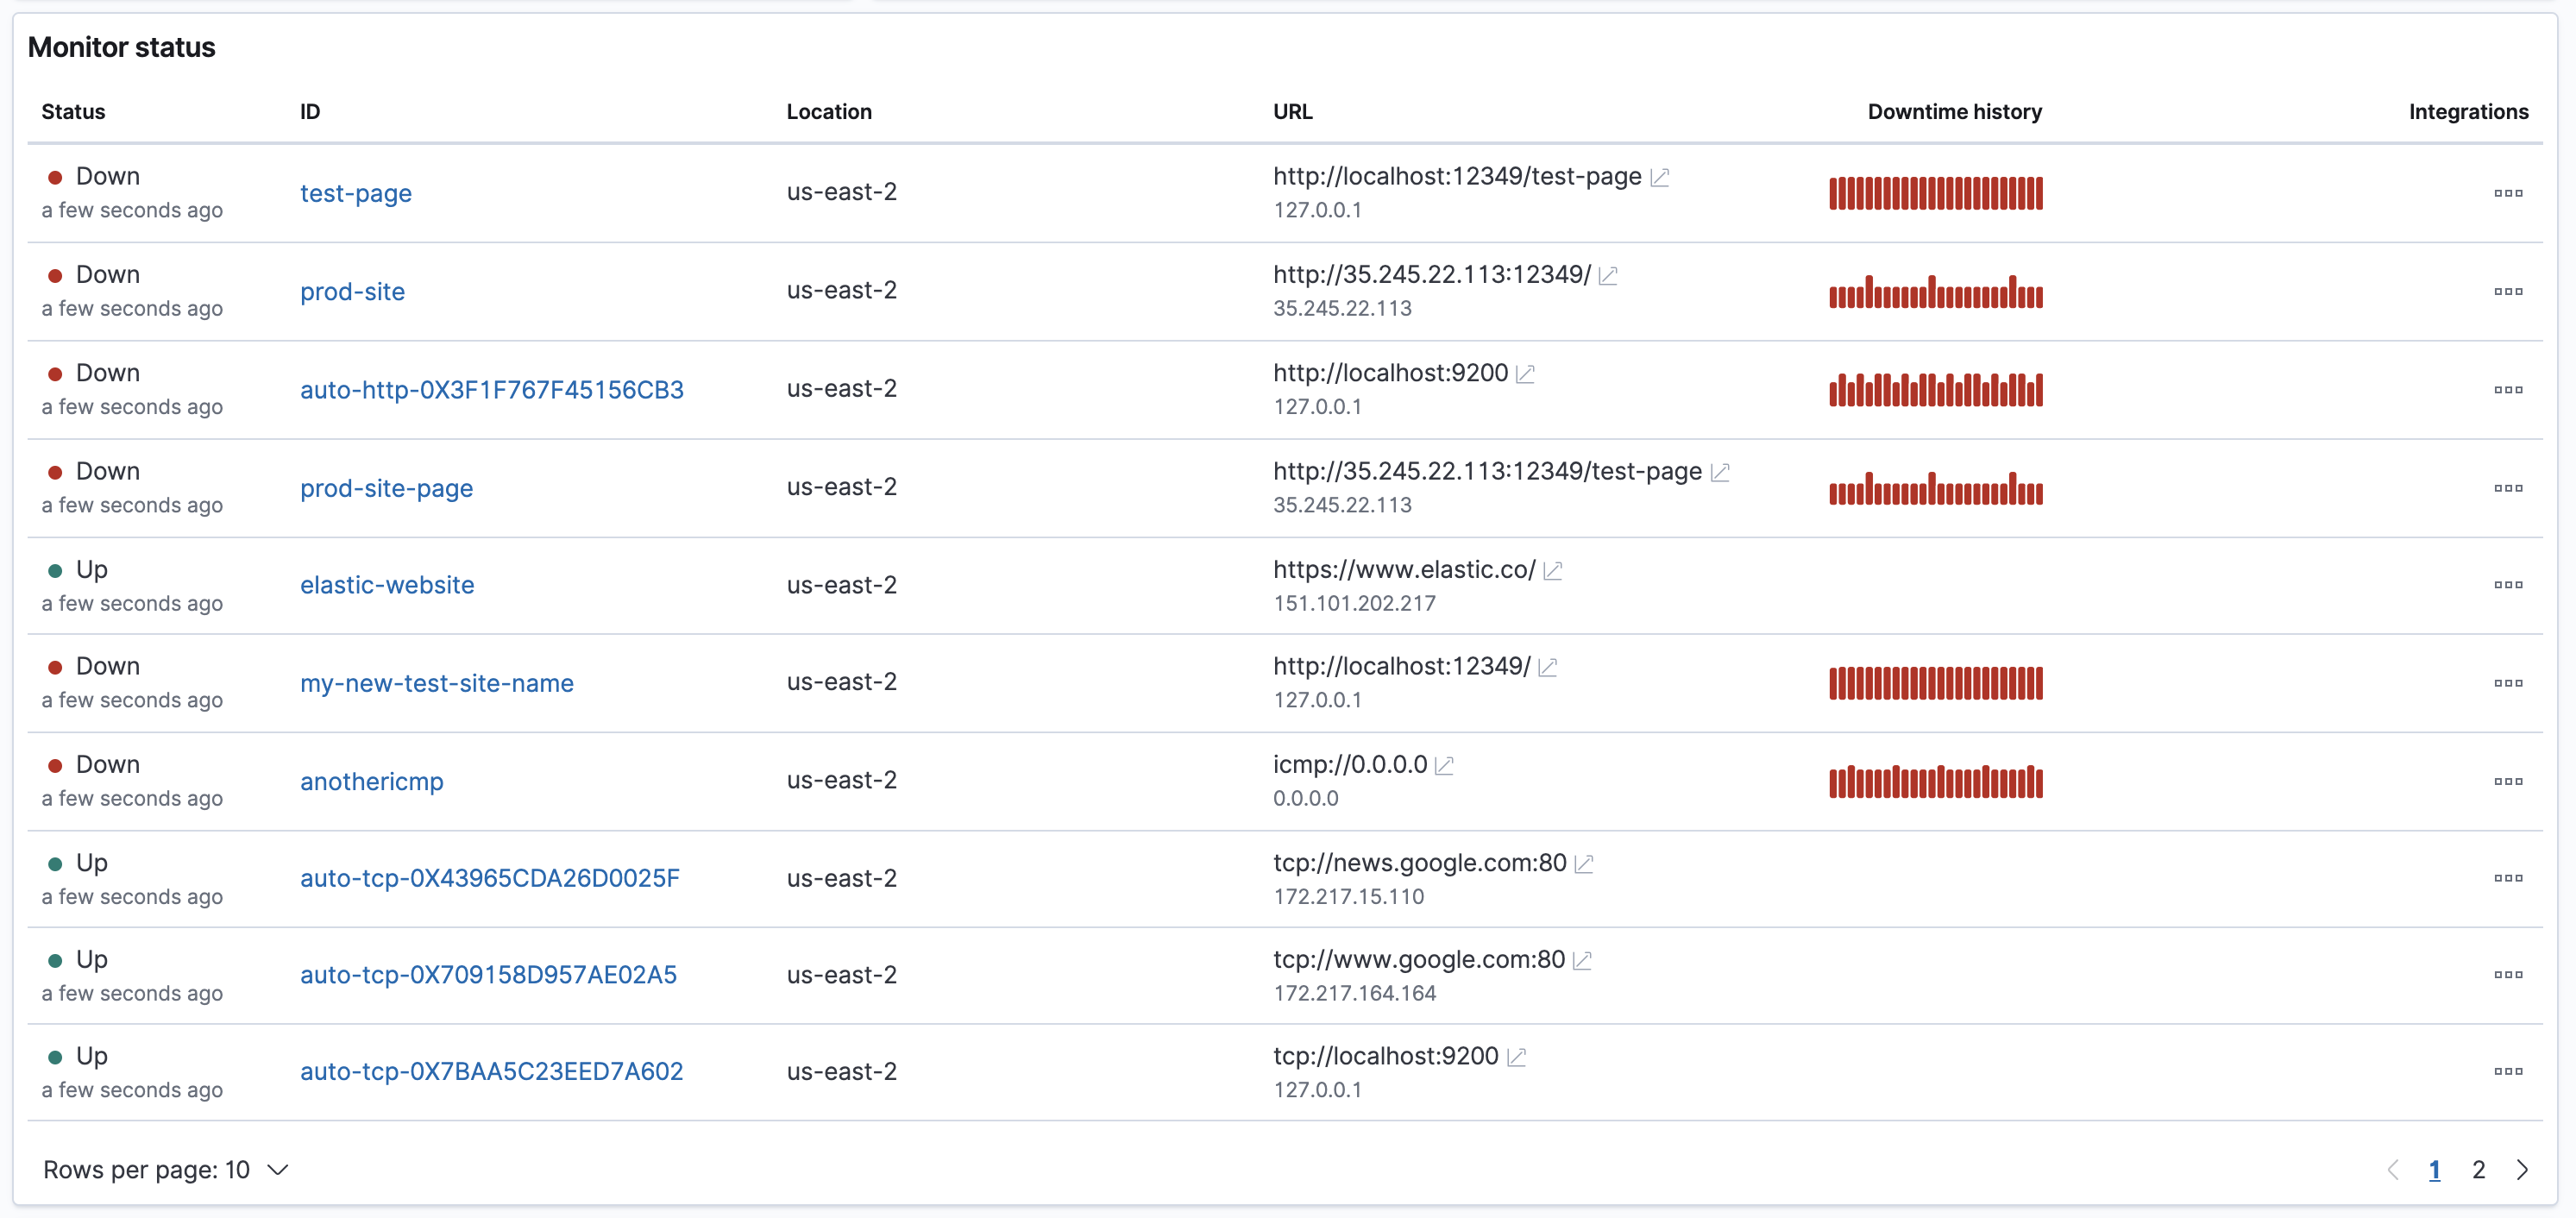
The Monitor list displays information at the level of individual monitors. The data shown here will flesh out your individual monitors, and provide a quick way to navigate to a more in-depth visualization for interesting hosts or endpoints.
This table includes information like the most recent status, when the monitor was last checked, its ID and URL, its IP address, and a dedicated sparkline showing its check status over time.
Observability integrations
edit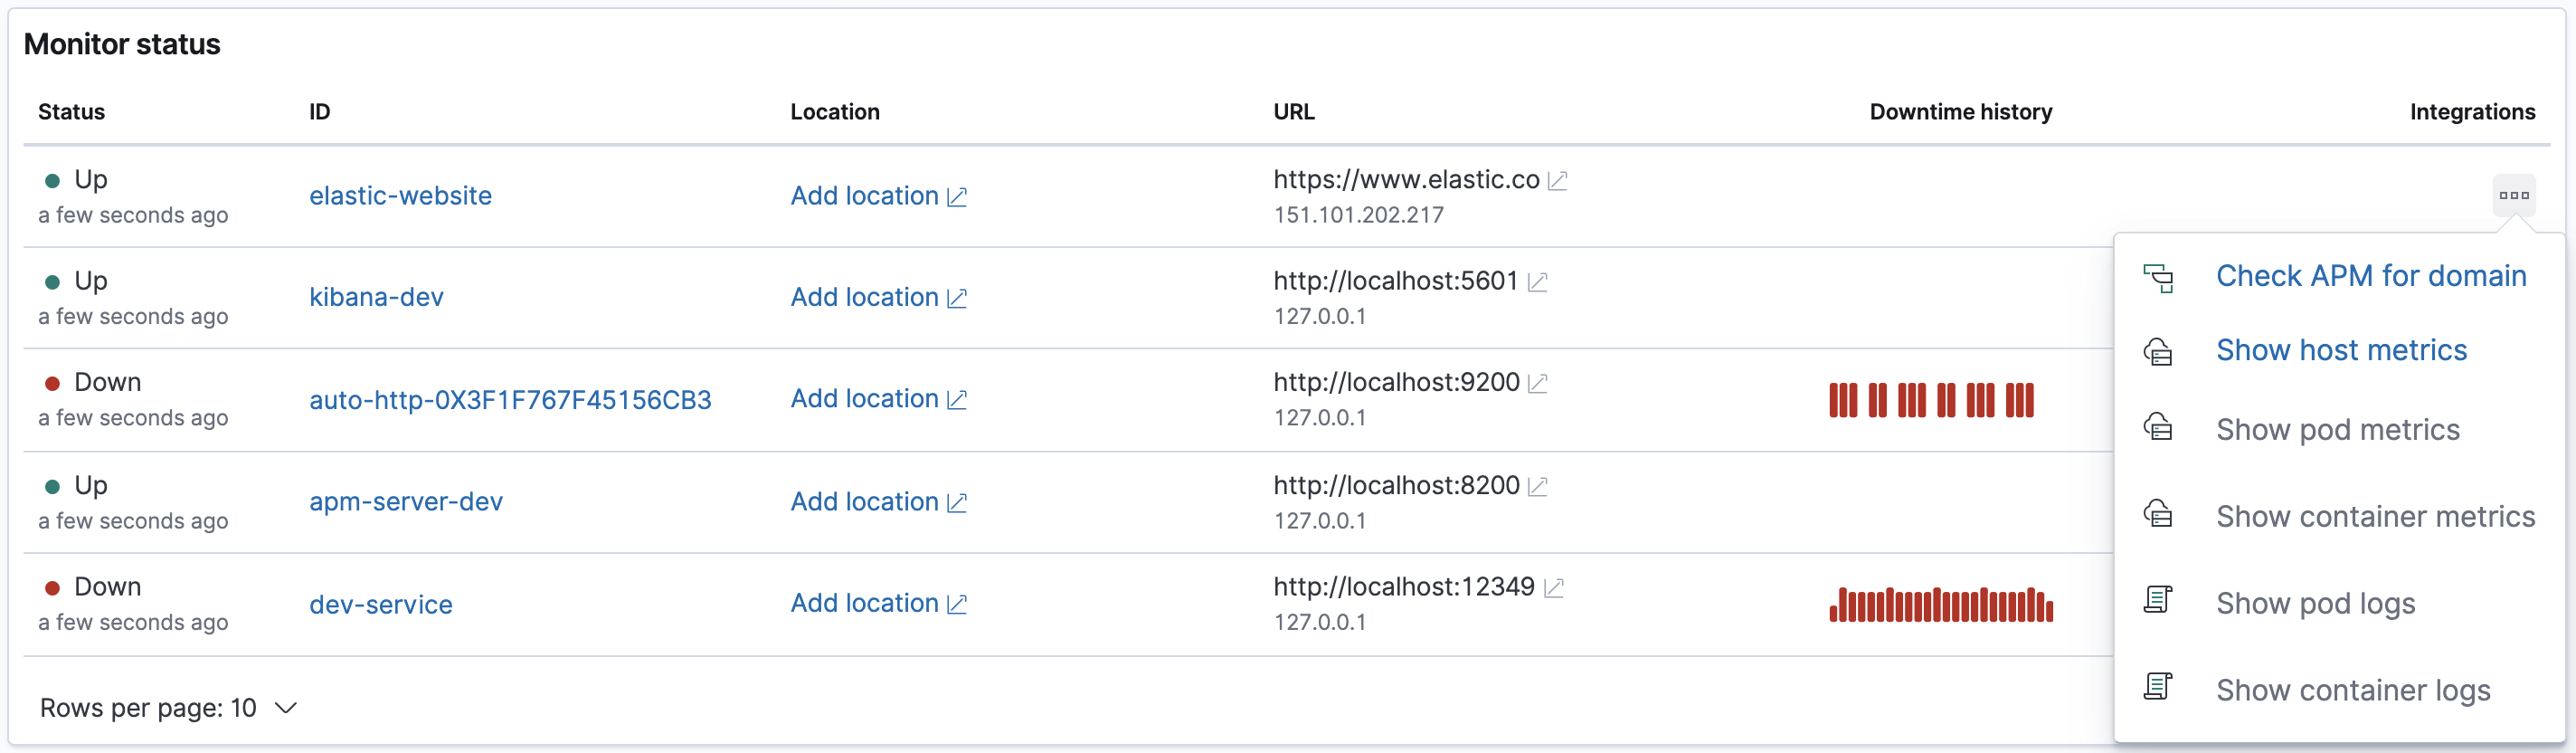
The Monitor list also contains a menu of possible integrations. If Uptime detects Kubernetes or Docker related host information, it will provide links to open the Infrastructure UI or Logs UI pre-filtered for this host. Additionally, this feature supplies links to simply filter the other views on the host’s IP address, to help you quickly determine if these other solutions contain data relevant to your current interest.
Error list
edit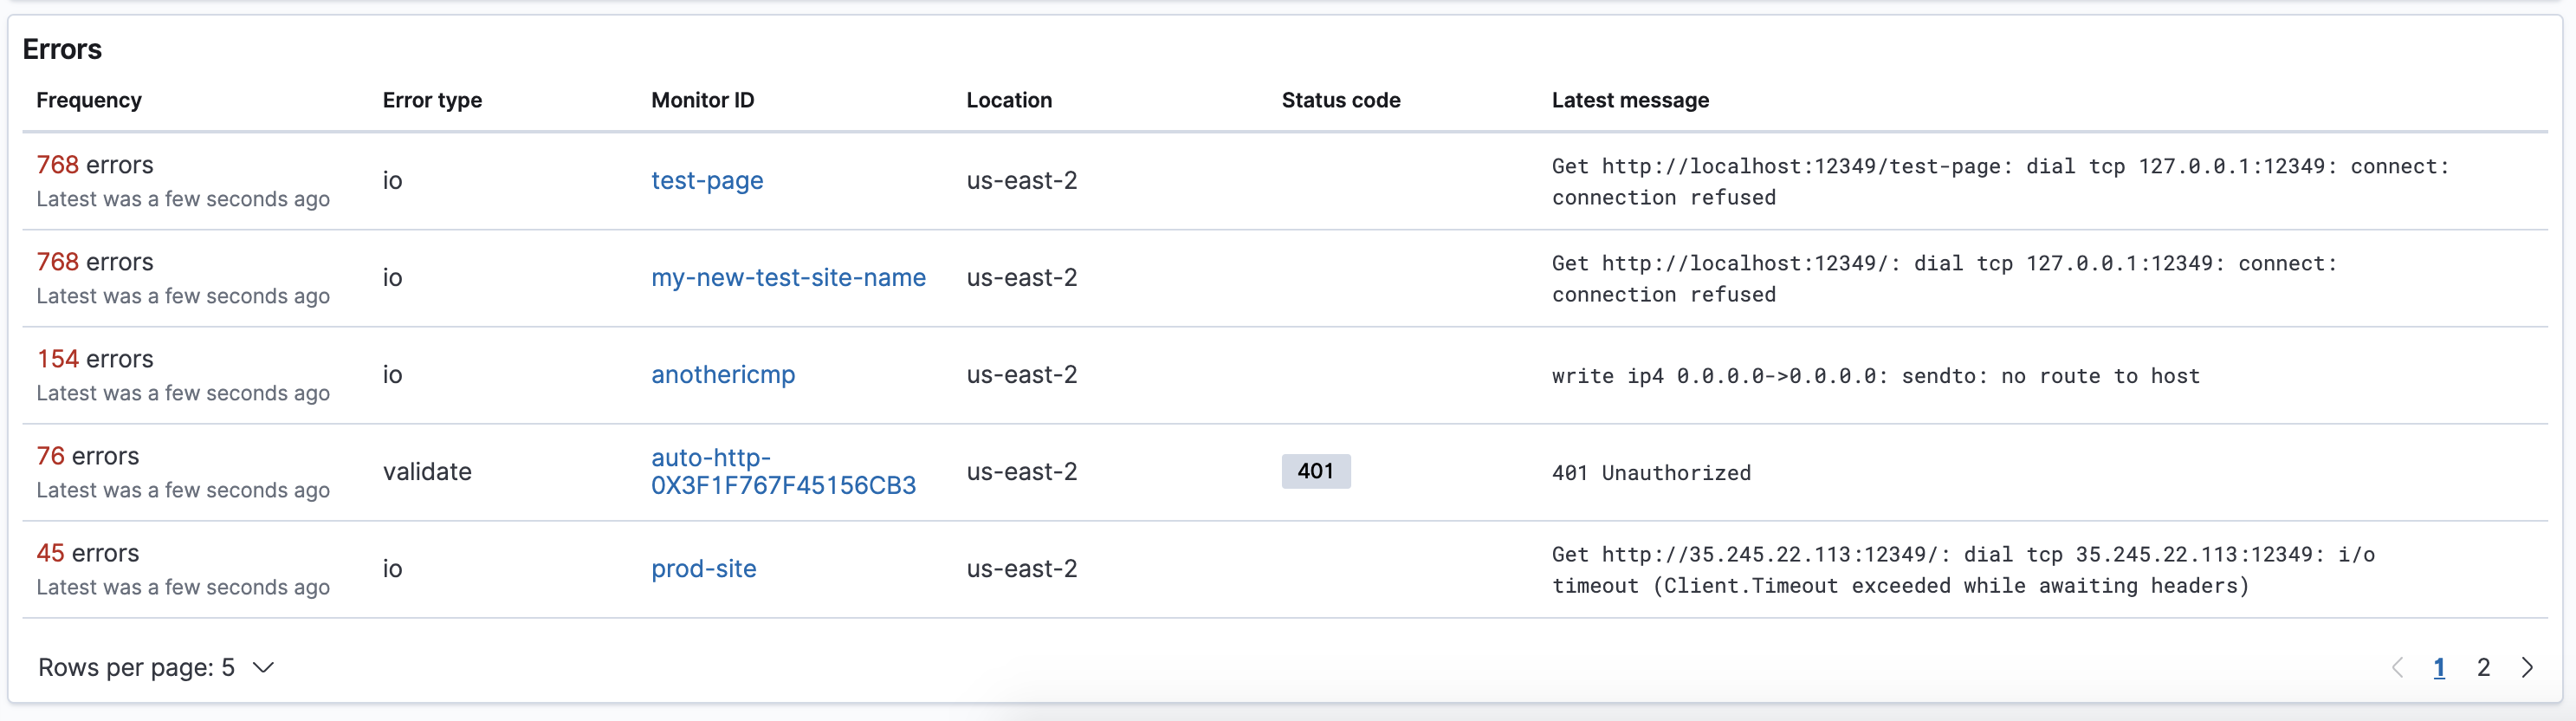
The Error list displays aggregations of errors that Heartbeat has logged. Errors are displayed by Error type, monitor ID, and message. Clicking a monitor’s ID will take you to the corresponding Monitor view, which can provide you richer information about the individual data points that are resulting in the displayed errors.