Errors overview
editErrors overview
editErrors are defined as groups of exceptions with matching exception or log messages.
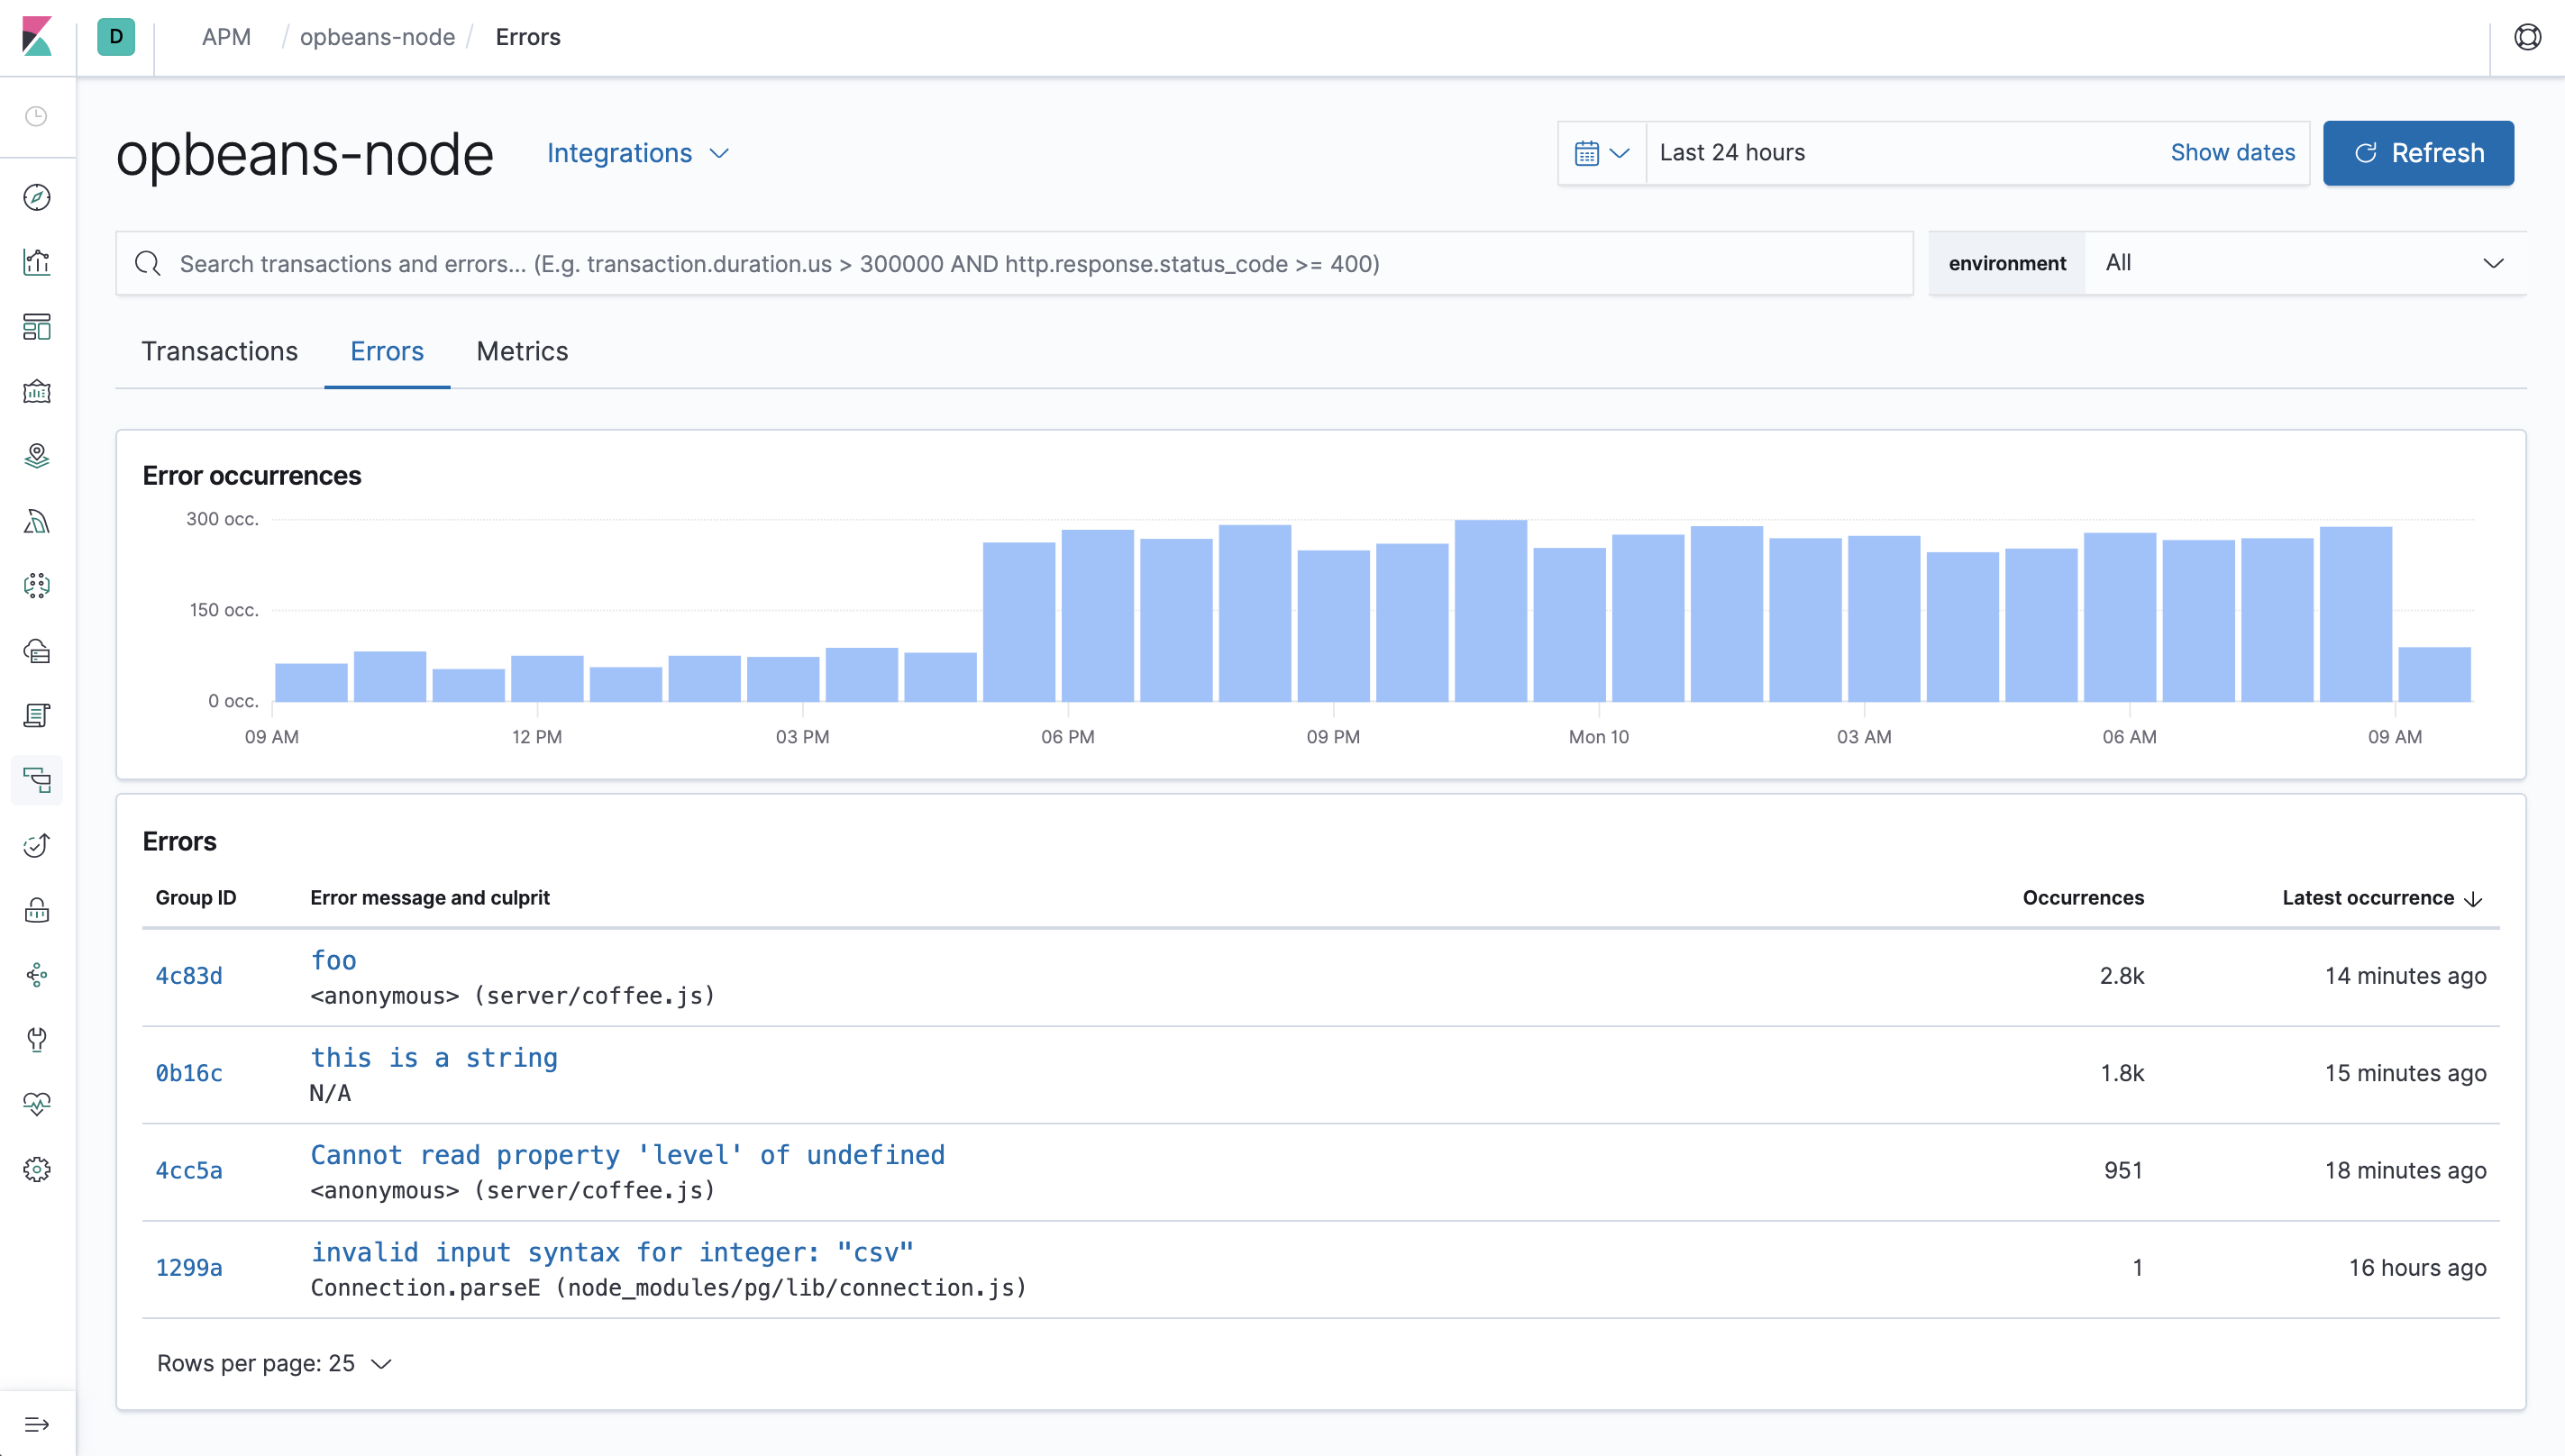
The Errors overview provides a high-level view of the error message and culprit, the number of occurrences, and the most recent occurrence. Just like the transaction overview, you’ll notice we group together like errors. This makes it very easy to quickly see which errors are affecting your services, and to take actions to rectify them.
Selecting an error group ID or error message brings you to the Error group.
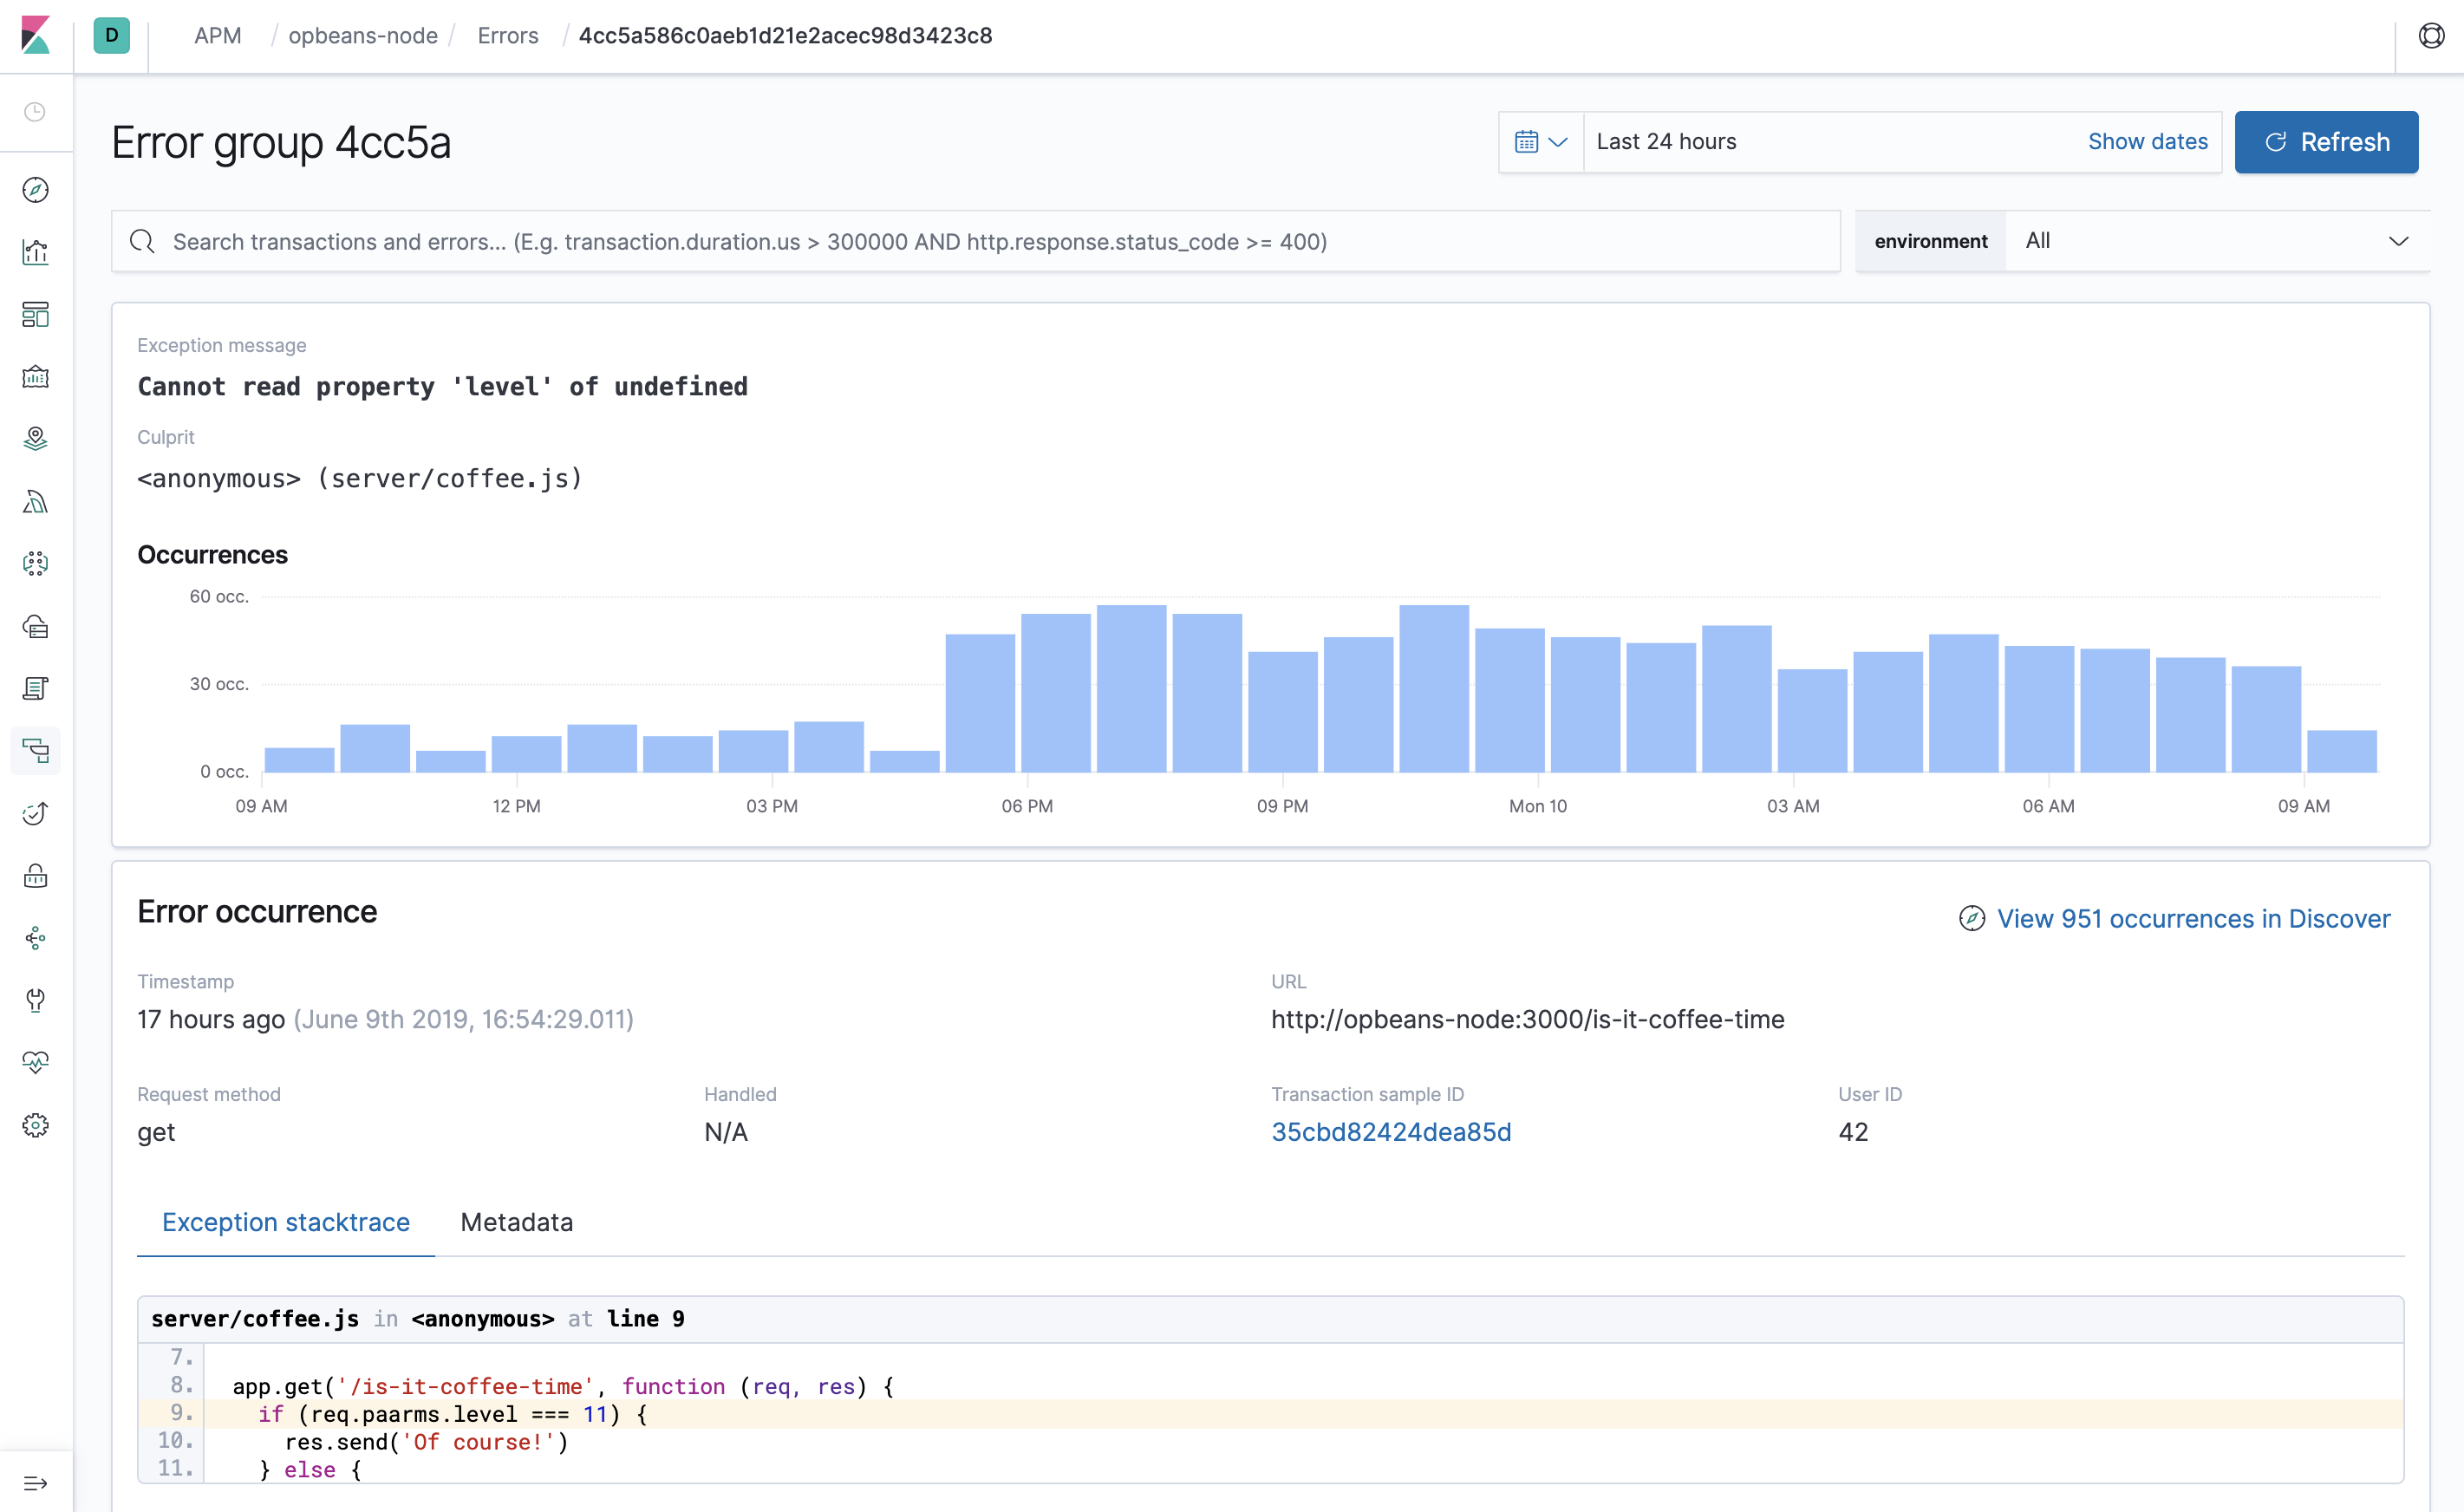
Here, you’ll see the error message, culprit, and the number of occurrences over time.
Further down, you’ll see the Error occurrence table. This is where you can see the details of a sampled error within this group. The error shown is always the most recent to occur.
Each error occurrence features a breakdown of the exception, including the stack trace from when the error occurred, and additional contextual information to help debug the issue. In some cases, you might also see a Transaction sample ID. This feature allows you to make a connection between the errors and transactions, by linking you to the specific transaction where the error occurred. This allows you to see the whole trace, including which services the request went through.
Error reports with Watcher
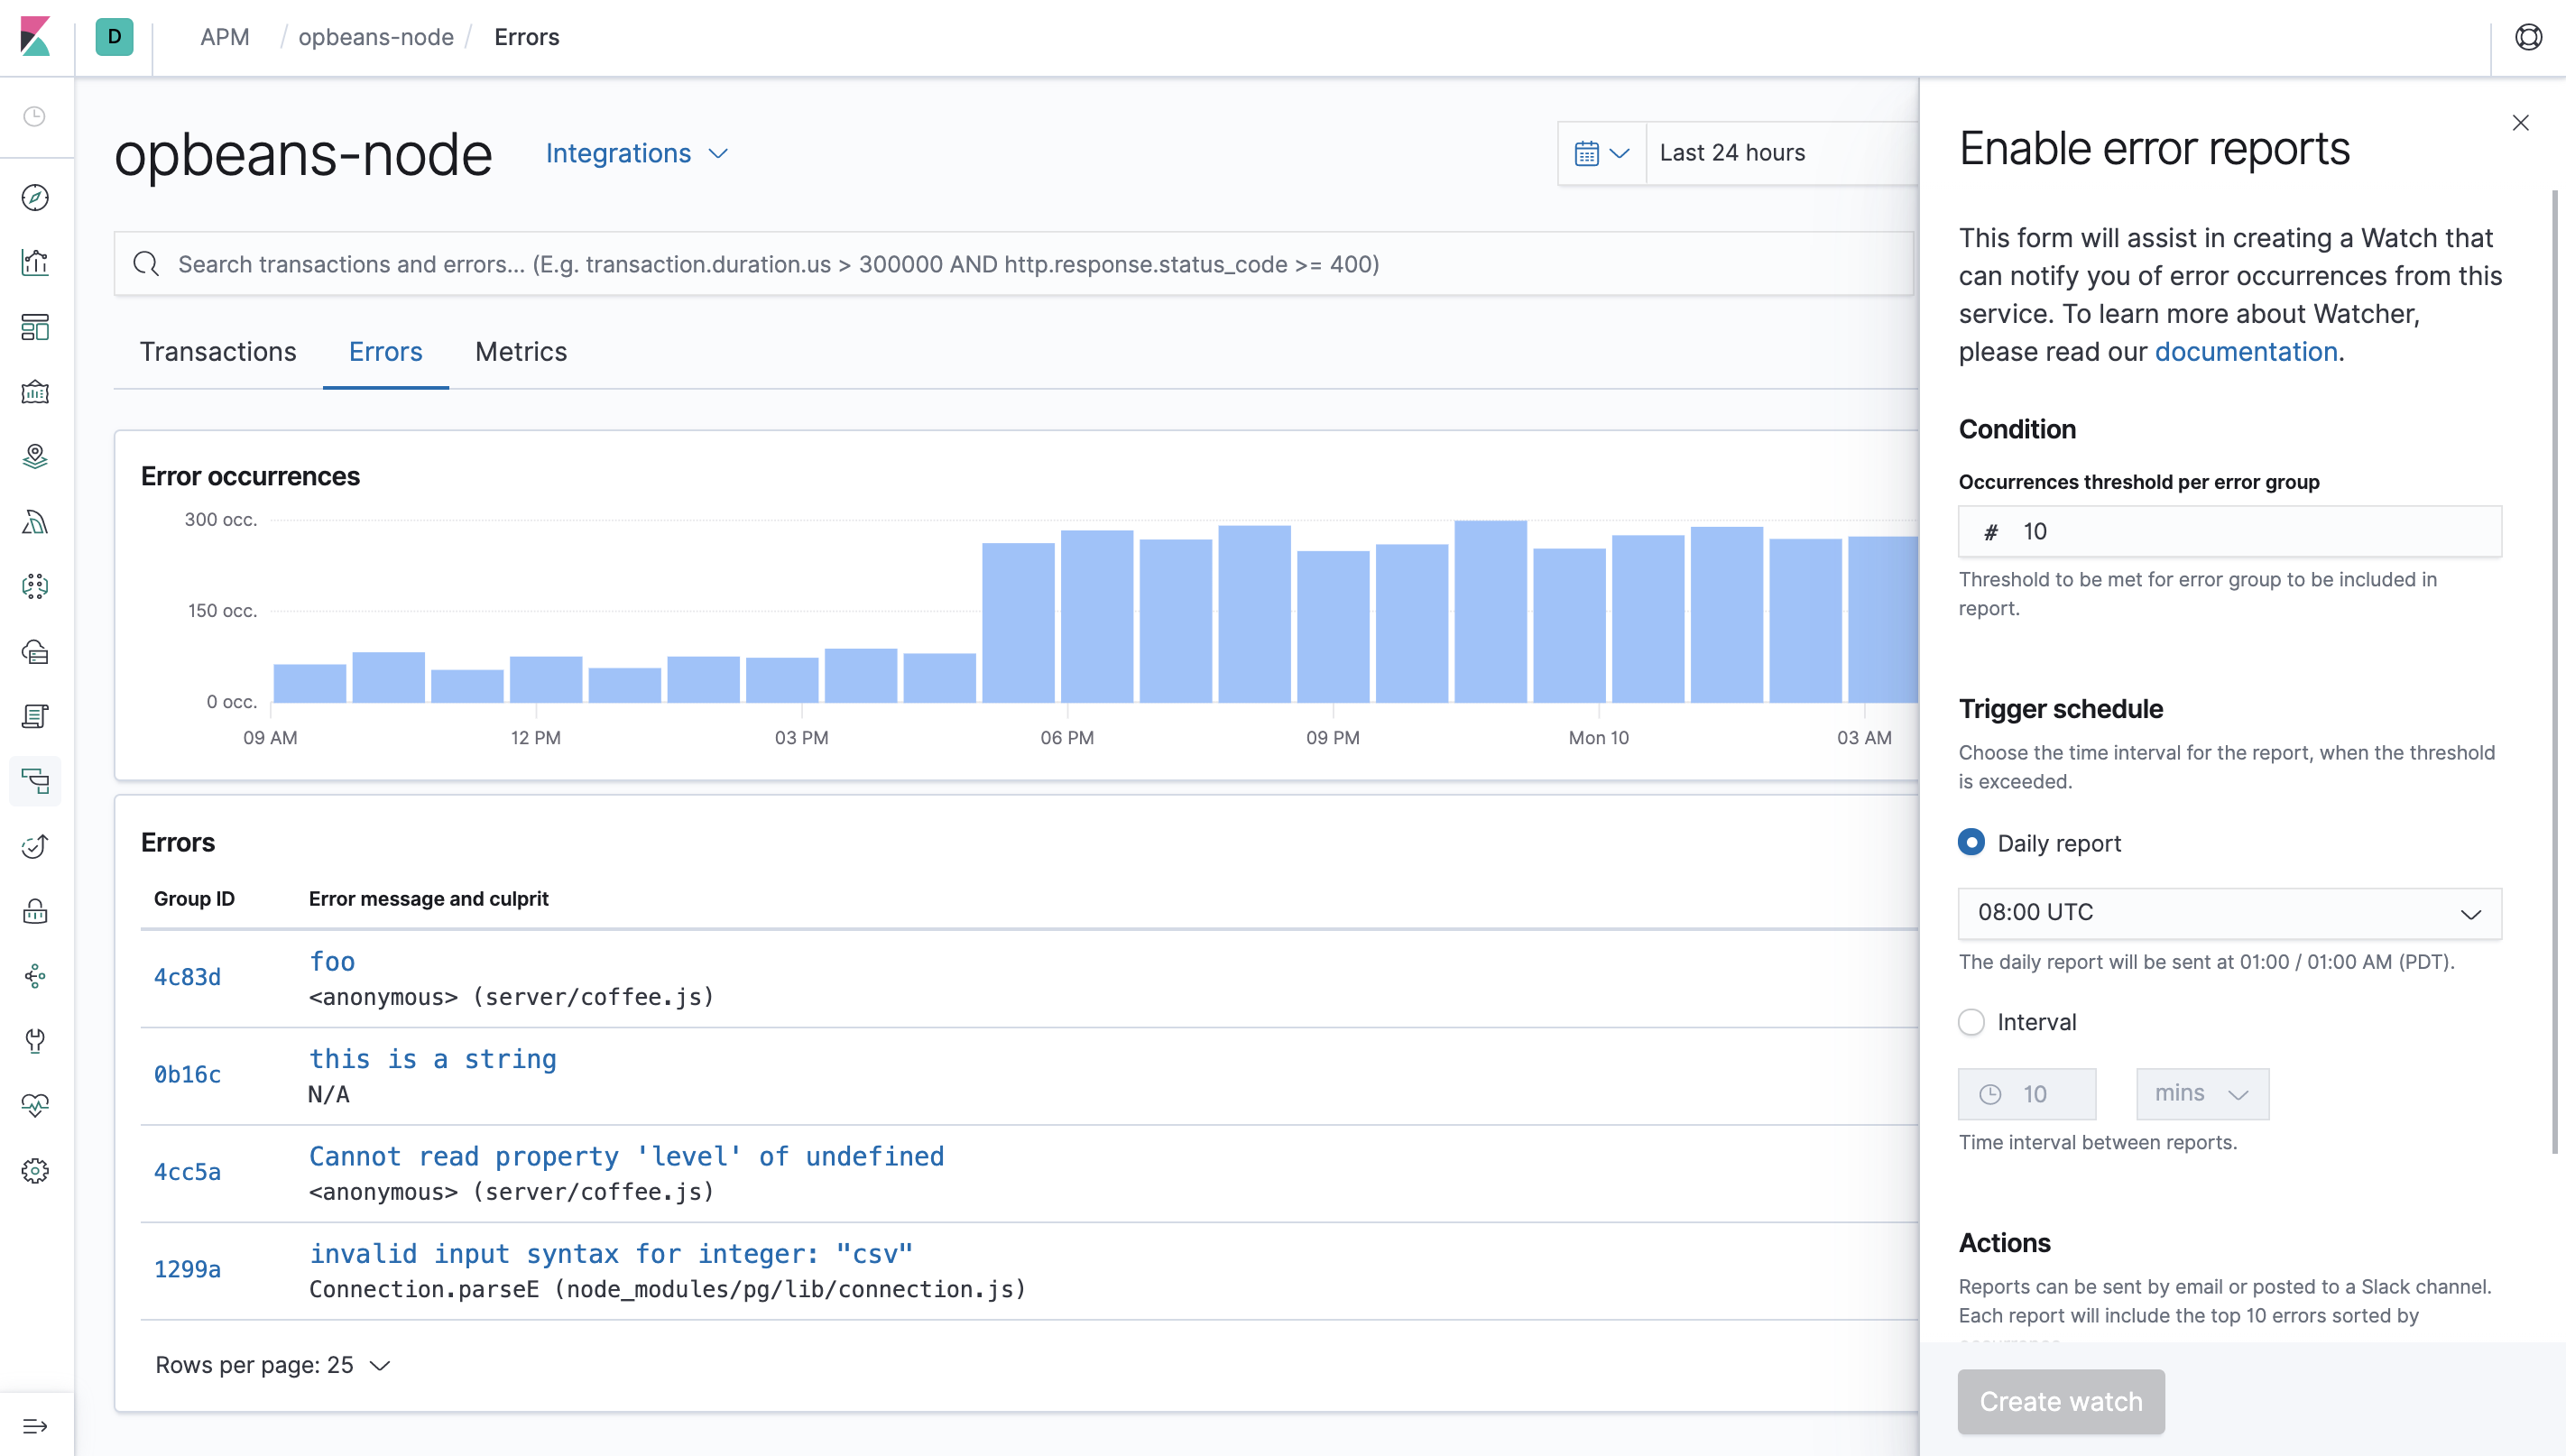
editYou can use the power of the alerting features with Watcher to get reports on error occurrences. The Watcher assistant, which is available on the errors overview, can help you set up a watch per service.
Configure the watch with an occurrences threshold, time interval, and the desired actions, such as email or Slack notifications. With Watcher, your team can set up reports within minutes.
Watches are managed separately in the dedicated Watcher UI available in Advanced Settings.