Profiling a more complicated query
editProfiling a more complicated query
editTo understand how the query trees are displayed inside the Search Profiler, let’s look at a more complicated query.
-
Index the following data via Console:
POST test/_bulk {"index":{}} {"name":"aaron","age":23,"hair":"brown"} {"index":{}} {"name":"sue","age":19,"hair":"red"} {"index":{}} {"name":"sally","age":19,"hair":"blonde"} {"index":{}} {"name":"george","age":19,"hair":"blonde"} {"index":{}} {"name":"fred","age":69,"hair":"blonde"} -
From the Search Profiler, enter "test" in the Index field to restrict profiled
queries to the
testindex. -
Replace the default
match_allquery in the query editor with a query that has two sub-query components and includes a simple aggregation:{ "query": { "bool": { "should": [ { "match": { "name": "fred" } }, { "terms": { "name": [ "sue", "sally" ] } } ] } }, "aggs": { "stats": { "stats": { "field": "price" } } } } - Click Profile to profile the query and visualize the results.
-
Select the shard to view the query details.
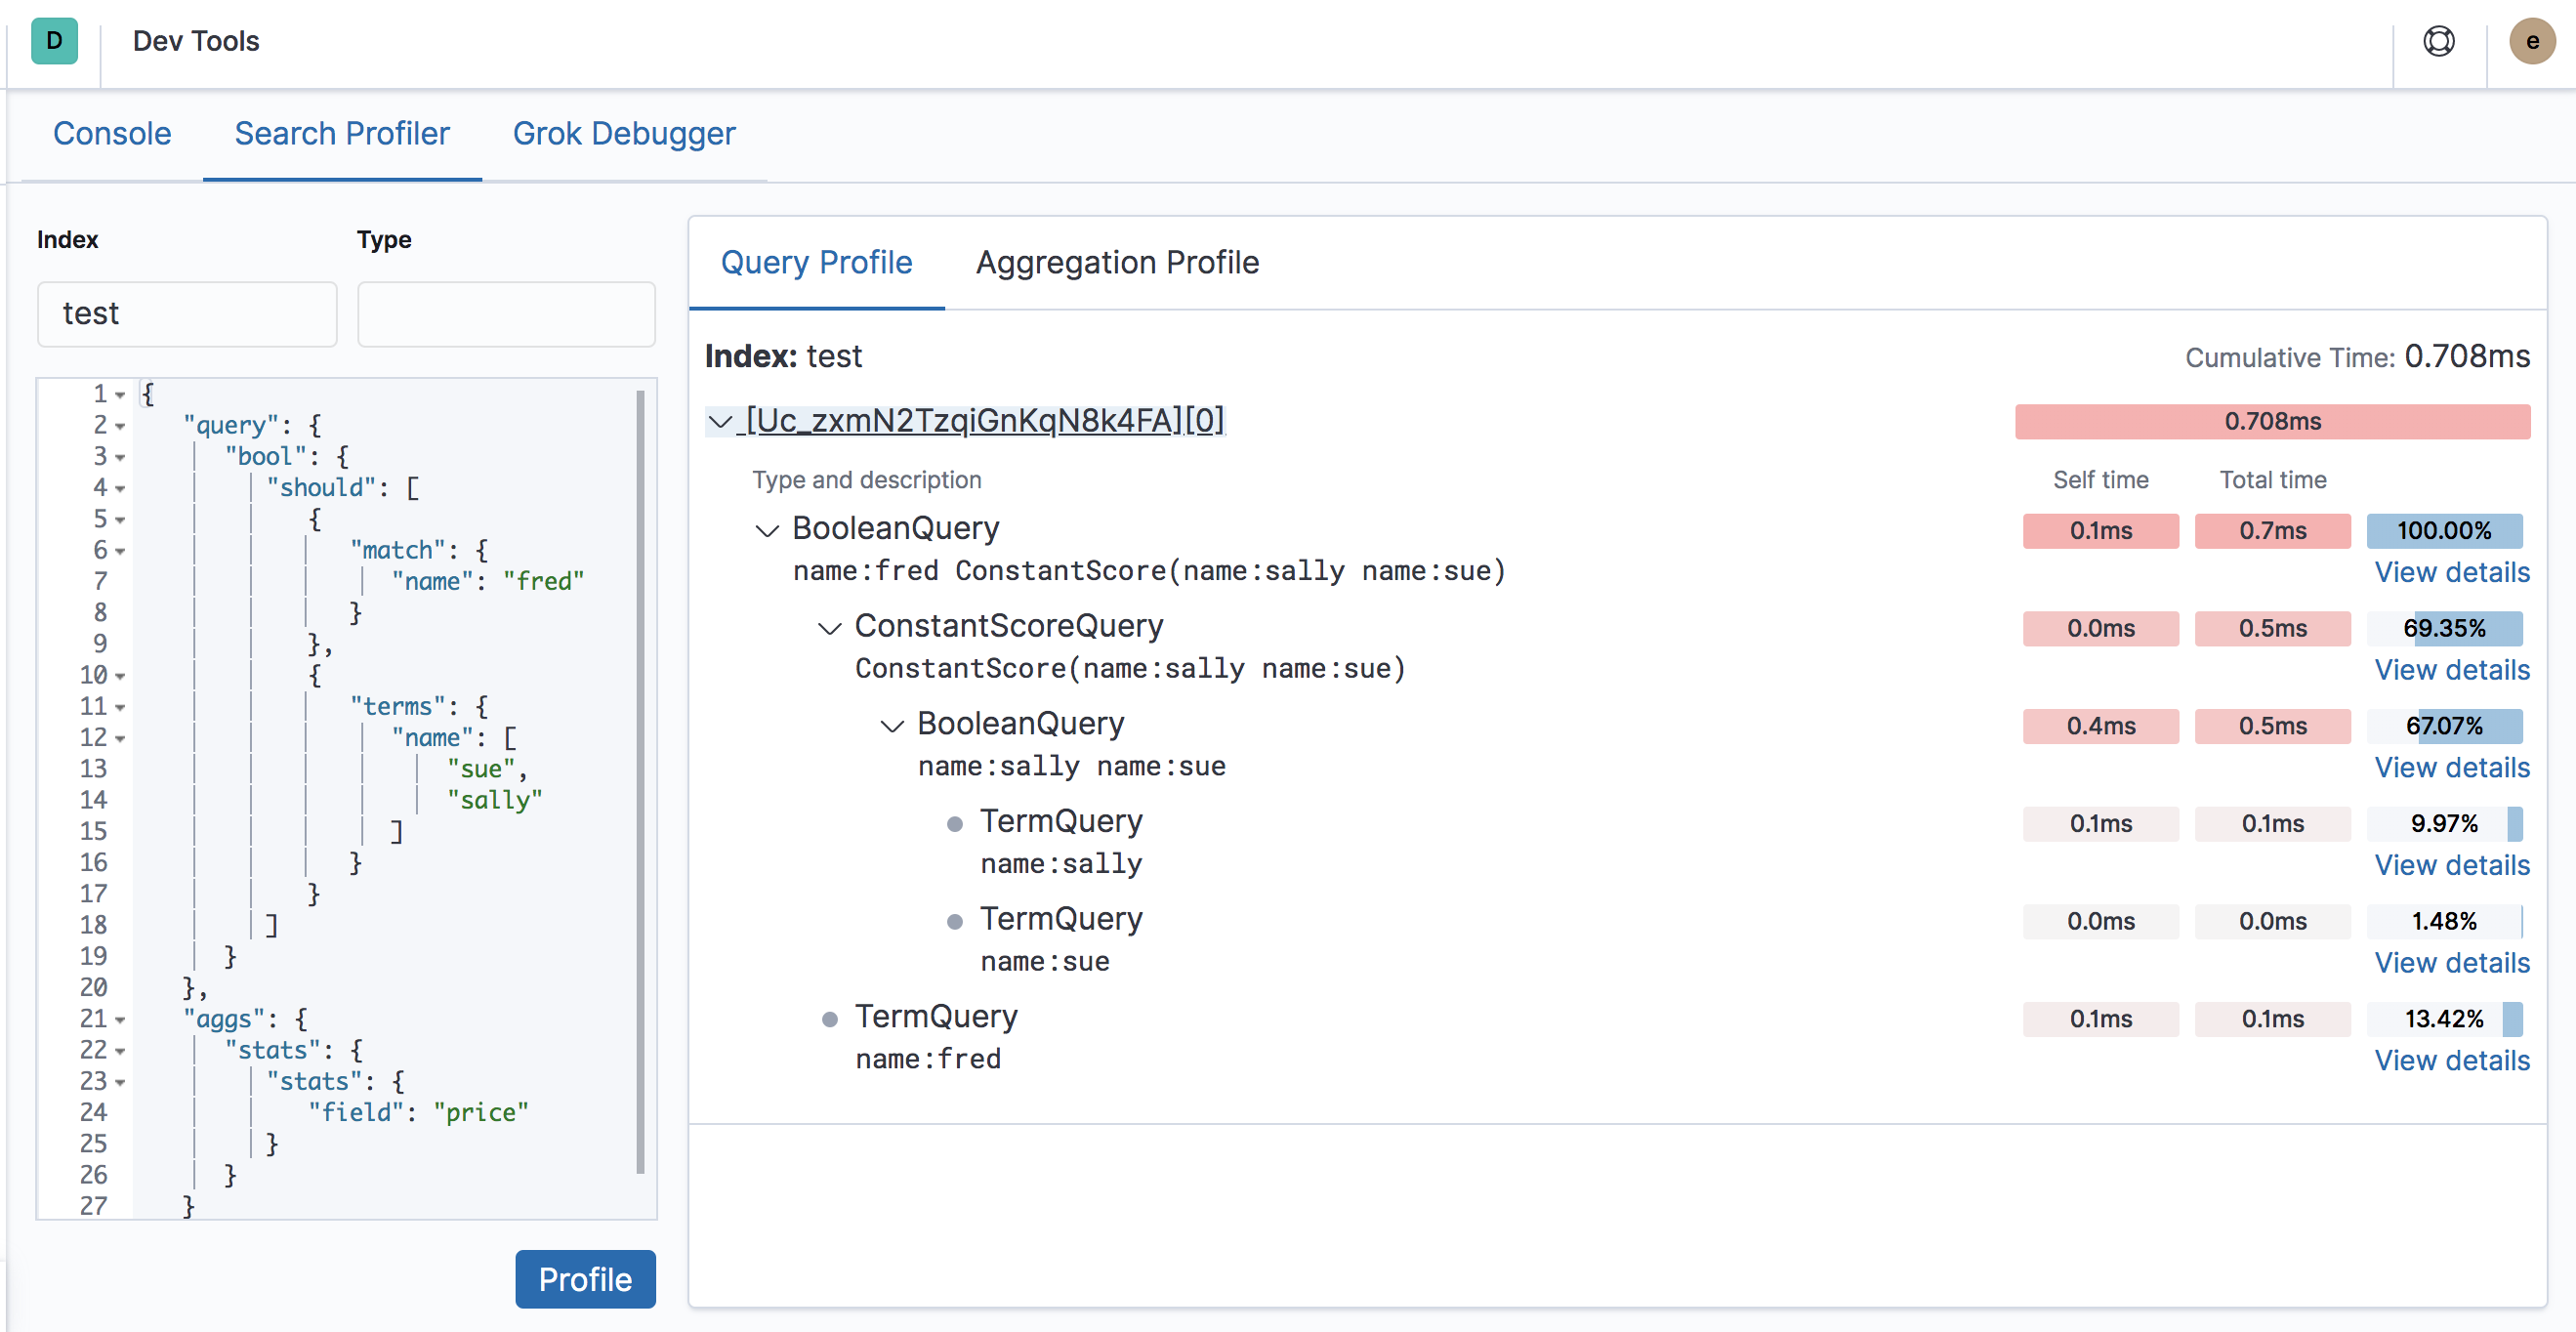
The detail view contains a row for each query component:
-
The top-level
BooleanQuerycomponent corresponds to the bool in the query. -
The second
BooleanQuerycorresponds to the terms query, which is internally converted to aBooleanof should clauses. It has two child queries that correspond to "sue" and "sally" from the terms query. -
The
TermQuerythat’s labeled with "name:fred" corresponds to match: fred in the query.
If you look at the time columns, you can see that "Self time" and "Total time" are no longer identical on all the rows. Self time represents how long the query component took to execute. Total time is the time a query component and all its children took to execute. Therefore, queries like the Boolean queries often have a larger total time than self time.
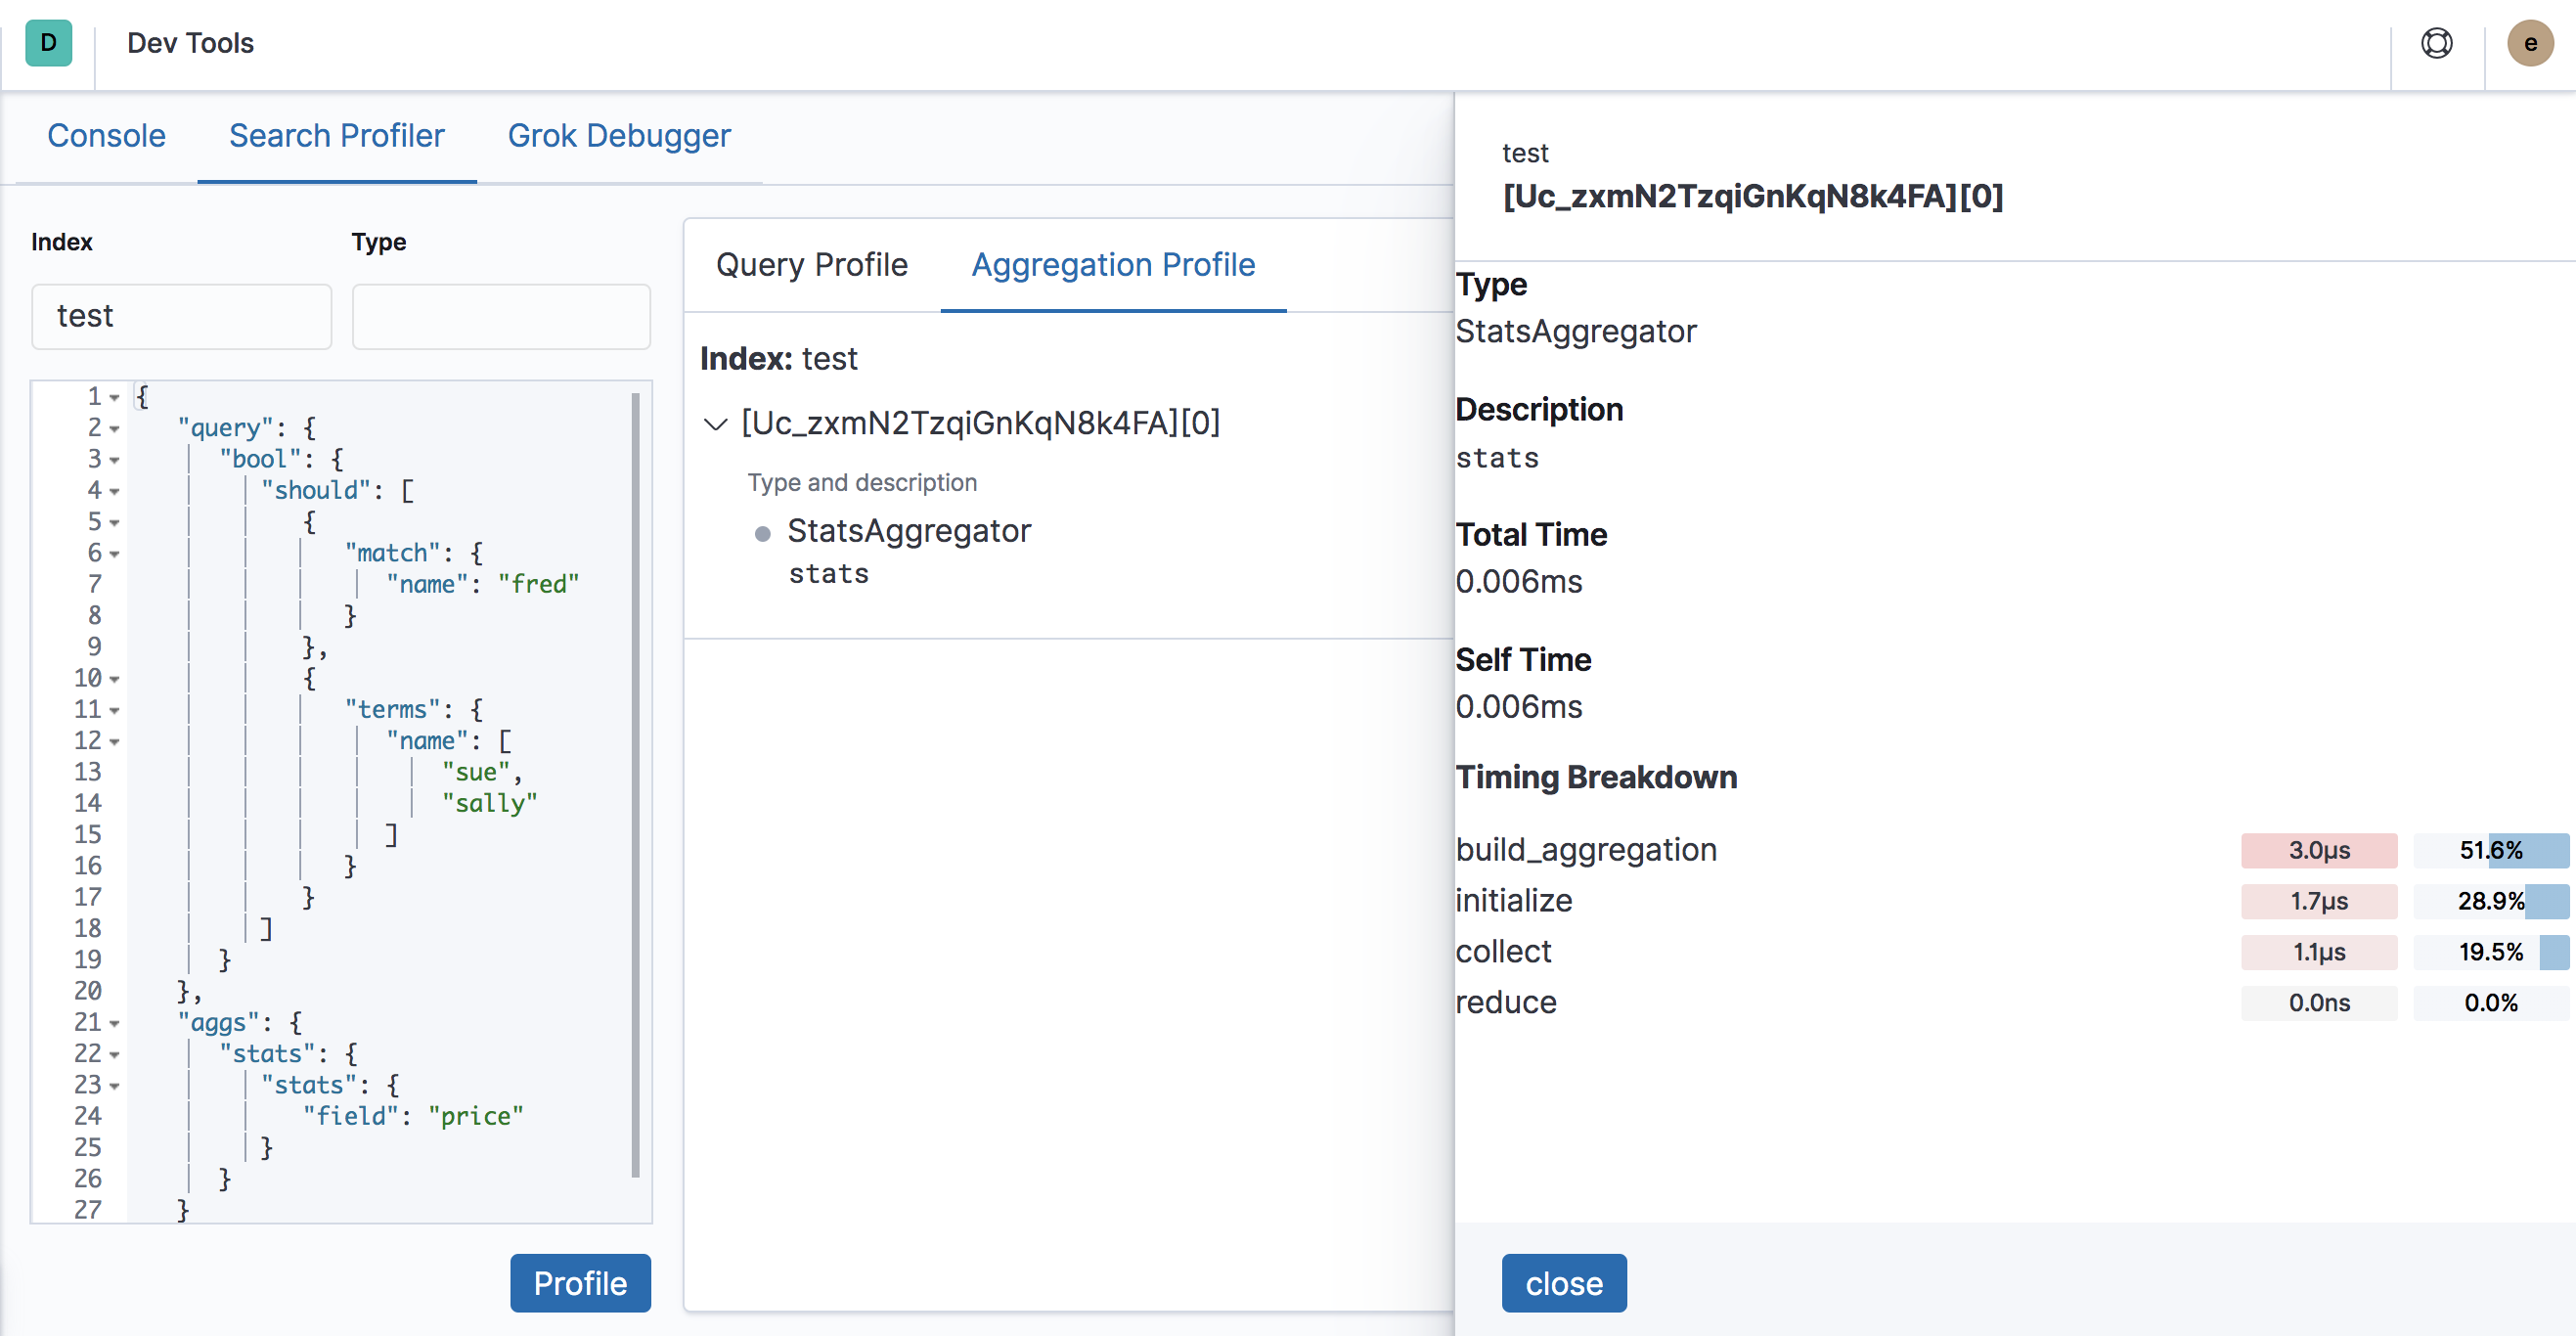
Aggregations
editThis particular query also includes a aggregation (a stats agg on the "age" field).
Click Aggregation Profile to view aggregation profiling statistics (this tab
is only enabled if the query being profiled contains an aggregation).
Select the name of the shard to view the aggregation details and timing breakdown.
For more information about how the Search Profiler works, how timings are calculated, and how to interpret various results, see Profiling queries.