Adding a choropleth layer
editAdding a choropleth layer
editNow that you have a map, you’ll want to add layers to it. The first layer you’ll add is a choropleth layer to shade world countries by web log traffic. Darker shades symbolize countries with more web log traffic, and lighter shades symbolize countries with less traffic.
Add a vector layer from the Elastic Maps Service source
edit- In the map legend, click Add layer.
- Click the Vector shapes data source.
- From the Layer dropdown menu, select World Countries.
- Click the Add layer button.
-
Set Layer name to
Total Requests by Country. - Set Layer transparency to 0.5.
Join the vector layer with the sample web log index
editYou now have a vector layer containing the world countries.
To symbolize countries by web traffic, you’ll need to augment the world country features with the count of Elasticsearch weblog documents originating from each country.
To do this, you’ll create a terms join to link the vector source World Countries to
the Elasticsearch index kibana_sample_data_logs on the shared key iso2 = geo.src.
-
Click plus
 to the right of Term Joins label.
- Click Join --select--
- Set Left field to ISO 3166-1 alpha-2 code.
- Set Right source to kibana_sample_data_logs.
- Set Right field to geo.src.
Set the vector style
editAll of the world countries are still a single color because the layer is using static styling. To shade the world countries based on which country is sending the most requests, you’ll need to use data driven styling.
-
Click
 to the right of Fill color.
- Select the grey color ramp.
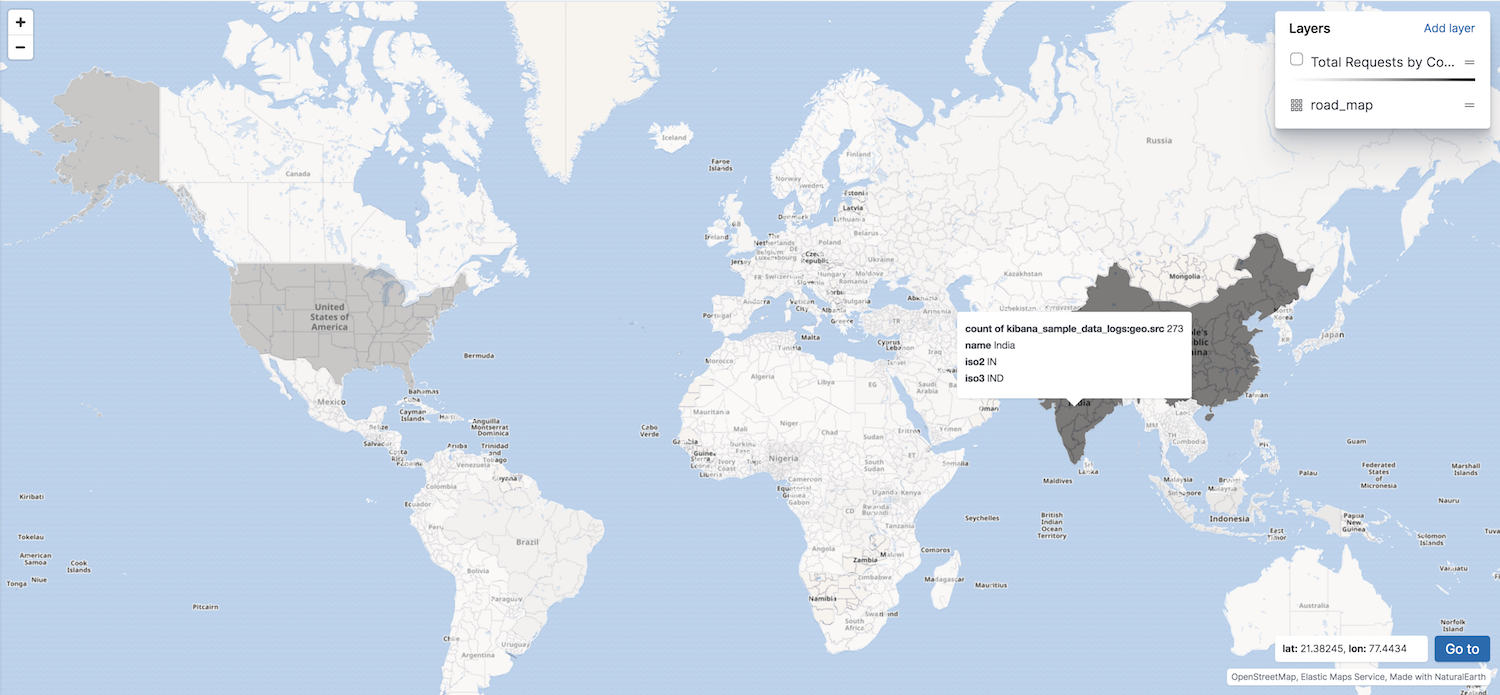
- In the field select input, select count of kibana_sample_data_logs:geo.src.
-
Click Save & close.
Your map now looks like this: