Using the Infrastructure UI
editUsing the Infrastructure UI
editUse the Infrastructure UI in Kibana to monitor your infrastructure and identify problems in real time.
You start with an overview of your infrastructure. Then you can use the interactive UI to drill down into areas of interest.
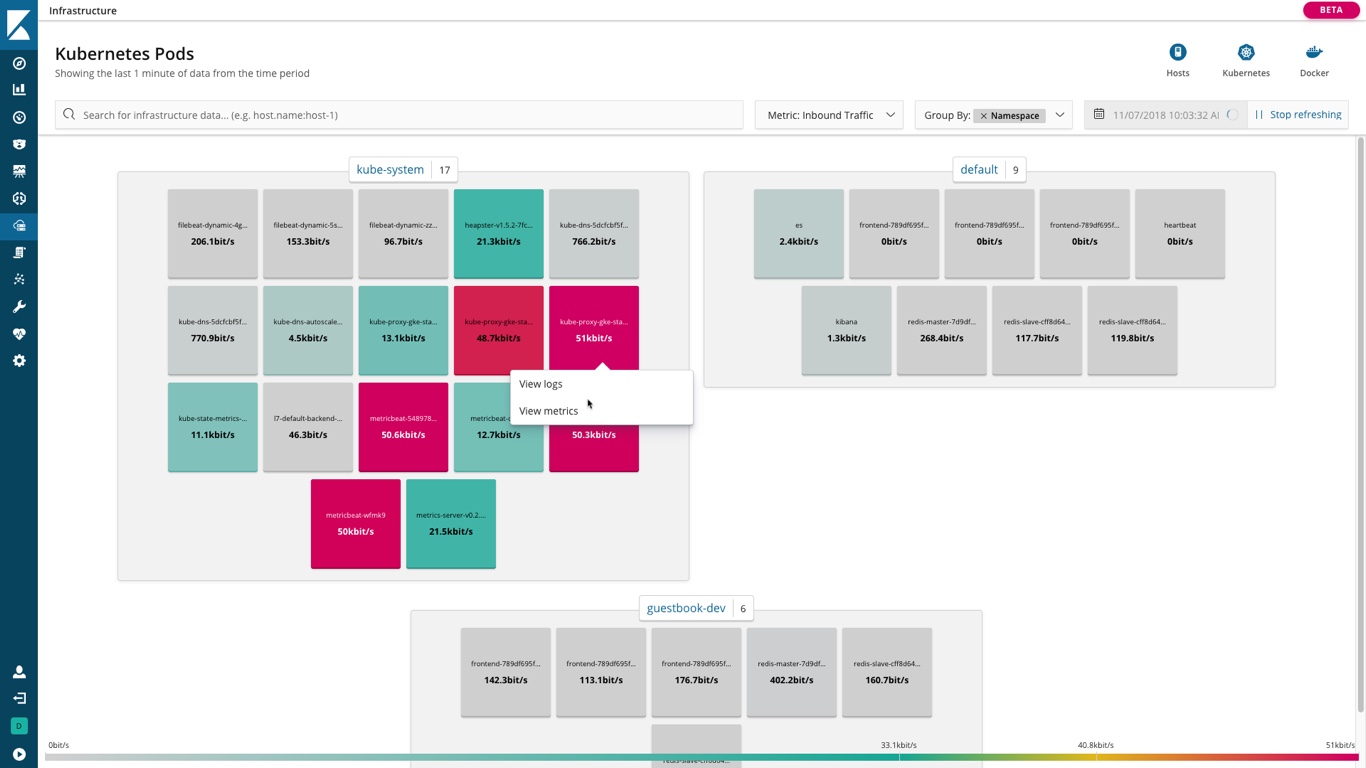
Right-click an element to jump to related logs or metrics.
View your infrastructure by hosts or container
editSelect the high-level view: Hosts, Kubernetes, or Docker. When you change views, you can see the same data through the perspective of a different category.
Use the power of Search
editThe Search bar is always available. You can use it to perform adhoc or structured searches. The Search feature can surface the information you’re looking for, even if the other options you have selected would normally filter it out.
Start at a high-level by selecting the metric
editThis filter helps you start focusing on potential problem areas that may need further investigation. You’ll see metrics that are most relevant for hosts or the container you selected.
Group components
editThe Group By selector offers grouping options that are native and specific for your physical, virtual, and container-based infrastructure. Examples include Availability Zone, Machine Type, Project ID, and Cloud Provider for Hosts, and Namespace and Node for Kubernetes.
Specify the date range
editUse the time selector to focus on a specific timeframe.
Auto-refresh or pause
editSet auto-refresh to keep up-to-date information coming in, or stop refreshing to focus on historical data without new distractions.
Adapt to your metric source
editUsing a custom index pattern to store the metrics, or want to limit the entries presented in a space? Use configure source to change the index pattern and other settings.