Vector styling
editVector styling
editWhen styling a vector layer, you can customize your data by property, such as size and color. For each property, you can specify whether to use a constant or data driven value for the style.
Static styling
editUse static styling to specificy a constant value for a style property.
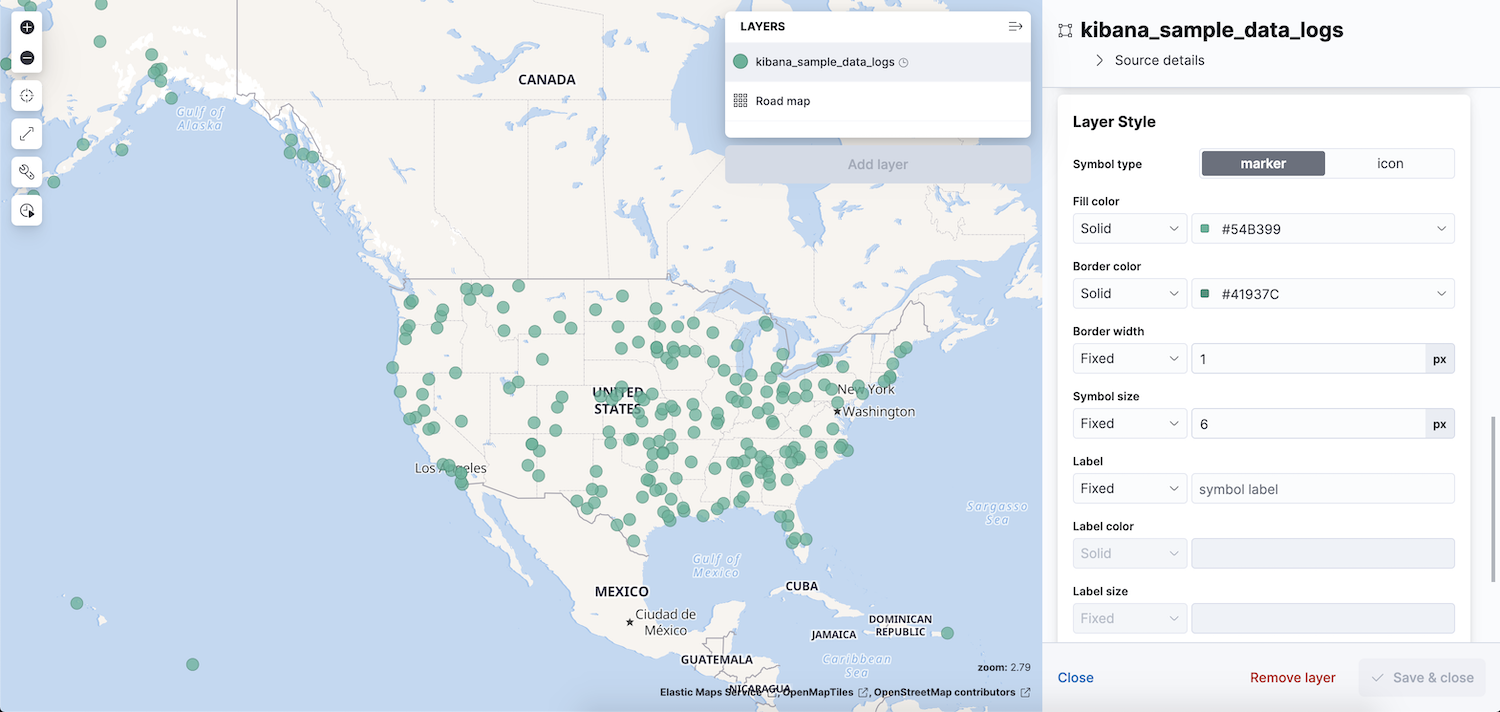
This image shows an example of static styling using the Kibana sample web logs data set. The kibana_sample_data_logs layer uses static styling for all properties.
Data driven styling
editUse data driven styling to symbolize features by property values. To enable data driven styling for a style property, change the selected value from Fixed or Solid to By value.
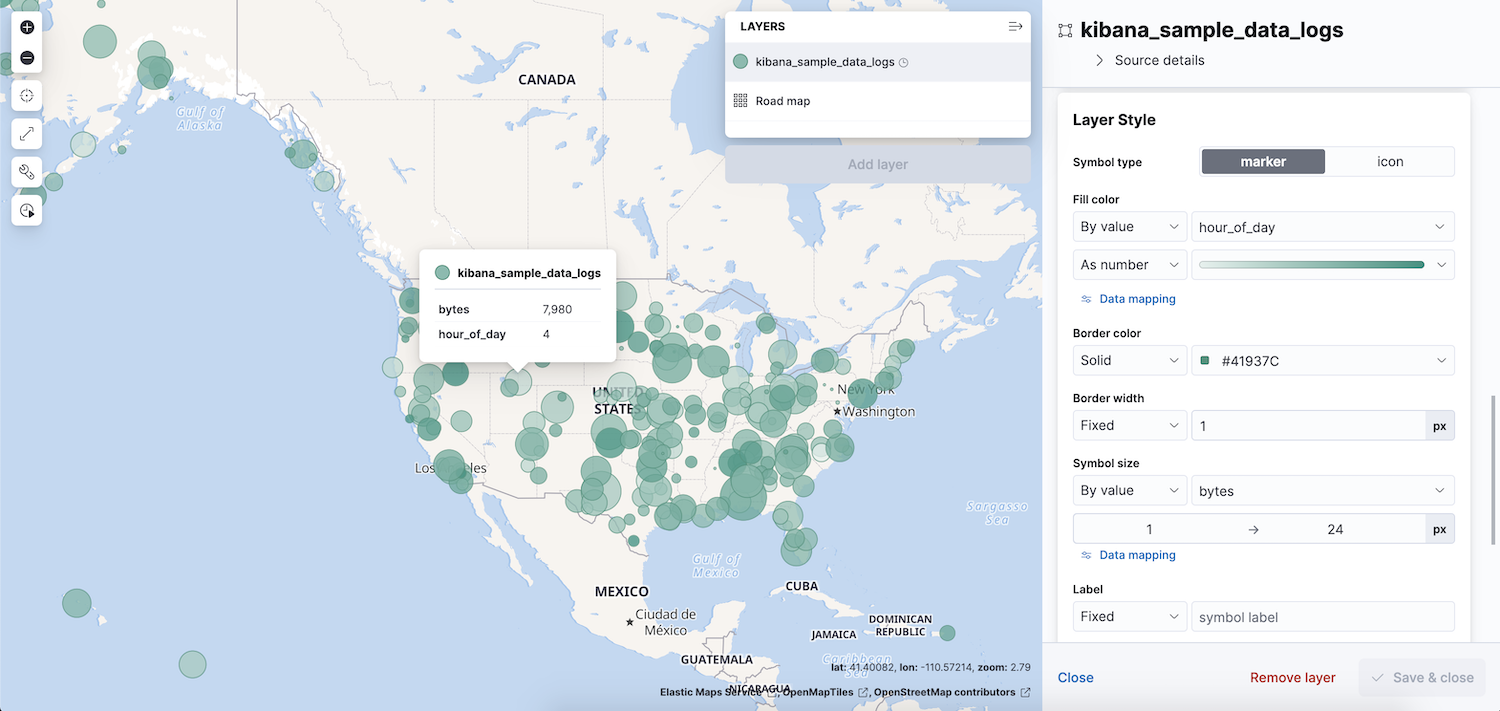
This image shows an example of data driven styling using the Kibana sample web logs data set. The kibana_sample_data_logs layer uses data driven styling for fill color and symbol size style properties.
-
The
hour_of_dayproperty determines the fill color for each feature based on where the value fits on a linear scale. Light green circles symbolize documents that occur earlier in the day, and dark green circles symbolize documents that occur later in the day. -
The
bytesproperty determines the size of each symbol based on where the value fits on a linear scale. Smaller circles symbolize documents with smaller payloads, and larger circles symbolize documents with larger payloads.
Quantitative data driven styling
editQuantitative data driven styling symbolizes features from a range of numeric property values.
Property values are fit from the domain range to the style range on a linear scale.
For example, let’s symbolize Kibana sample web log documents by size.
The sample web logs bytes field ranges from 0 to 18,000. This is the domain range.
The smallest feature has a symbol radius of 1, and the largest feature has a symbol radius of 24. This is the style range.
The bytes property value for each feature will fit on a linear scale from the range of 0 to 18,000 to the style range of 1 to 24.
For color styles, values are fit from the domain range to the color ramp with one of the following:
- Interpolate (default). Interpolate values between min and max to a color band on a linear scale. The color ramp is divided into eight bands.
- Percentiles. Use percentiles to divide the color ramp into bands that map to values.
- Custom. Define custom color ramp bands and ranges.
When the property value is undefined for a feature:
- Fill color and Border color are set to transparent and are not visible.
- Border width and Symbol size are set to the minimum size.
- Symbol orientation is set to 0.
When the symbol range minimum and maximum are the same and there is no range:
- Fill color and Border color are set to last color in the color ramp.
- Border width and Symbol size are set to the maximum size.
Qualitative data driven styling
editQualitative data driven styling symbolizes properties, such as strings and IP addresses, by category.
Qualitative data driven styling is available for the following styling properties:
- Icon
- Fill color
- Border color
- Label color
- Label border color
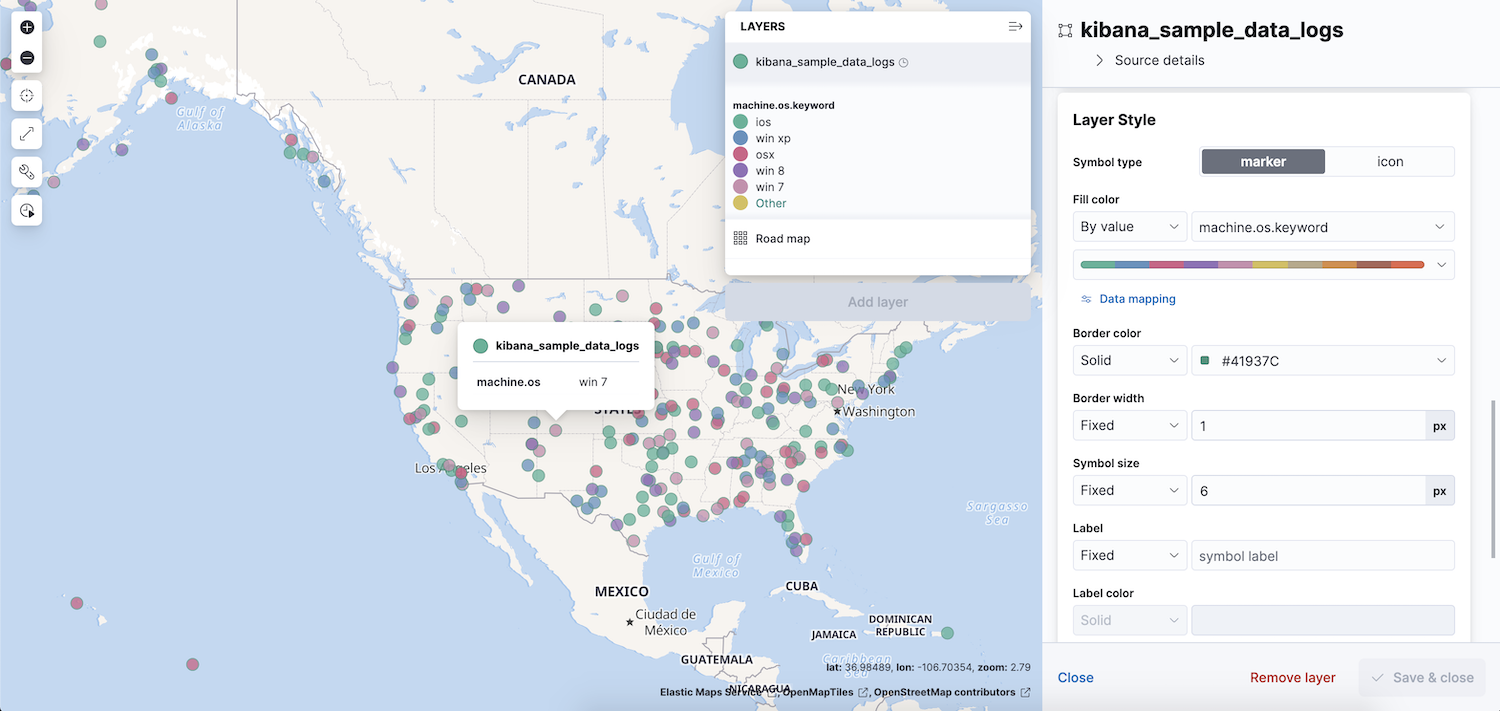
This image shows an example of quantitative data driven styling using the Kibana sample web logs data set.
The machine.os.keyword property determines the color of each symbol based on category.
Class styling
editClass styling symbolizes features by class and requires multiple layers. Use layer filtering to define the class for each layer, and static styling to symbolize each class.
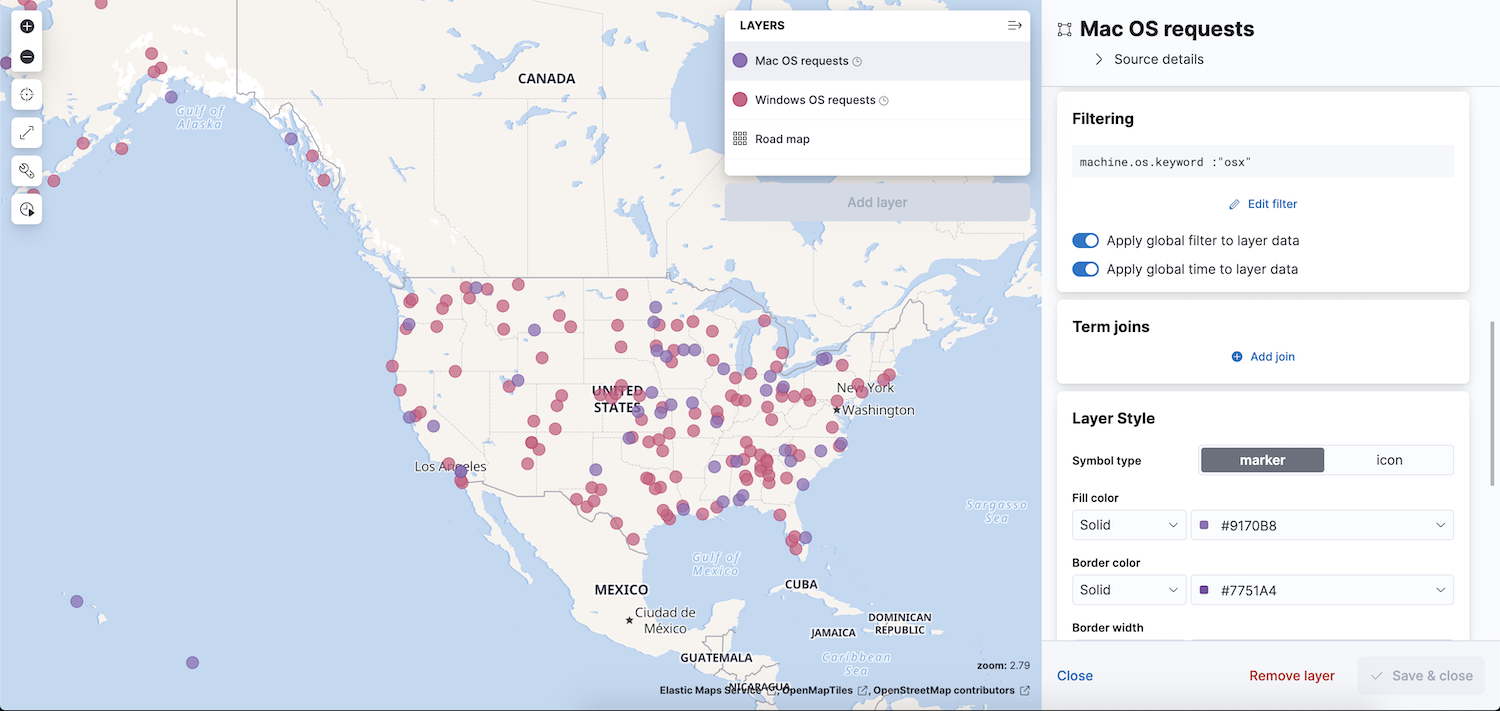
This image shows an example of class styling using the Kibana sample web logs data set.
-
The Mac OS requests layer applies the filter
machine.os : osxso the layer only contains Mac OS requests. The fill color is a static value of green. -
The Window OS requests layer applies the filter
machine.os : win*so the layer only contains Window OS requests. The fill color is a static value of red.