Elasticsearch Monitoring Metrics
editElasticsearch Monitoring Metrics
editYou can drill down into the status of your Elasticsearch cluster in Kibana by clicking the Overview, Nodes, Indices and Logs links on the Stack Monitoring page.
For more information, refer to Monitor a cluster.
Cluster Overview
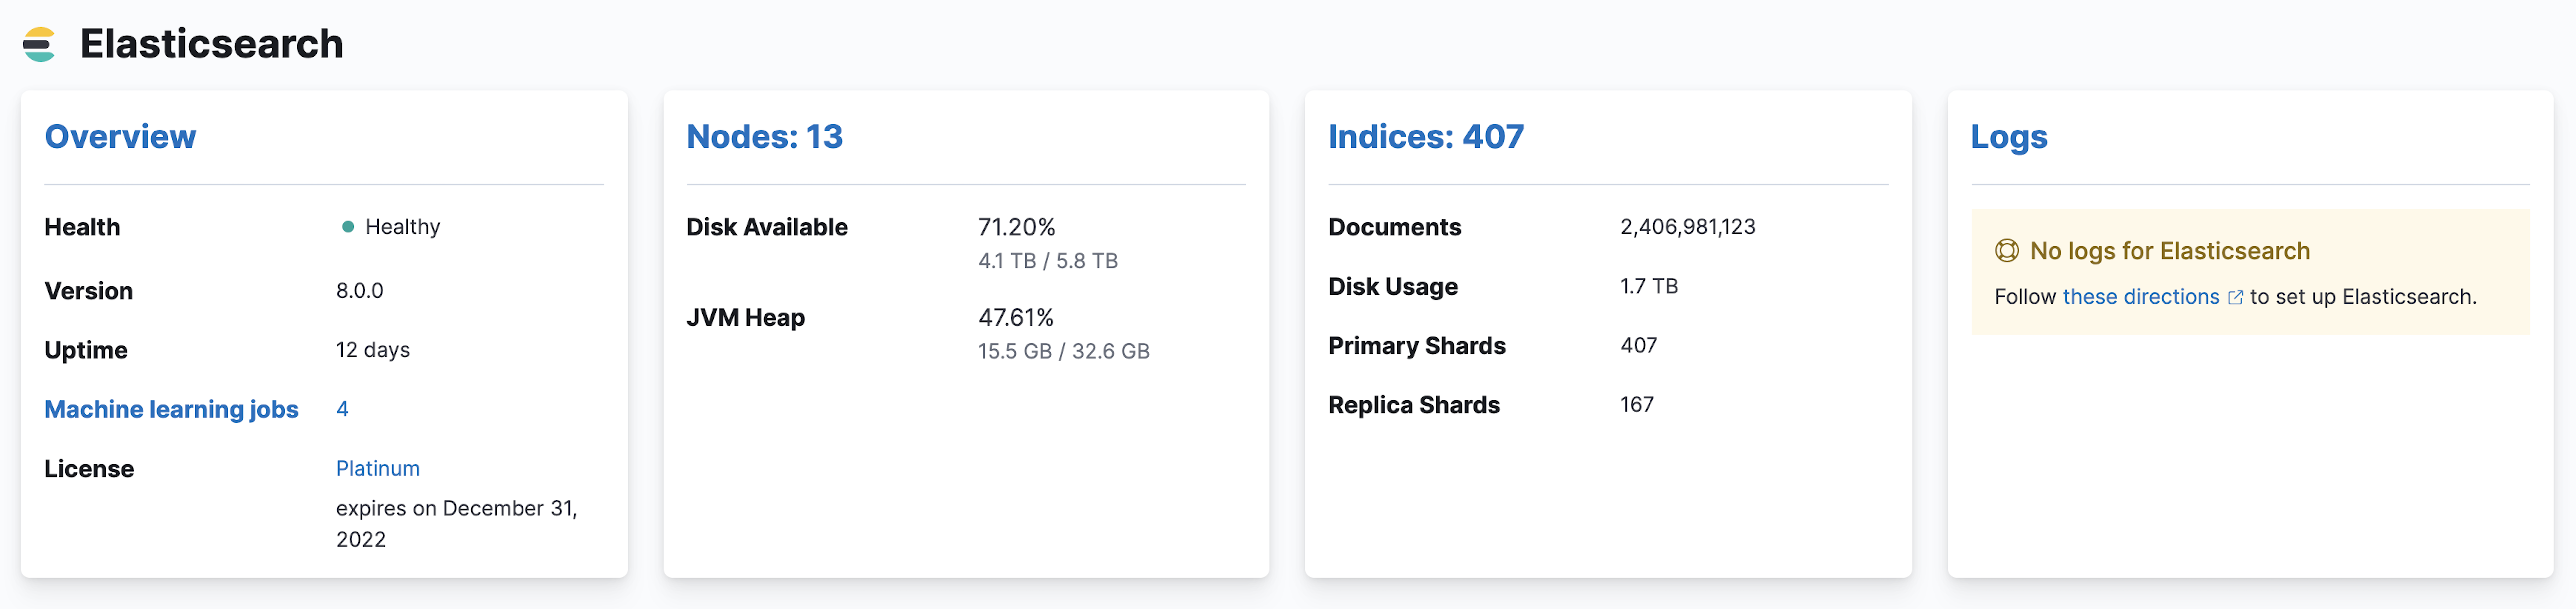
editTo view the key metrics that indicate the overall health of an Elasticsearch cluster, click Overview in the Elasticsearch section. Anything that needs your attention is highlighted in yellow or red.
Conditions that require your attention are listed at the top of the Clusters page. You can also set up watches to alert you when the status of your cluster changes. To learn how, see Watching the status of an Elasticsearch cluster.
The panel at the top shows the current cluster statistics, the charts show the search and indexing performance over time, and the table at the bottom shows information about any shards that are being recovered. If you use Filebeat to collect log data from this cluster, you can also see its recent logs.
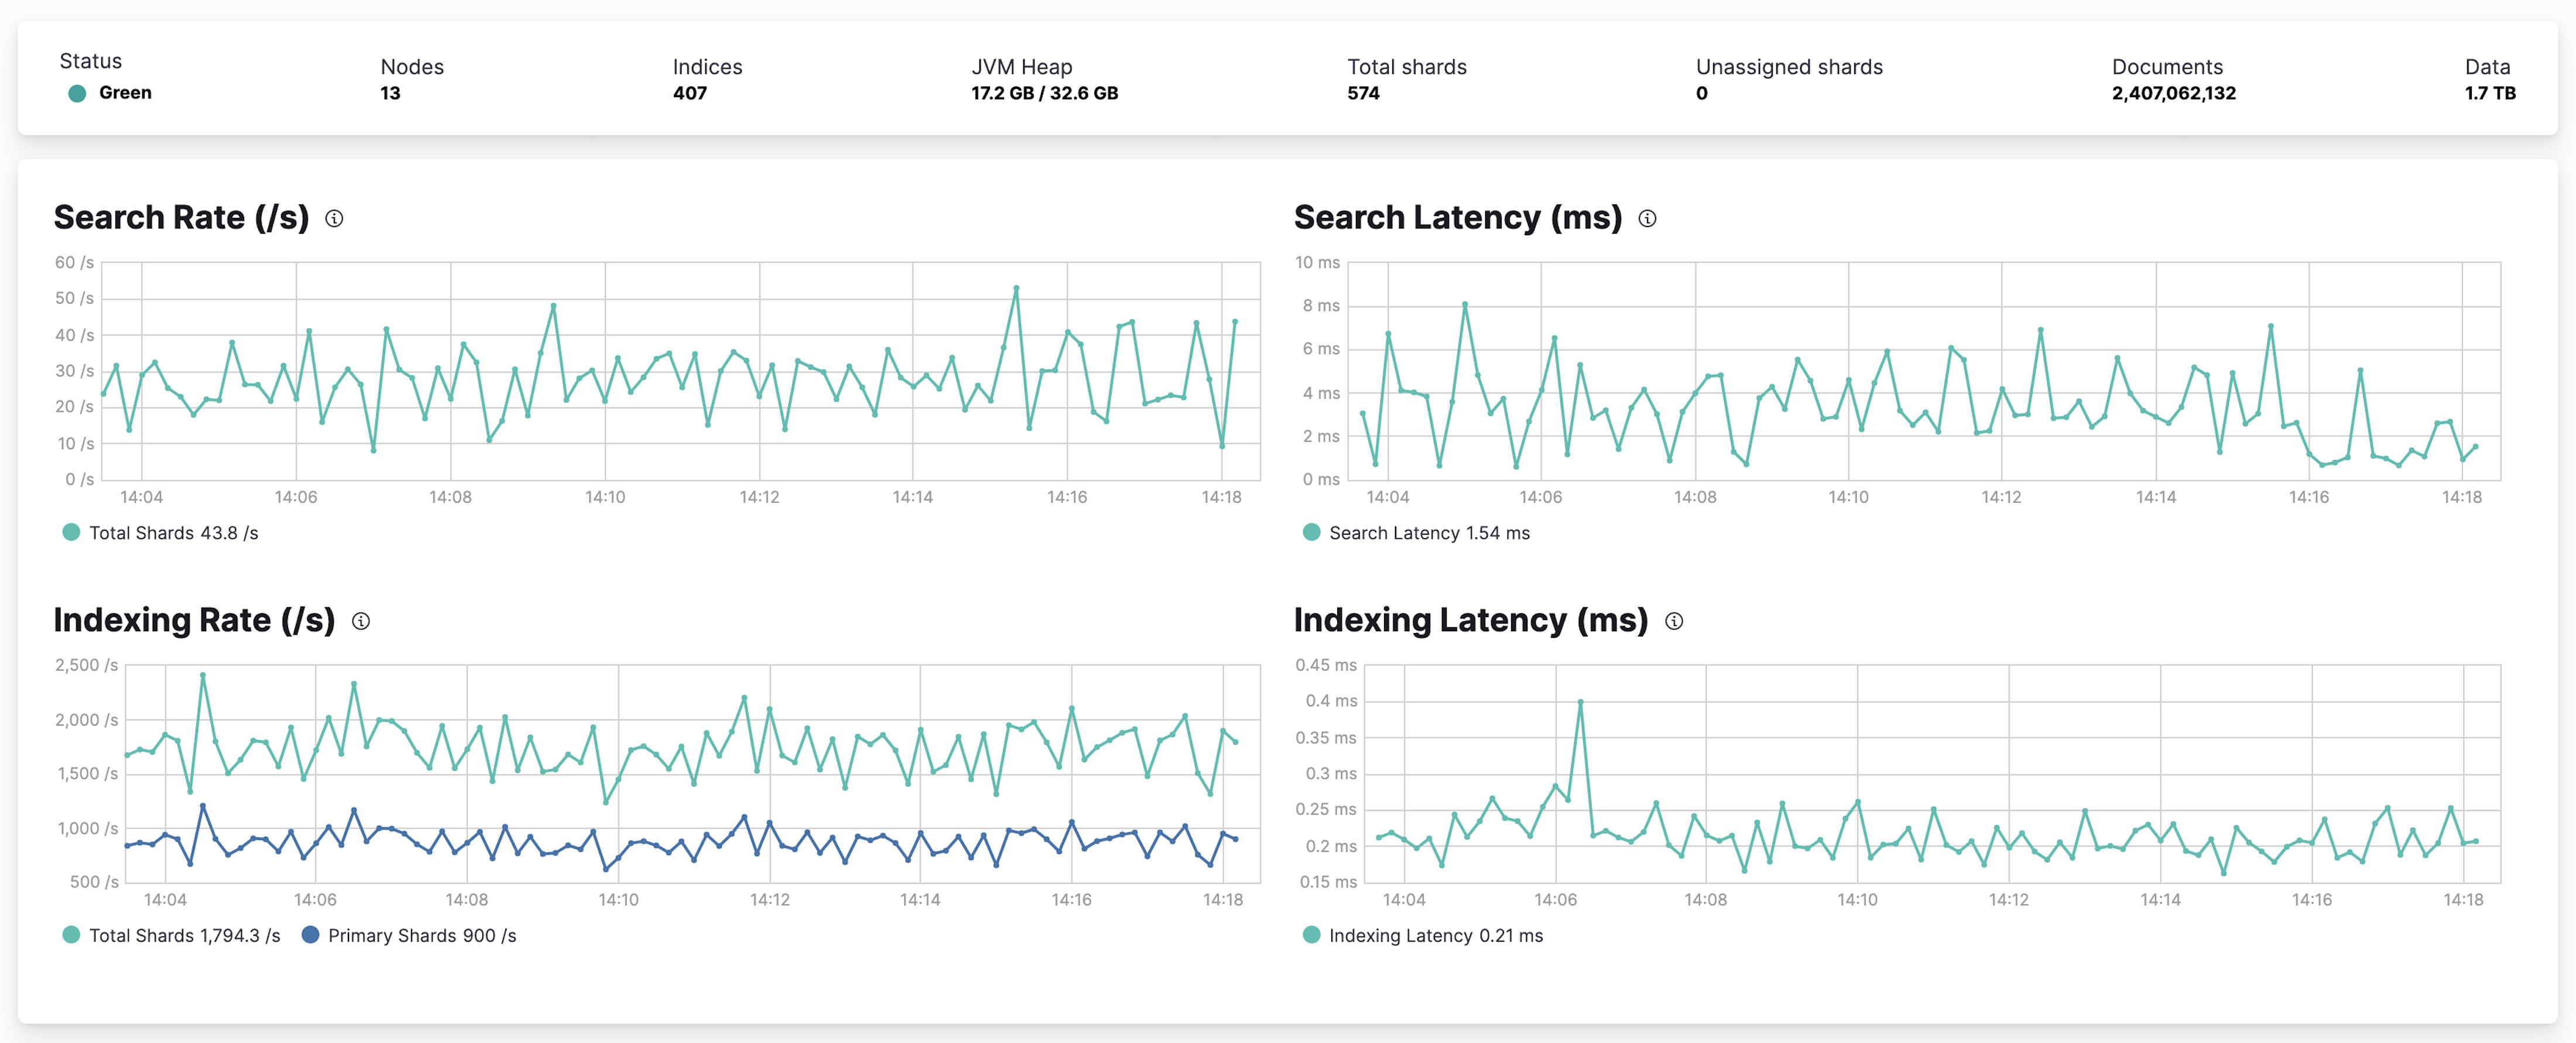
Not sure what a chart is showing? Click the info button for a description of the metrics.
From there, you can dive into detailed metrics for particular nodes and indices.
Nodes
editTo view node metrics, click Nodes. The Nodes section shows the status of each node in your cluster.
Node Overview
editClick the name of a node to view its node statistics over time. These represent high-level statistics collected from Elasticsearch that provide a good overview of health. If you use Filebeat to collect log data from this node, you can also see its recent logs.
Node Advanced
editTo view advanced node metrics, click the Advanced tab for a node. The Advanced tab shows additional metrics, such as memory and garbage collection statistics reported by the selected Elasticsearch node.
You can use the advanced node view to diagnose issues that generally involve more advanced knowledge of Elasticsearch, such as poor garbage collection performance.
Indices
editTo view index metrics, click Indices. The Indices section shows the same overall index and search metrics as the Overview and a table of your indices.
Index Overview
editFrom the Indices listing, you can view data for a particular index. To drill down into the data for a particular index, click its name in the Indices table.
Index Advanced
editTo view advanced index metrics, click the Advanced tab for an index. The Advanced tab shows additional metrics, such as memory statistics reported about the Elasticsearch index. If the index has more than one shard, then its shards might live on more than one node.
The Advanced index view can be used to diagnose issues that generally involve more advanced knowledge of Elasticsearch, such as wasteful index memory usage.
Jobs
editTo view machine learning job metrics, click Jobs. For each job in your cluster, it shows information such as its status, the number of records processed, the size of the model, the number of forecasts, and the node that runs the job.
CCR
editTo view cross-cluster replication metrics, click CCR. For each follower index on the cluster, it shows information such as the leader index, an indication of how much the follower index is lagging behind the leader index, the last fetch time, the number of operations synced, and error messages. If you select a follower index, you can view the same information for each shard.
If you select a shard, you can see graphs for the fetch and operation delays. You can also see advanced information, which contains the results from the get follower stats API.
For more information, refer to Cross-cluster replication.
Logs
editIf you use Filebeat to collect log data from your cluster, you can see its recent logs in the Stack Monitoring application. The Clusters page lists the number of informational, debug, and warning messages in the server and deprecation logs.
If you click Logs, you can see the most recent logs for the cluster.
By default, up to 10 log entries are shown. You can show up to 50 log
entries by changing the
monitoring.ui.elasticsearch.logFetchCount setting.