Reporting
editReporting
editYou can generate a report that contains a Kibana dashboard, visualization, saved search, or Canvas workpad. Depending on the object type, you can export the data as a PDF, PNG, or CSV document, which you can keep for yourself, or share with others.
Reporting is available from the Share menu in Discover, Dashboard, Visualize Library, and Canvas.
PDF and PNG reports are a subscription feature.
Setup
editThe reporting features are automatically enabled in Kibana. It runs a custom build of the Chromium web browser, which runs on the server in headless mode to load Kibana and capture the rendered Kibana charts as images.
Chromium is an open-source project not related to Elastic, but the Chromium binary for Kibana has been custom-built by Elastic to ensure it works with minimal setup. However, the Kibana server OS might still require additional dependencies for Chromium. See the Reporting troubleshooting section for more information about the system dependencies for different operating systems.
Roles and privileges
editTo generate a report, you must have the reporting_user role. You also need
the appropriate Kibana privileges to access the objects that you
want to report on and the Elasticsearch indices. See Reporting and security
for an example.
Manually generate and download reports
editGenerate and download PDF, PNG, and CSV files of dashboards, visualizations, Canvas workpads, and saved searches.
- Open the dashboard, visualization, Canvas workpad, or saved search.
-
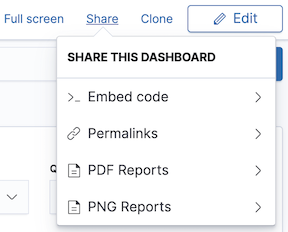
From the Kibana toolbar, click Share, then select one of the following options:
- PDF Reports — Generates a PDF file of the dashboard, visualization, or Canvas workpad.
- PNG Reports — Generates a PNG file of the dashboard or visualization.
- CSV Reports — Generates a CSV report of the saved search.
-
Generate the report.
When the report completes, a notification appears.
- Click Download report.
When you create a dashboard report that includes a data table or saved search, the PDF includes only the visible data.
Layout and sizing
editThe layout and size of the PDF or PNG image depends on the Kibana app with which the Reporting plugin is integrated. For Canvas, the worksheet dimensions determine the size for reports. In other apps, the dimensions are taken on the fly by looking at the size of the visualization elements or panels on the page.
The size dimensions are part of the reporting job parameters. Therefore, to make the report output larger or smaller, you can change the size of the browser. This resizes the shareable container before generating the report, so the desired dimensions are passed in the job parameters.
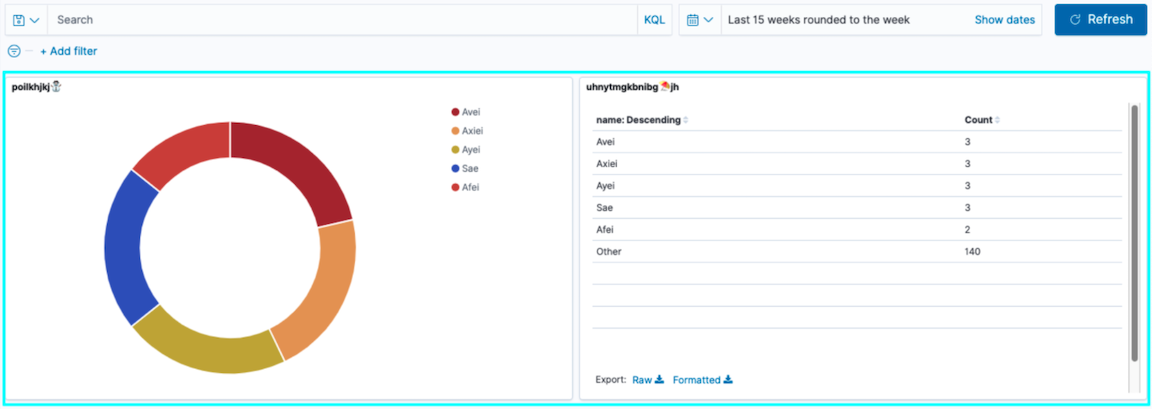
In the following Kibana dashboard, the shareable container is highlighted. The shareable container is captured when you click Generate or Copy POST URL from the Share menu. It might take some trial and error before you’re satisfied with the layout and dimensions in the PNG or PDF image.
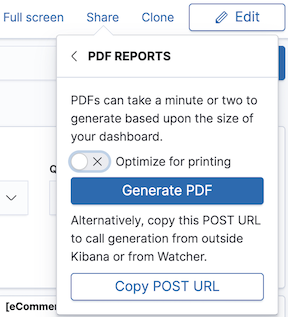
Optimize PDF for print—dashboard only
editTo create a printer-friendly PDF with multiple A4 portrait pages and two visualizations per page, turn on Optimize for printing.
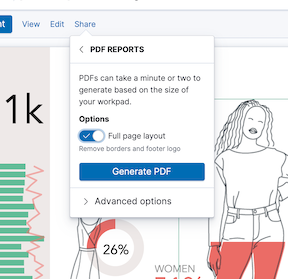
Full page PDF layout —Canvas only
editTo create a PDF without margins surrounding the Canvas workpad, turn on Full page layout before generating the PDF.
View and manage report history
editFor a list of your reports, open the main menu, then click Stack Management > Reporting. From this view, you can monitor the status of a report and download reports that you previously generated.