Kibana alerts
editKibana alerts
editThe Elastic Stack monitoring features provide Kibana alerting rules out-of-the box to notify you of potential issues in the Elastic Stack. These rules are preconfigured based on the best practices recommended by Elastic. However, you can tailor them to meet your specific needs.
When you open Stack Monitoring, the preconfigured rules are created automatically. They are initially configured to detect and notify on various conditions across your monitored clusters. You can view notifications for: Cluster health, Resource utilization, and Errors and exceptions for Elasticsearch in real time.
The default Watcher based "cluster alerts" for Stack Monitoring have
been recreated as rules in Kibana alerting features. For this reason, the existing
Watcher email action
monitoring.cluster_alerts.email_notifications.email_address no longer works.
The default action for all Stack Monitoring rules is to write to Kibana logs
and display a notification in the UI.
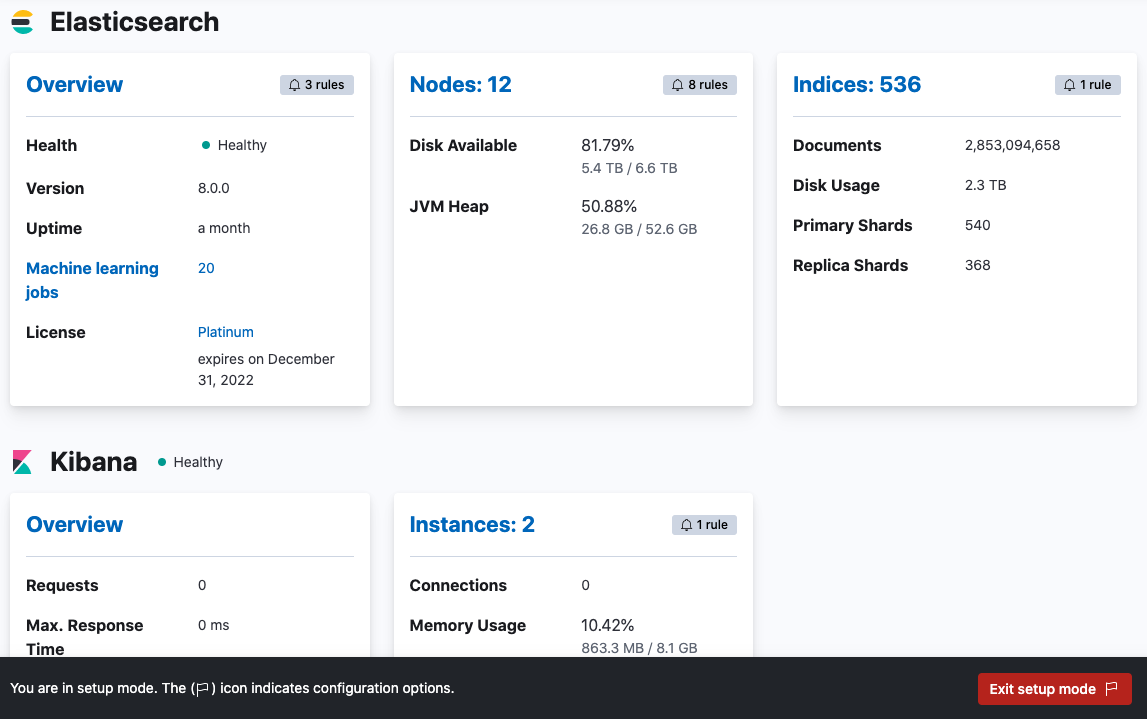
To review and modify all available rules, use Enter setup mode on the Cluster overview page in Stack Monitoring:
CPU usage threshold
editThis rule checks for Elasticsearch nodes that run a consistently high CPU load. By default, the condition is set at 85% or more averaged over the last 5 minutes. The rule is grouped across all the nodes of the cluster by running checks on a schedule time of 1 minute with a re-notify interval of 1 day.
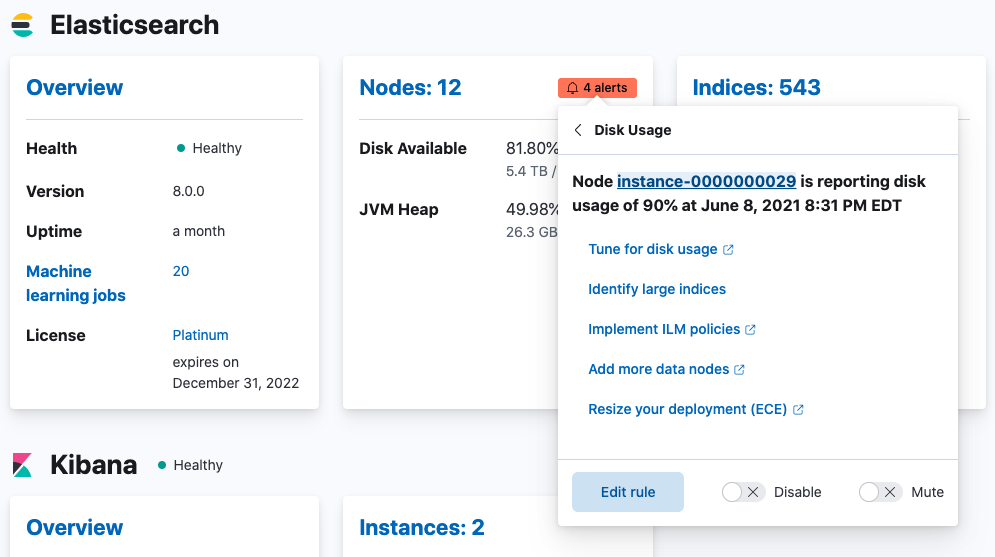
Disk usage threshold
editThis rule checks for Elasticsearch nodes that are nearly at disk capacity. By default, the condition is set at 80% or more averaged over the last 5 minutes. The rule is grouped across all the nodes of the cluster by running checks on a schedule time of 1 minute with a re-notify interval of 1 day.
JVM memory threshold
editThis rule checks for Elasticsearch nodes that use a high amount of JVM memory. By default, the condition is set at 85% or more averaged over the last 5 minutes. The rule is grouped across all the nodes of the cluster by running checks on a schedule time of 1 minute with a re-notify interval of 1 day.
Missing monitoring data
editThis rule checks for Elasticsearch nodes that stop sending monitoring data. By default, the condition is set to missing for 15 minutes looking back 1 day. The rule is grouped across all the Elasticsearch nodes of the cluster by running checks on a schedule time of 1 minute with a re-notify interval of 6 hours.
Thread pool rejections (search/write)
editThis rule checks for Elasticsearch nodes that experience thread pool rejections. By
default, the condition is set at 300 or more over the last 5 minutes. The rule
is grouped across all the nodes of the cluster by running checks on a schedule
time of 1 minute with a re-notify interval of 1 day. Thresholds can be set
independently for search and write type rejections.
CCR read exceptions
editThis rule checks for read exceptions on any of the replicated Elasticsearch clusters. The condition is met if 1 or more read exceptions are detected in the last hour. The rule is grouped across all replicated clusters by running checks on a schedule time of 1 minute with a re-notify interval of 6 hours.
Large shard size
editThis rule checks for a large average shard size (across associated primaries) on
any of the specified index patterns in an Elasticsearch cluster. The condition is met if
an index’s average shard size is 55gb or higher in the last 5 minutes. The rule
is grouped across all indices that match the default pattern of -.* by running
checks on a schedule time of 1 minute with a re-notify interval of 12 hours.
Cluster alerting
editThese rules check the current status of your Elastic Stack. You can drill down into the metrics to view more information about your cluster and specific nodes, instances, and indices.
An action is triggered if any of the following conditions are met within the last minute:
- Elasticsearch cluster health status is yellow (missing at least one replica) or red (missing at least one primary).
- Elasticsearch version mismatch. You have Elasticsearch nodes with different versions in the same cluster.
- Kibana version mismatch. You have Kibana instances with different versions running against the same Elasticsearch cluster.
- Logstash version mismatch. You have Logstash nodes with different versions reporting stats to the same monitoring cluster.
- Elasticsearch nodes changed. You have Elasticsearch nodes that were recently added or removed.
-
Elasticsearch license expiration. The cluster’s license is about to expire.
If you do not preserve the data directory when upgrading a Kibana or Logstash node, the instance is assigned a new persistent UUID and shows up as a new instance.
-
Subscription license expiration. When the expiration date approaches, you will get notifications with a severity level relative to how soon the expiration date is:
- 60 days: Informational alert
- 30 days: Low-level alert
- 15 days: Medium-level alert
-
7 days: Severe-level alert
The 60-day and 30-day thresholds are skipped for Trial licenses, which are only valid for 30 days.
Some action types are subscription features, while others are free. For a comparison of the Elastic subscription levels, see the alerting section of the Subscriptions page.