Canvas
editCanvas
editCanvas is a data visualization and presentation tool that sits within Kibana. With Canvas, you can pull live data directly from Elasticsearch, and combine the data with colors, images, text, and your imagination to create dynamic, multi-page, pixel-perfect displays. If you are a little bit creative, a little bit technical, and a whole lot curious, then Canvas is for you.
With Canvas, you can:
- Create and personalize your work space with backgrounds, borders, colors, fonts, and more.
- Customize your workpad with your own visualizations, such as images and text.
- Pull your data directly from Elasticsearch, then show it off with charts, graphs, progress monitors, and more.
- Focus the data you want to display with filters.
To begin, open the main menu, then click Canvas.
For a quick overview of Canvas, watch Stand out with Canvas.
Create workpads
editA workpad provides you with a space where you can build presentations of your live data. With Canvas, you can create a workpad from scratch, start with a preconfigured workpad, import an existing workpad, or use a sample data workpad.
Start with a blank workpad
editTo use the background colors, images, and data of your choice, start with a blank workpad.
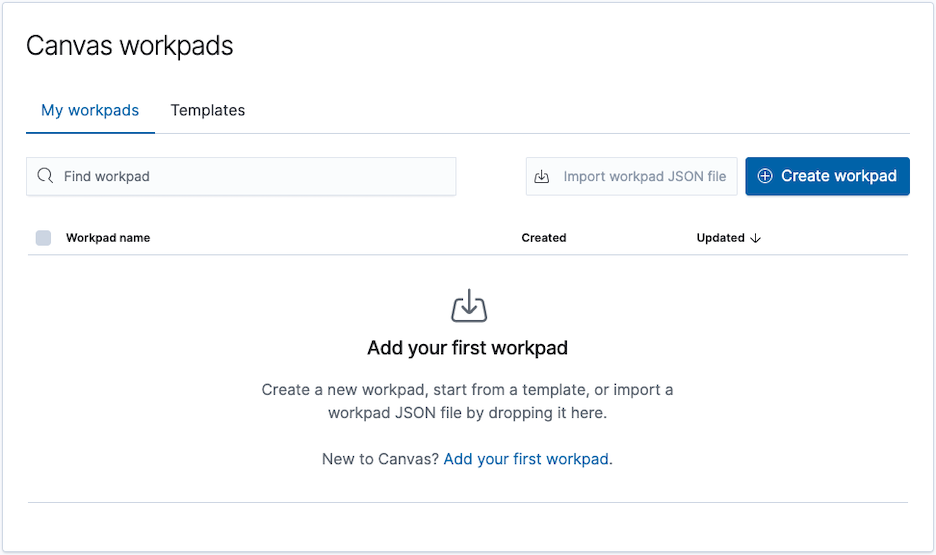
- On the Canvas workpads page, click Create workpad.
-
Specify the Workpad settings.
- Add a Name to your workpad.
- In the Width and Height fields, specify the size, or select one of default layouts.
-
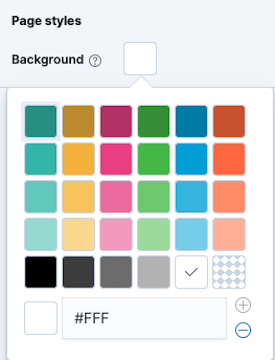
Click the Background color picker, then select the color for your workpad.
Create workpads from templates
editIf you’re unsure about where to start, you can use one of the preconfigured templates that come with Canvas.
- On the Canvas workpads page, select Templates.
- Click the preconfigured template that you want to use.
- Add your own Name to the workpad.
Import existing workpads
editWhen you want to use a workpad that someone else has already started, import the JSON file.
To begin, drag the file to the Import workpad JSON file field on the Canvas workpads page.
Use sample data workpads
editEach of the Kibana sample data sets comes with a workpad that you can use for your own workpad inspiration.
- Add a sample data set.
- On the Add Data page, click View data, then select Canvas.
Add elements
editCreate a story about your data by adding elements to your workpad that include images, text, charts, and more.
Create elements
editChoose the type of element you want to use, then use the preconfigured demo data to familiarize yourself with the element. When you’re ready, connect the element to your own data. By default, most of the elements you create use demo data until you change the data source. The demo data includes a small data set that you can use to experiment with your element.
To begin, click Add element, then select the element you want to use.

When you’re ready to connect the element to your data, select Data, then select one of the following data sources:
- Elasticsearch SQL — Access your data in Elasticsearch using SQL syntax.
- Elasticsearch documents — Access your data in Elasticsearch without using aggregations. To use, select an index and fields, and optionally enter a query using the Lucene Query Syntax. Use the Elasticsearch documents data source when you have low volume datasets, to view raw documents, or to plot exact, non-aggregated values on a chart.
- Timelion — Access your time series data using Timelion queries. To use Timelion queries, you can enter a query using the Lucene Query Syntax.
Each element can display a different data source, and pages and workpads often contain multiple data sources.
When you’re ready to save your element, select the element, then click Edit > Save as new element.
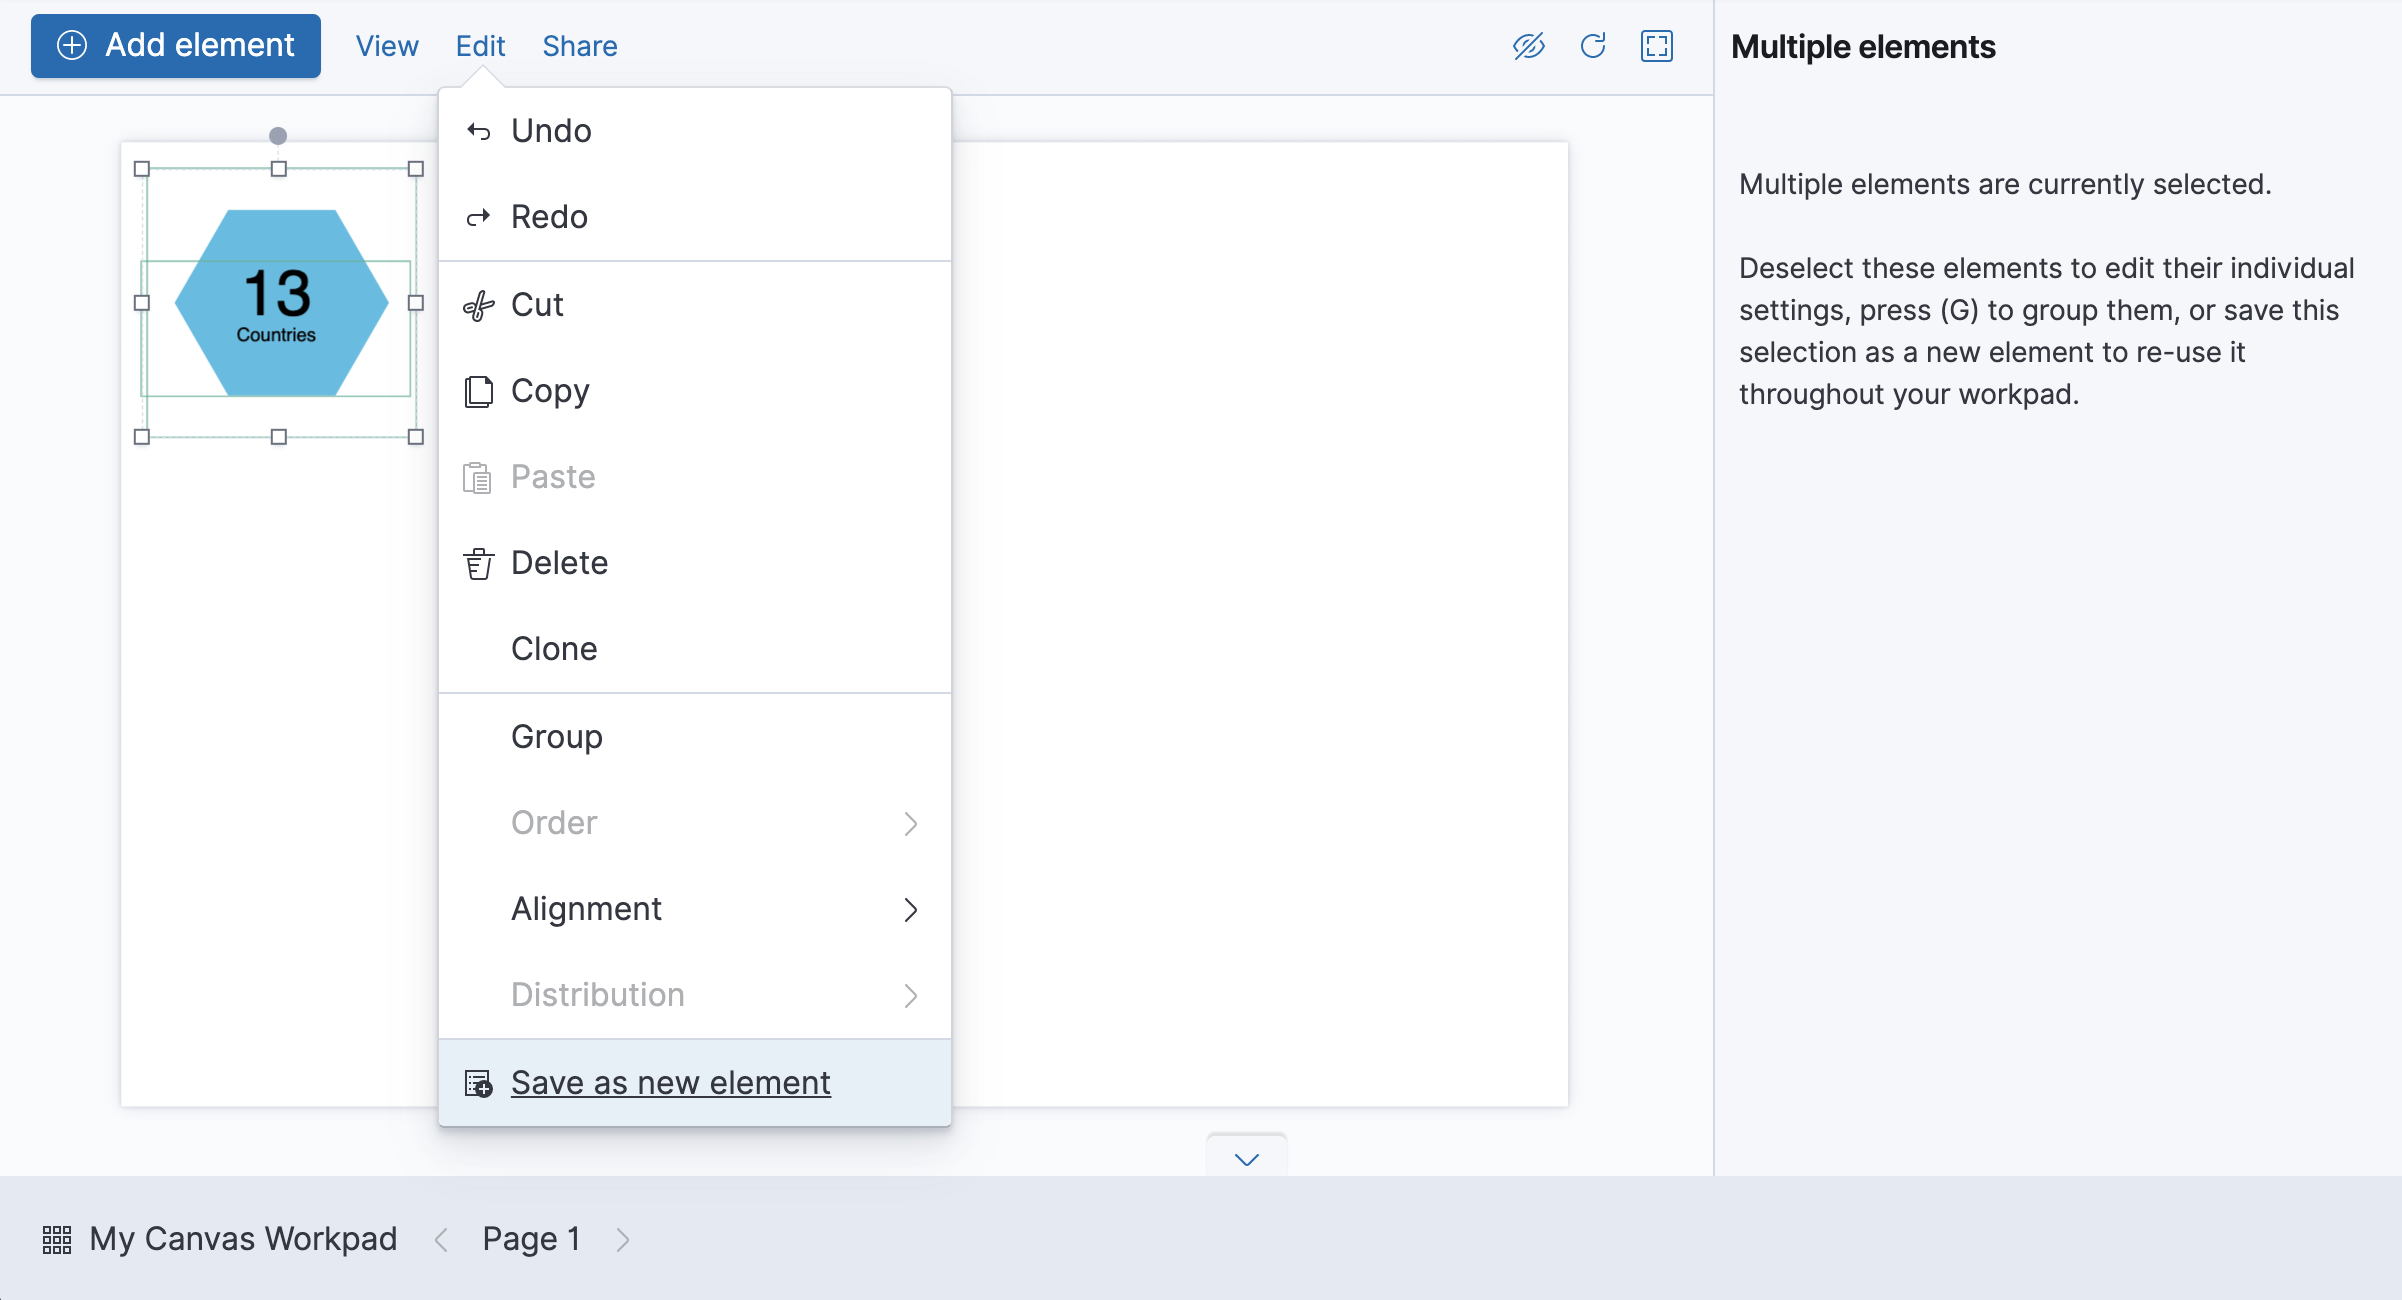
To save a group of elements, press and hold Shift, select the elements you want to save, then click Edit > Save as new element.
Elements are saved in Add element > My elements.
Add saved objects
editAdd saved objects to your workpad, such as maps and visualizations.
- Click Add element > Add from Kibana.
-
Select the saved object you want to add.
-
To use the customization options, click the panel menu, then select one of the following options:
- Edit map — Opens Maps or a visualization builder so that you can edit the original saved object.
- Edit panel title — Adds a title to the saved object.
- Customize time range — Exposes a time filter dedicated to the saved object.
- Inspect — Allows you to drill down into the element data.
Add your own images
editTo personalize your workpad, add your own logos and graphics.
- Click Add element > Manage assets.
- On the Manage workpad assets window, drag and drop your images.
-
To add the image to the workpad, click the Create image element icon.
Add pages
editOrganize and separate your ideas by adding more pages.
- Click Page 1, then click +.
-
On the Page editor panel, select the page transition from the Transition dropdown.