Getting Started
editGetting Started
editThe Search Profiler is automatically enabled in Kibana. Open the main menu, click Dev Tools, then click Search Profiler to get started.
Search Profiler displays the names of the indices searched, the shards in each index,
and how long it took for the query to complete. To try it out, replace the default match_all query
with the query you want to profile and click Profile.
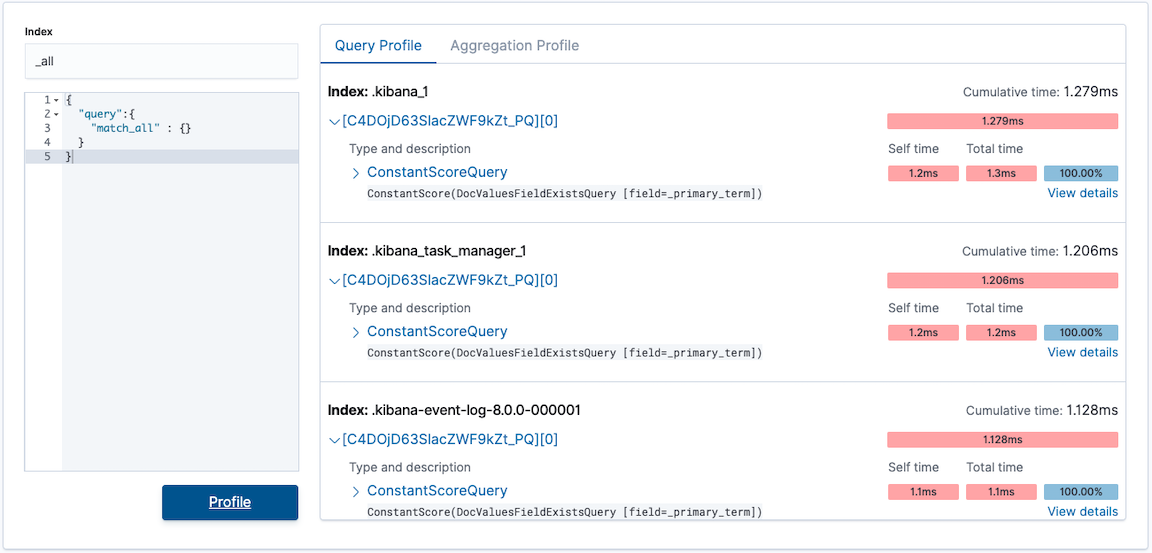
The following example shows the results of profiling the match_all query.
If we take a closer look at the information for the .kibana_1 sample index, the
Cumulative Time field shows us that the query took 1.279ms to execute.
The Cumulative Time metric is the sum of individual shard times. It is not necessarily the actual time it took for the query to return (wall clock time). Because shards might be processed in parallel on multiple nodes, the wall clock time can be significantly less than the Cumulative Time. However, if shards are colocated on the same node and executed serially, the wall clock time is closer to the Cumulative Time.
While the Cumulative Time metric is useful for comparing the performance of your indices and shards, it doesn’t necessarily represent the actual physical query times.
You can select the name of the shard and then click View details to see more profiling information, including details about the query component(s) that ran on the shard, as well as the timing breakdown of low-level Lucene methods. For more information, see Profiling queries.
Index and type filtering
editBy default, all queries executed by the Search Profiler are sent
to GET /_search. It searches across your entire cluster (all indices, all types).
If you need to query a specific index or type (or several), you can use the Index and Type filters.
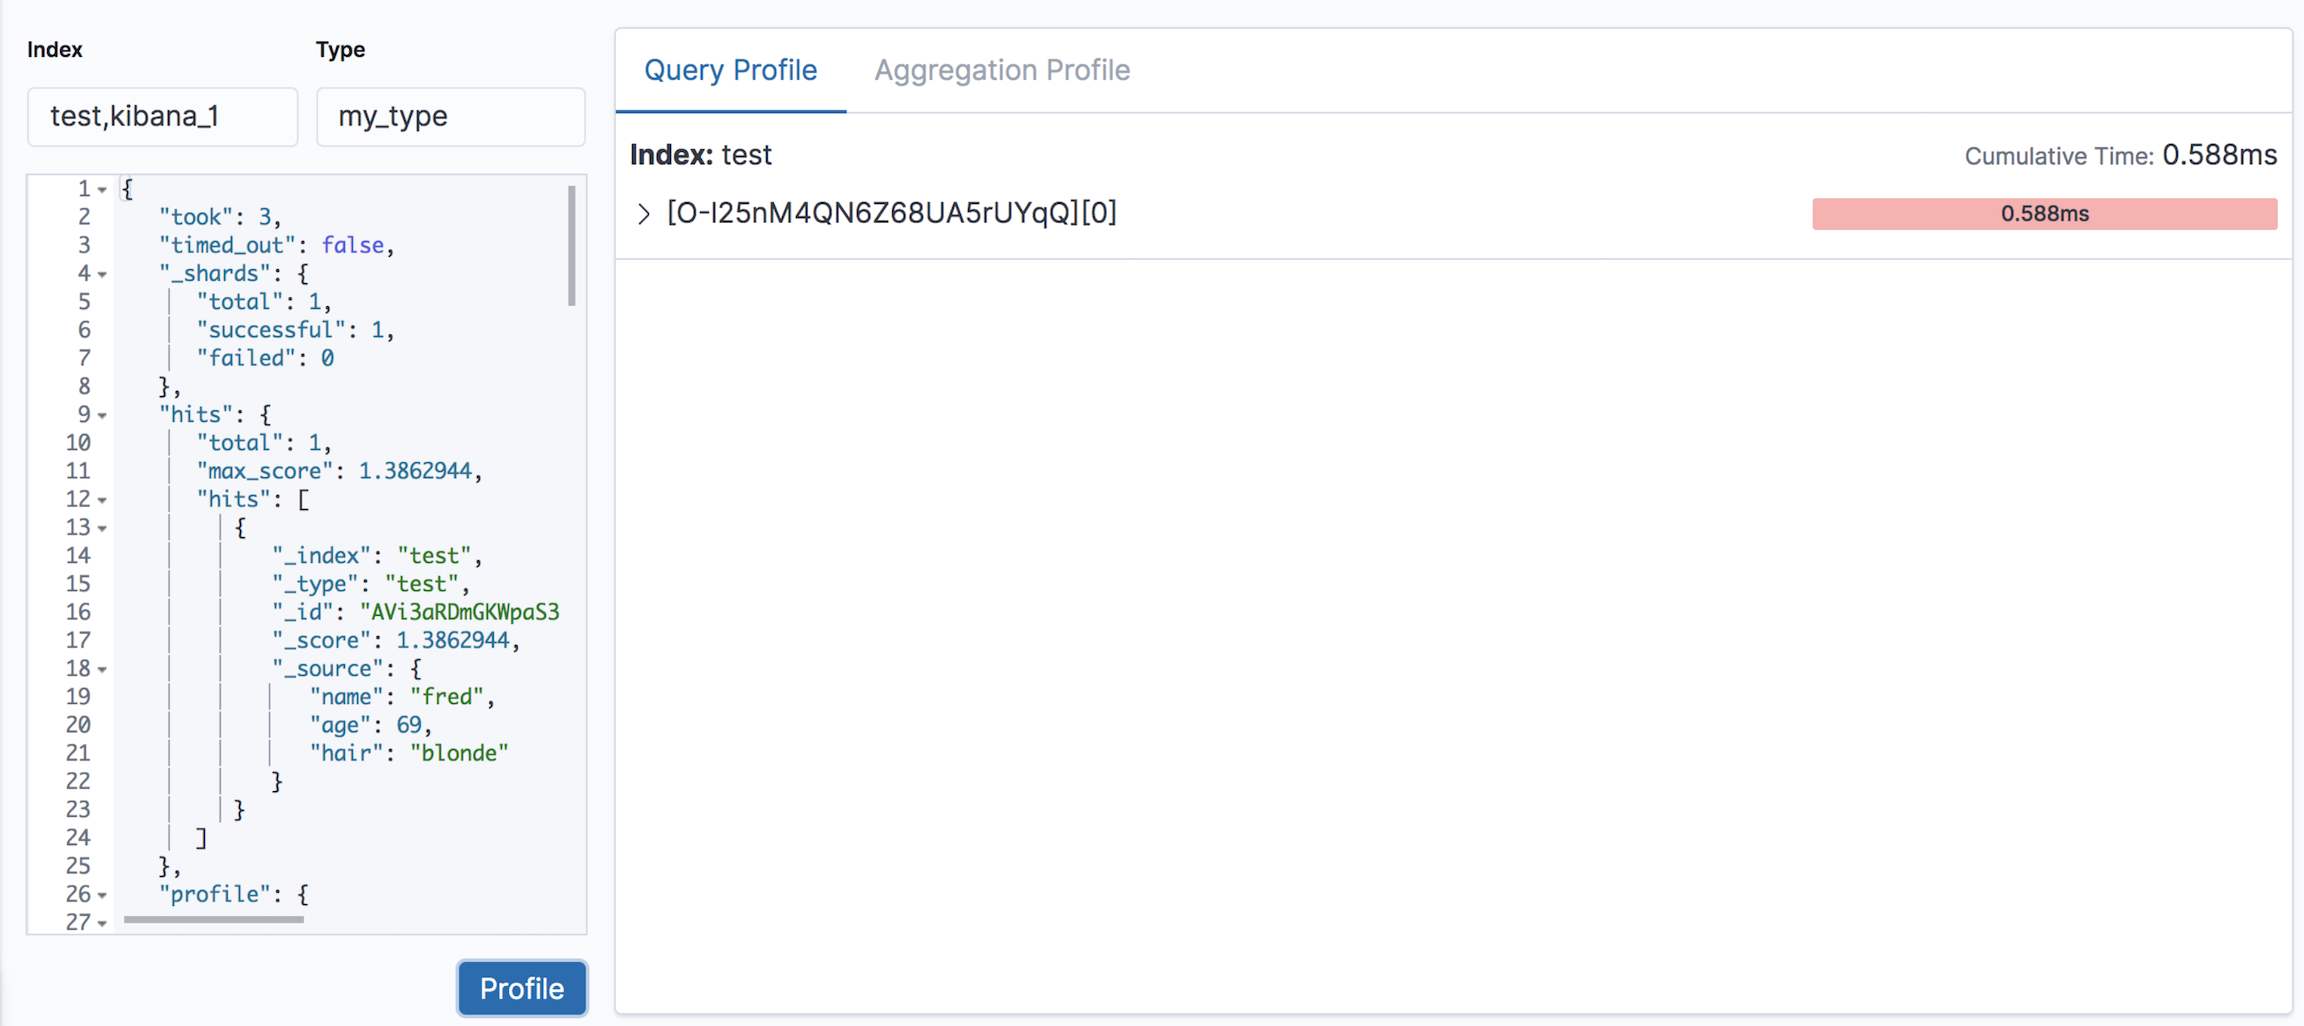
In the following example, the query is executed against the indices test and kibana_1
and the type my_type. This is equivalent making a request to GET /test,kibana_1/my_type/_search.