Kibana Alerts
editKibana Alerts
editThe Elastic Stack monitoring features provide Kibana alerts out-of-the box to notify you of potential issues in the Elastic Stack. These alerts are preconfigured based on the best practices recommended by Elastic. However, you can tailor them to meet your specific needs.
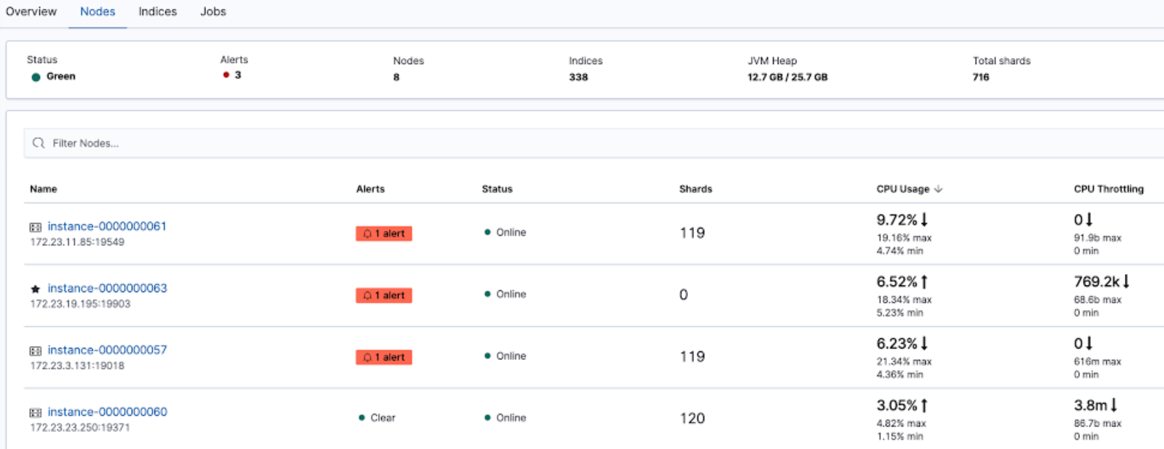
When you open Stack Monitoring, the preconfigured Kibana alerts are created automatically. If you collect monitoring data from multiple clusters, these alerts can search, detect, and notify on various conditions across the clusters. The alerts are visible alongside your existing Watcher cluster alerts. You can view details about the alerts that are active and view health and performance data for Elasticsearch, Logstash, and Beats in real time, as well as analyze past performance. You can also modify active alerts.

To review and modify all the available alerts, use Alerts and Actions in Stack Management.
CPU threshold
editThis alert is triggered when a node runs a consistently high CPU load. By default, the trigger condition is set at 85% or more averaged over the last 5 minutes. The alert is grouped across all the nodes of the cluster by running checks on a schedule time of 1 minute with a re-notify internal of 1 day.
Disk usage threshold
editThis alert is triggered when a node is nearly at disk capacity. By default, the trigger condition is set at 80% or more averaged over the last 5 minutes. The alert is grouped across all the nodes of the cluster by running checks on a schedule time of 1 minute with a re-notify internal of 1 day.
JVM memory threshold
editThis alert is triggered when a node runs a consistently high JVM memory usage. By default, the trigger condition is set at 85% or more averaged over the last 5 minutes. The alert is grouped across all the nodes of the cluster by running checks on a schedule time of 1 minute with a re-notify internal of 1 day.
Missing monitoring data
editThis alert is triggered when any stack products nodes or instances stop sending monitoring data. By default, the trigger condition is set to missing for 15 minutes looking back 1 day. The alert is grouped across all the nodes of the cluster by running checks on a schedule time of 1 minute with a re-notify internal of 6 hours.
Some action types are subscription features, while others are free. For a comparison of the Elastic subscription levels, see the alerting section of the Subscriptions page.