IMPORTANT: No additional bug fixes or documentation updates
will be released for this version. For the latest information, see the
current release documentation.
Adding a choropleth layer
edit
IMPORTANT: This documentation is no longer updated. Refer to Elastic's version policy and the latest documentation.
Adding a choropleth layer
editNow that you have a map, you’ll want to add layers to it. The first layer you’ll add is a choropleth layer to shade world countries by web log traffic. Darker shades symbolize countries with more web log traffic, and lighter shades symbolize countries with less traffic.
Add a vector layer from the Elastic Maps Service source
edit- In the map legend, click Add layer.
- Click the Vector shapes data source.
- From the Layer dropdown menu, select World Countries.
- Click the Add layer button.
-
Set Layer name to
Total Requests by Country. - Set Layer transparency to 0.5.
Join the vector layer with the sample web log index
editYou must add the web log traffic property to the world countries so
that the property is available for styling.
You’ll create a terms join to link the vector source World Countries to
the Elasticsearch index kibana_sample_data_logs on the shared key iso2 = geo.src.
-
Click plus
 to the right of Term Joins label.
- Click Join --select--
- Set Left field to ISO 3166-1 alpha-2 code.
- Set Right source to kibana_sample_data_logs.
- Set Right field to geo.src.
Set the vector style
editThe final step is to set the vector fill color to shade the countries by web log traffic.
-
Click
 to the right of Fill color.
- Select the grey color ramp.
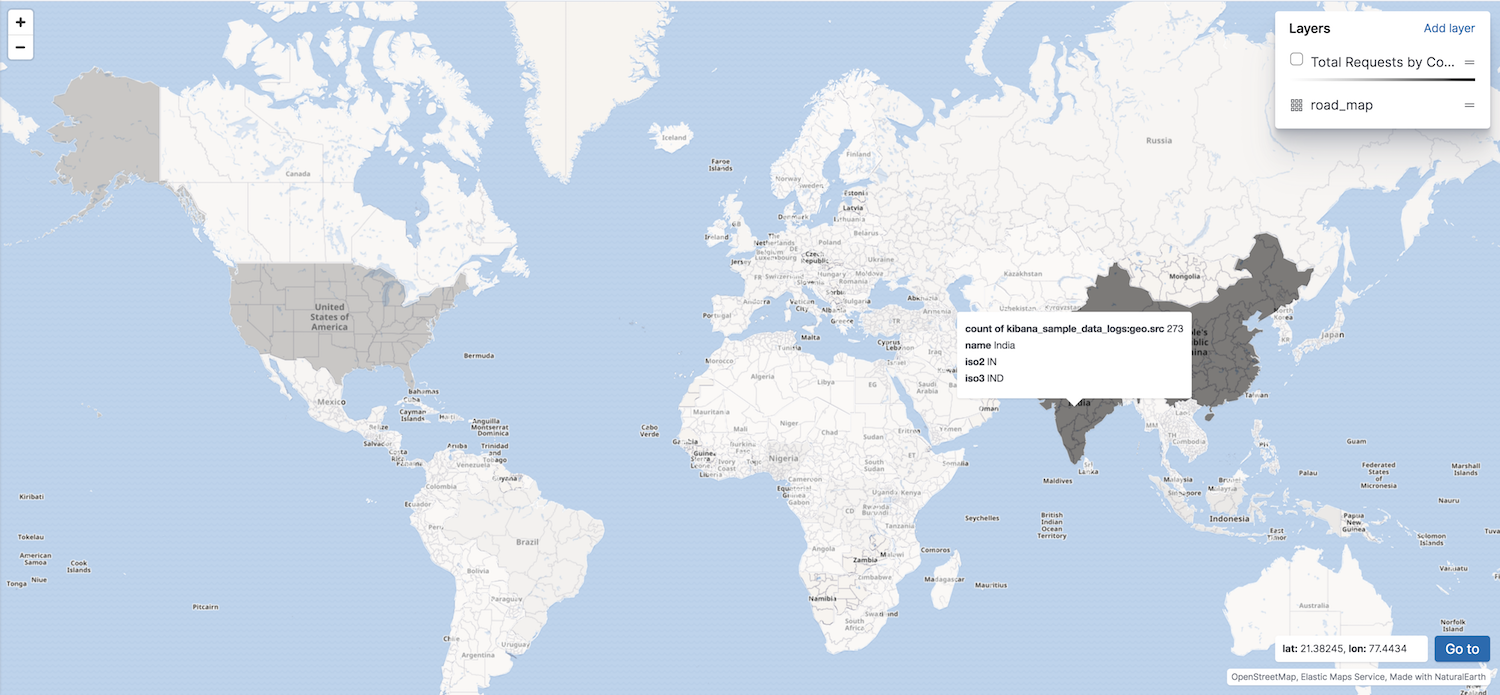
- In the field select input, select count of kibana_sample_data_logs:geo.src.
-
Click Save & close.
Your map now looks like this: