Advanced queries
editAdvanced queries
editThe query bar is a powerful data query feature. Similar to the query bar in Discover, it enables you to pass advanced queries on your data to filter on particular pieces of information that you’re interested in. It comes with a handy autocomplete that helps find the fields and even provides suggestions to the data they include. You can select the query bar and hit the down arrow on your keyboard to begin seeing recommendations.
When querying, you’re simply searching and selecting data from fields in Elasticsearch documents. It may be helpful to view some of your documents in Discover to better understand how APM data is stored in Elasticsearch.
The query bar is available in the Services, Transactions, Errors, Metrics, and Traces views, and any input will persist as you move between pages.
Interactions with the query bar change the URL of the page you’re on. This means you can simply copy and paste the URL of your page to share a specific query or view with others.
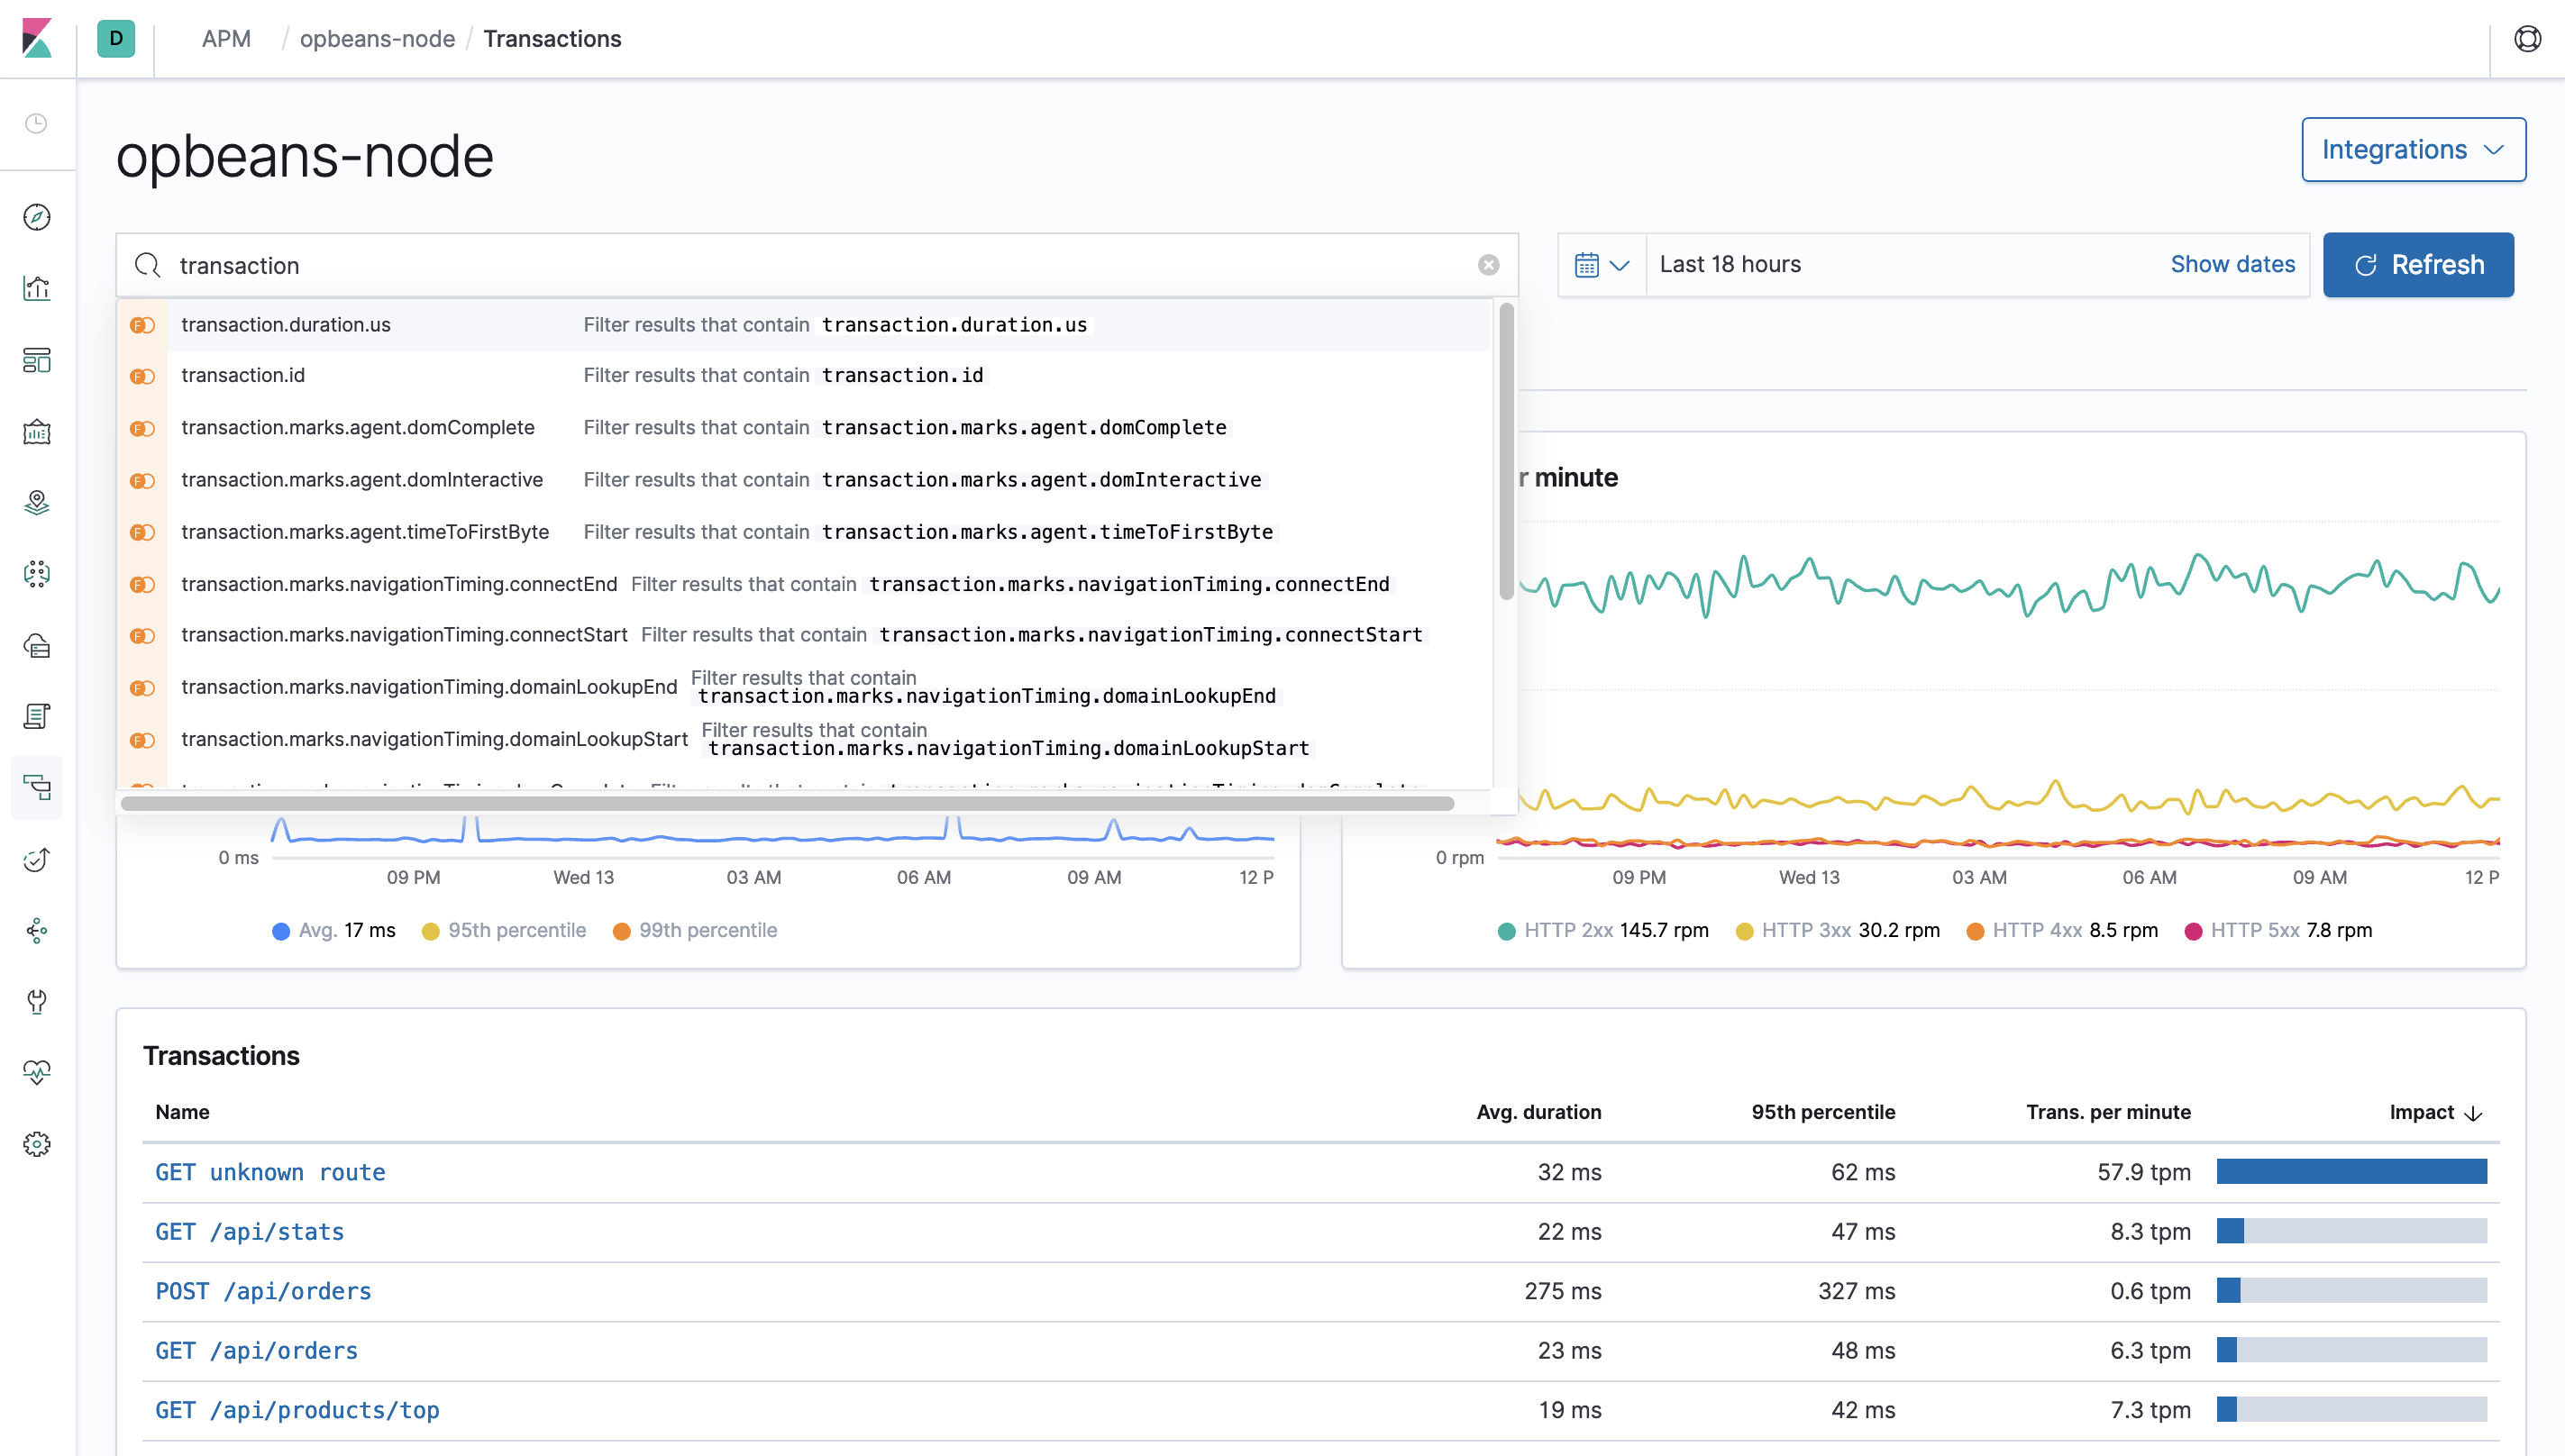
In the screenshot below, you can begin to see some of the transaction fields available for filtering on:
Example queries
edit-
Exclude response times slower than 2000 ms:
transaction.duration.us > 2000000 -
Filter by response status code:
context.response.status_code >= 400 -
Filter by single user ID:
context.user.id : 12 -
View all transactions for an endpoint, instead of just a sample -
processor.event: "transaction" AND transaction.name: "<TRANSACTION_NAME_HERE>"
Read the Kibana Query Language Enhancements documentation to learn more about the capabilities of the Kibana query language.