IMPORTANT: No additional bug fixes or documentation updates
will be released for this version. For the latest information, see the
current release documentation.
Getting started with Maps
edit
IMPORTANT: This documentation is no longer updated. Refer to Elastic's version policy and the latest documentation.
Getting started with Maps
editYou work with Maps by adding layers. The data for a layer can come from sources such as Elasticsearch documents, vector sources, tile map services, web map services, and more. You can symbolize the data in different ways. For example, you might show which airports have the longest flight delays by using circles from small to big. Or, you might show the amount of web log traffic by shading countries from light to dark.
Prerequisites
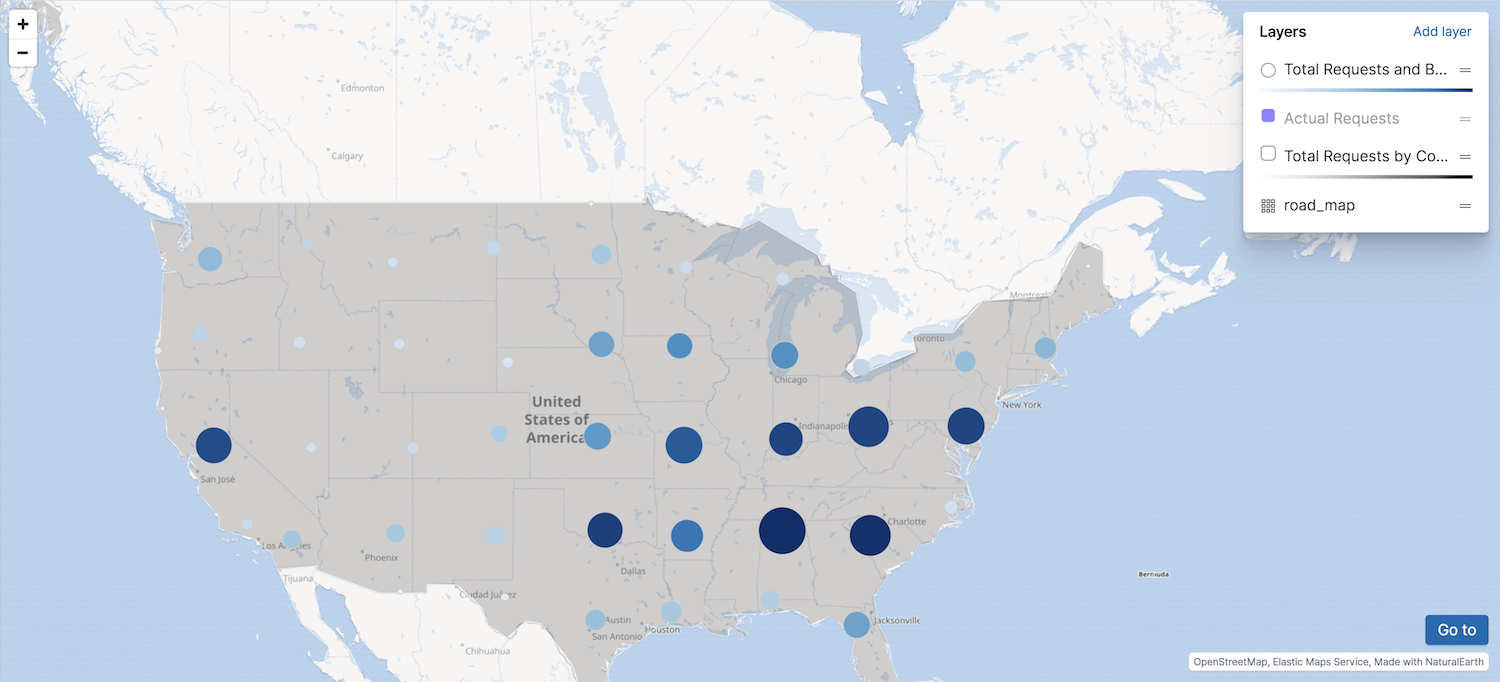
editBefore you start this tutorial, add the web logs sample data set. Each sample data set includes a map to go along with the data. Once you’ve added the data, open Maps and explore the different layers of the [Logs] Total Requests and Bytes map. You’ll re-create this map in this tutorial.
Take-away skills
editIn this tutorial, you’ll learn to:
- Create a multi-layer map
- Connect a layer to a data source
- Use symbols, colors, and labels to style a layer
- Create layers for Elasticsearch data