6.6.0 release highlights
edit6.6.0 release highlights
editEach release of Kibana brings new features and product improvements. Here are the highlights of the feature and user experience changes in 6.6.0.
Refer to the Kibana 6.6.0 Release Notes for a list of bug fixes and other changes.
Support for multiple Elasticsearch nodes
editFor increased stability, you can now define multiple Elasticsearch nodes for Kibana. This
prevents Kibana from being tied to a single Elasticsearch node while allowing for the
requests to be distributed over multiple nodes in the cluster. Simply set
elasticsearch.hosts in your kibana.yml file to the URLs of the Elasticsearch nodes you
want to use. You can also configure Kibana to automatically discover other nodes
in the cluster (elasticsearch.sniffOnStart) or on an interval (elasticsearch.sniffInterval).
For more information, see Kibana configuration settings.
Index lifecycle policies (beta)
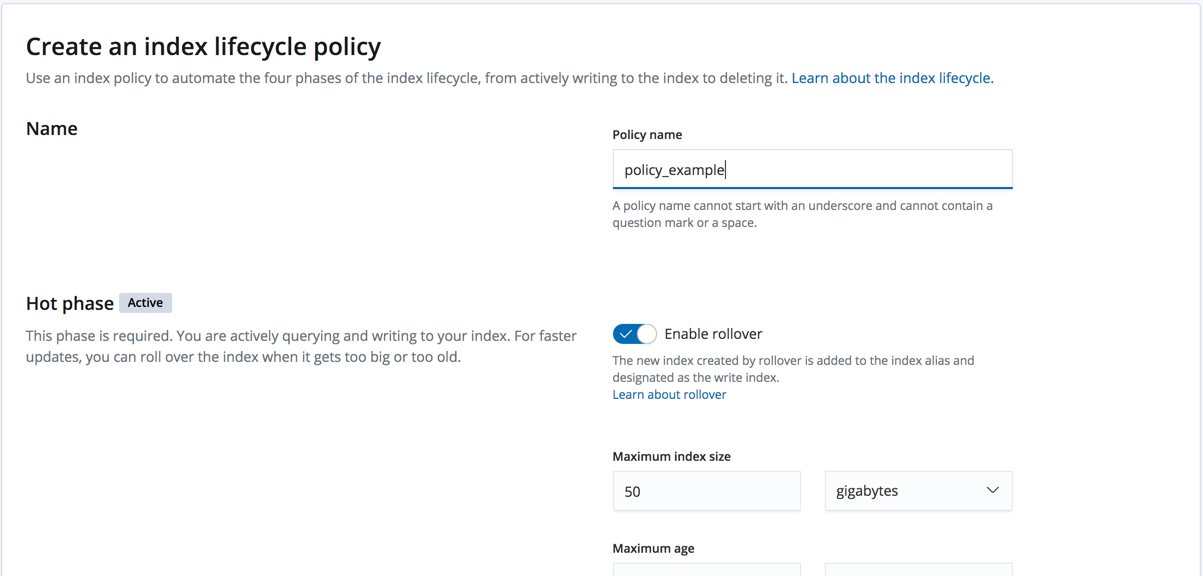
editKibana has additional Management user interfaces that provide a simple, user-friendly way to use advanced features. This version introduces Index Lifecycle Policies. If you use time series indices, this feature can help you keep your clusters tidy. You can create and manage index lifecycle policies, which automate actions such as rolling over an index, relocating shards to warm or cold nodes, merging shards, and deleting outdated indices. See Index lifecycle policies.
Remote clusters and Auto-follow pattern
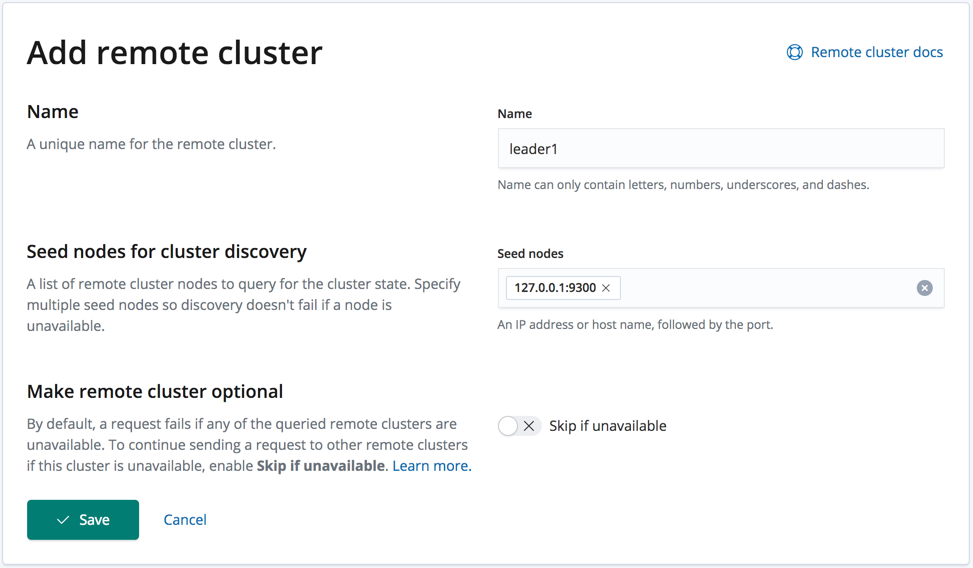
editKibana Management also has two new user interfaces for cross cluster replication. Remote clusters helps you manage your remote clusters for use with cross cluster search and cross cluster replication. You can add and remove remote clusters and check their connectivity.
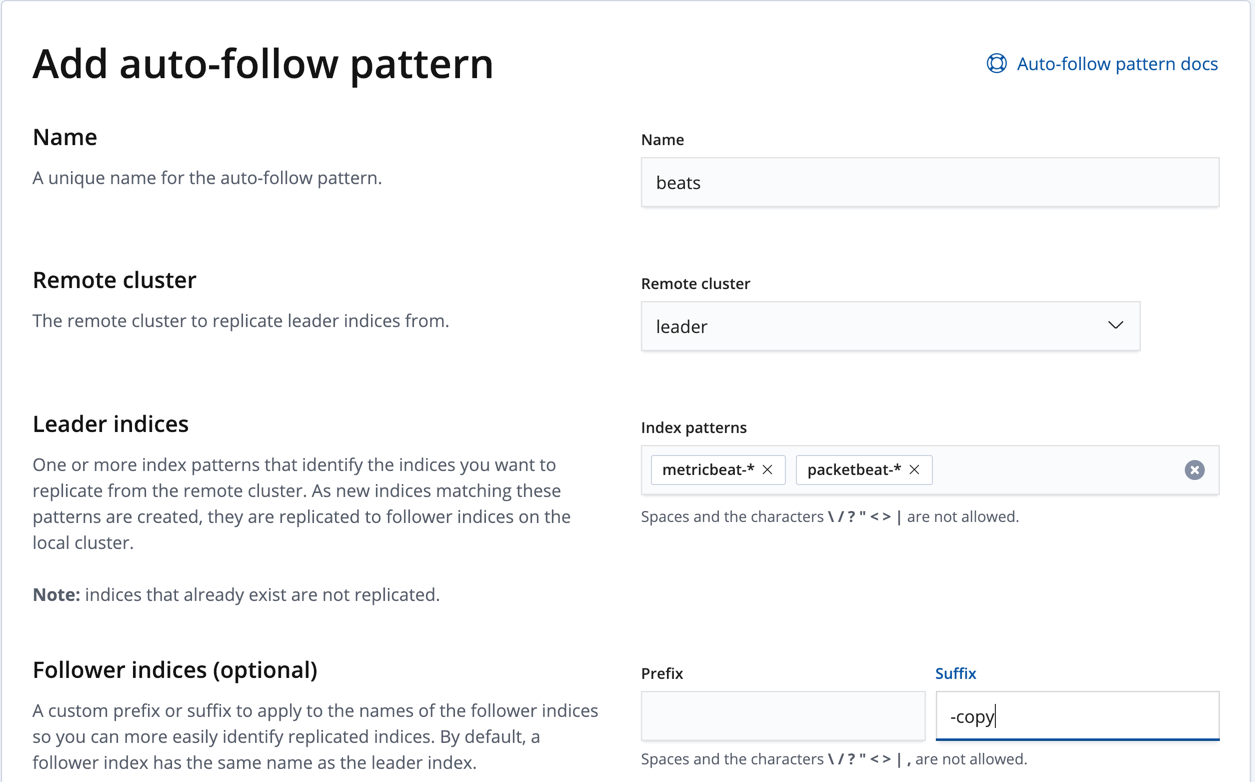
Auto-follow pattern helps you create and manage the remote replication process. You can follow an index pattern on the remote cluster for auto-discovery and then replicate new clusters that match the pattern.
Enhancements in Canvas (beta)
editQuite a few improvements made their way into Canvas.
Element grouping is now available—you can combine your favorite elements and manipulate them as one. Simply hold down the Shift key to select a few elements, and then press G to group them. To ungroup your grouped elements, press U.

This version also introduces the ability to copy and paste elements. You can copy elements between pages of your workpad and across different workpads.
If you’re a CSS guru and enjoy styling your elements with custom CSS, you’ll be excited to learn that Canvas supports global CSS across your entire workpad.
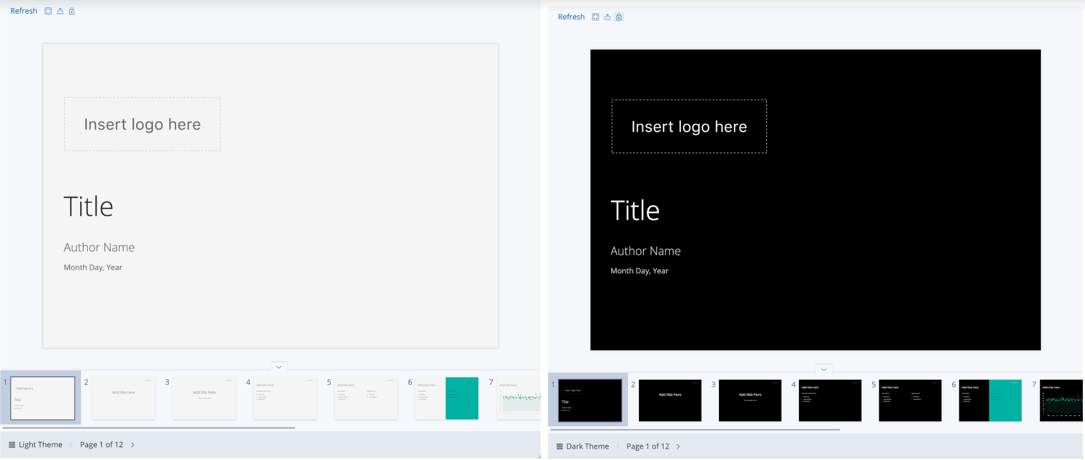
Finally, Canvas has two workpad templates to help you get started. You can choose between a light and a dark themed workpad. Look for the Templates tab on the Canvas home page.
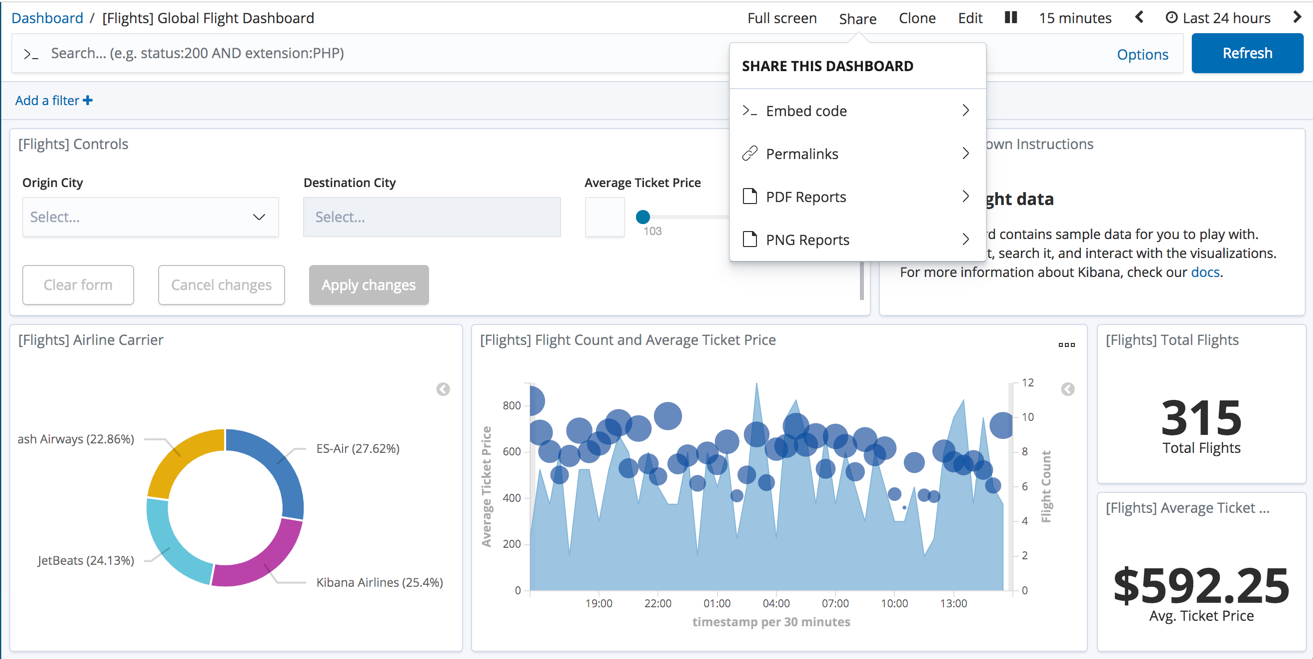
Reporting: Export dashboard to a png
editYou can now export dashboards as a PNG report. This makes it easier for you to share and embed your graphics in blogs, websites, and presentations. PNG reporting is available in the Share menu from the Kibana toolbar. You must have a Gold license to use Reporting features.
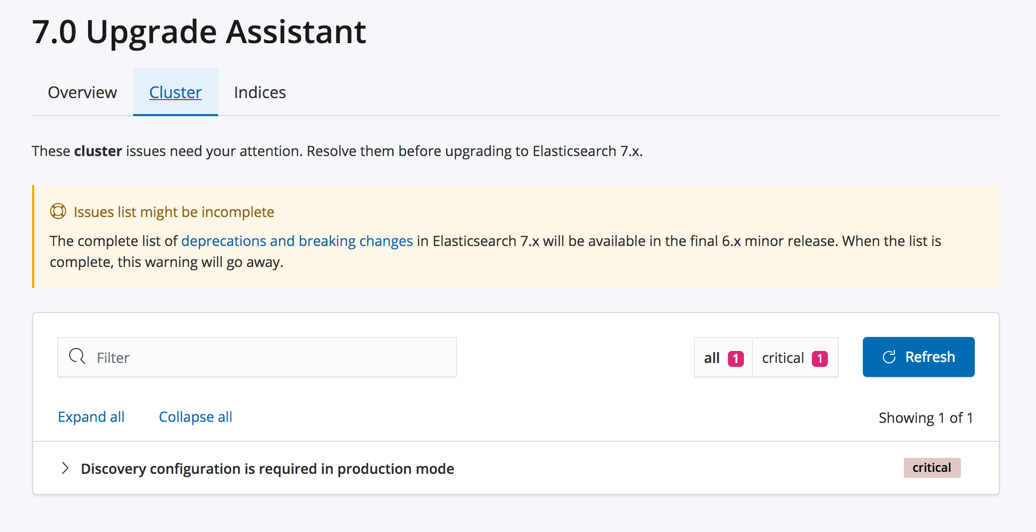
Upgrade Assistant for Elasticsearch 7.0
editKibana’s revised Upgrade Assistant can help you prepare for an upgrade from Elasticsearch 6.x to Elasticsearch 7.0. The assistant identifies issues you need to address before upgrading and simplifies the migration of indices that require reindexing. You’ll find this feature in Management > Elasticsearch > Upgrade Assistant.
Annotation of machine learning results
editYou can now add annotations by drag-selecting in the Single Metric Viewer charts. For example, you can annotate a time period to describe what is occurring in your operational environment or to explain why anomalies were detected. After you add annotations, they are also listed in the Anomaly Explorer and the Job Management page. Some annotations are also added automatically, for example when data is missing due to ingestion delays. See Machine learning.
Simplified creation of machine learning jobs for Auditbeat data
editIf you use Auditbeat to collect data about processes that are running in your system, there are machine learning wizards that recognize this type of data. They expedite the creation of customized jobs, dashboards, searches, and visualizations.
For example, you can select a supplied configuration to detect unusual processes in Docker containers:
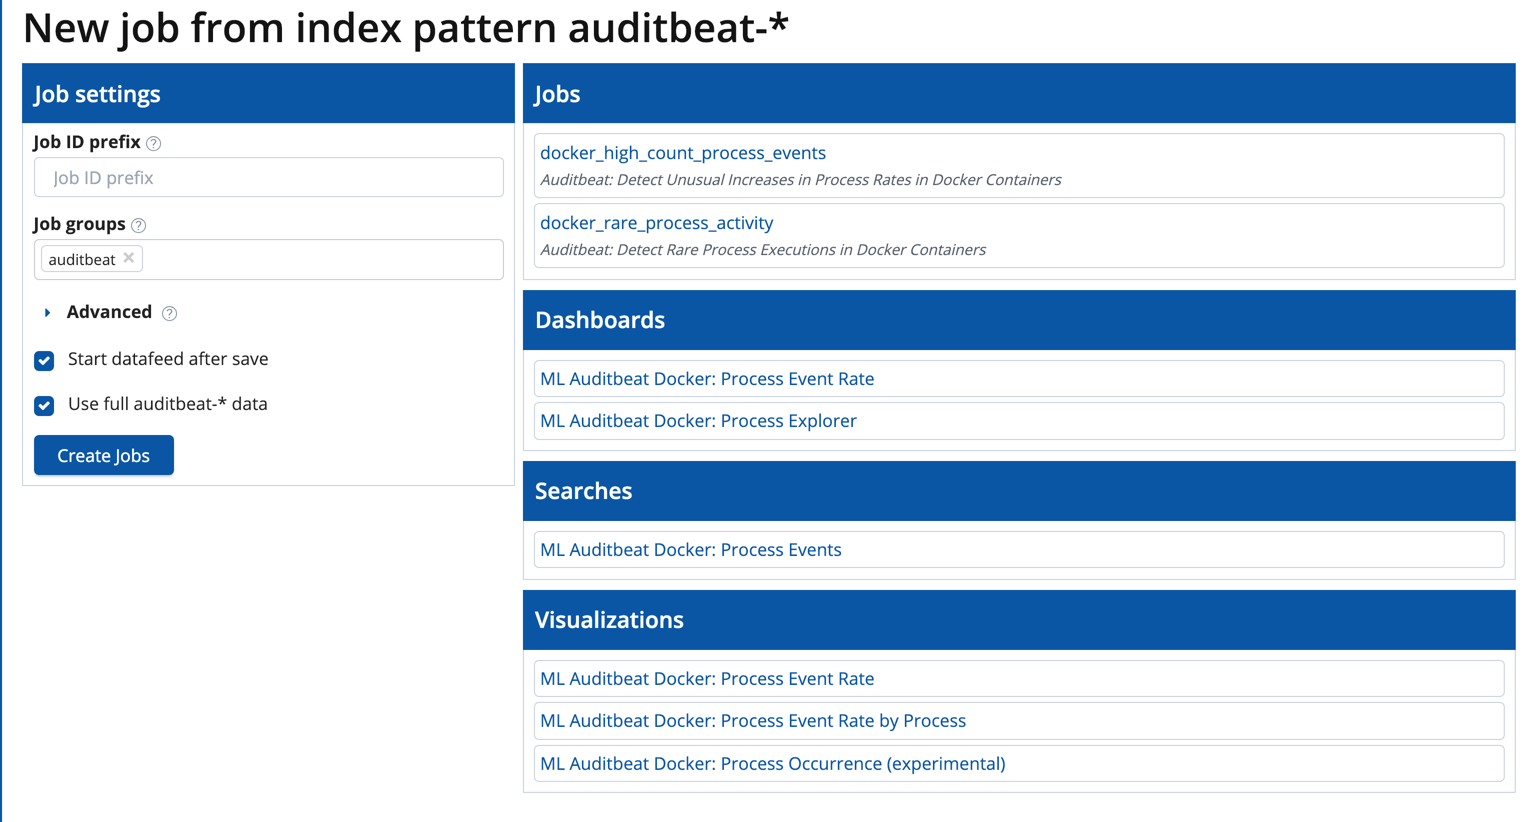
For more information, see Creating anomaly detection jobs.