6.3.0 Release Highlights
edit6.3.0 Release Highlights
editEach release of Kibana brings new features and product improvements. Here are the highlights of the features that were added in 6.3 and how the user experience improved.
Refer to the Kibana 6.3 Release Notes for a list bug fixes and other changes.
License management and X-Pack code
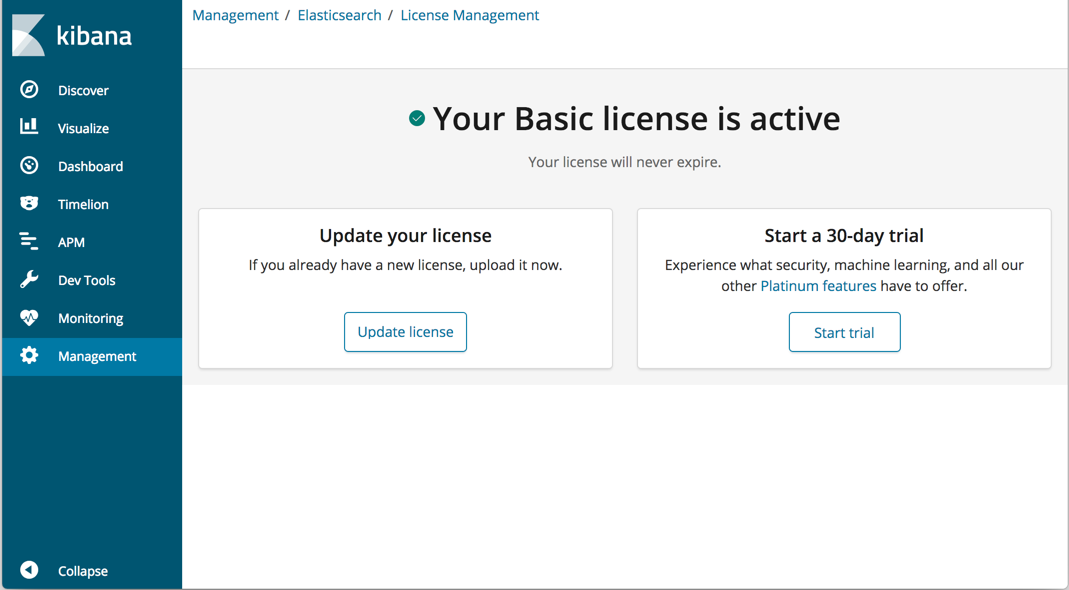
editStarting with version 6.3, all of the free X-Pack features, such as monitoring, CSV exports, Search Profiler, Grok Debugger, and dedicated APM UIs, ship with the default distribution of Kibana. When you install Kibana, it generates a Basic license with no expiration date.
You can view the status of your license, update your license, or start a 30-day trial of Platinum features in Management > License Management. The trial enables you to try out features such as security, machine learning, alerting, graph capabilities, and more.
For more information, see License Management.
Autocomplete in the query bar
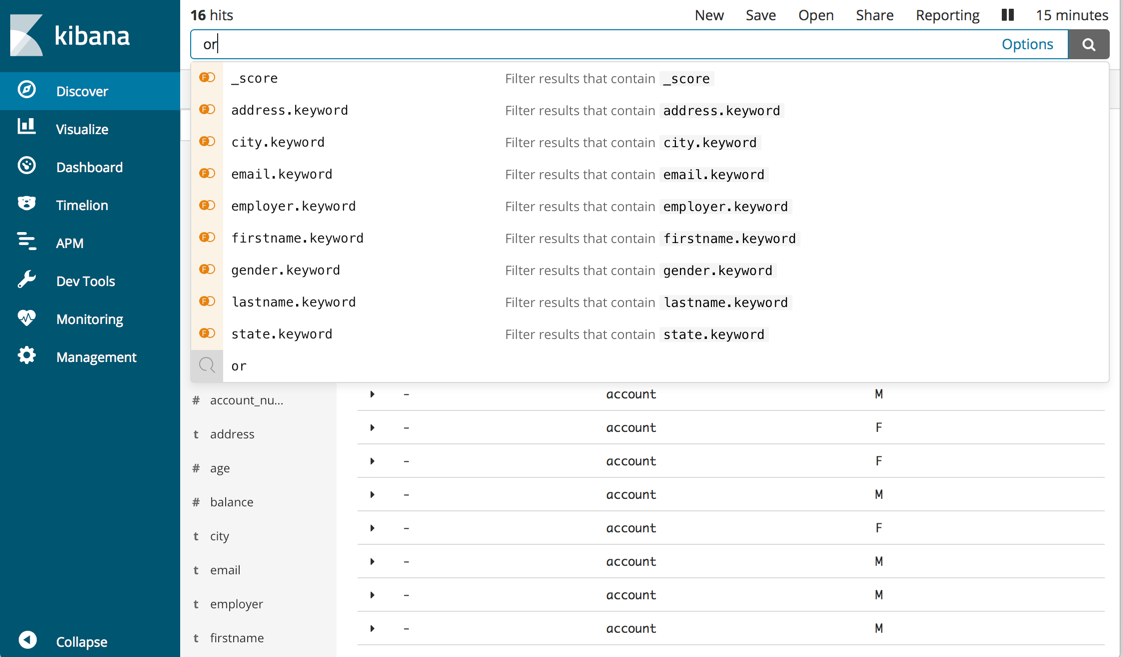
editKibana’s experimental autocomplete and simple syntax features can help you create queries. To turn these features on, click Options on the right of the query bar and opt in. Once enabled, just start typing in the query bar, and you’ll get suggestions for fields, values for keyword fields, and query operators.
Return to recently viewed content
editKibana now keeps track of your recently viewed items so that you can easily get back to them. Here’s how:
- Your last five recently viewed items are listed at the top of the home page. A dropdown menu provides access to views further back in history.
- Your recently selected time ranges are listed in the Recent tab in the time picker.
Smaller grid dimensions for dashboards
editKibana 6.3 gives you more control over panel sizes when creating a dashboard. This gives you better control over the layout. Here are the changes:
- The grid height of the dashboard was decreased from 100 pixels to 20 pixels.
- The number of columns in the grid was increased from 12 to 48.
Chained input controls
editThe Controls visualization now enables you to chain dropdown menus. When chained, the value selected in the first menu filters the terms in the second menu. A chained menu is only enabled when its ancestor controls have values.
Index Management UI
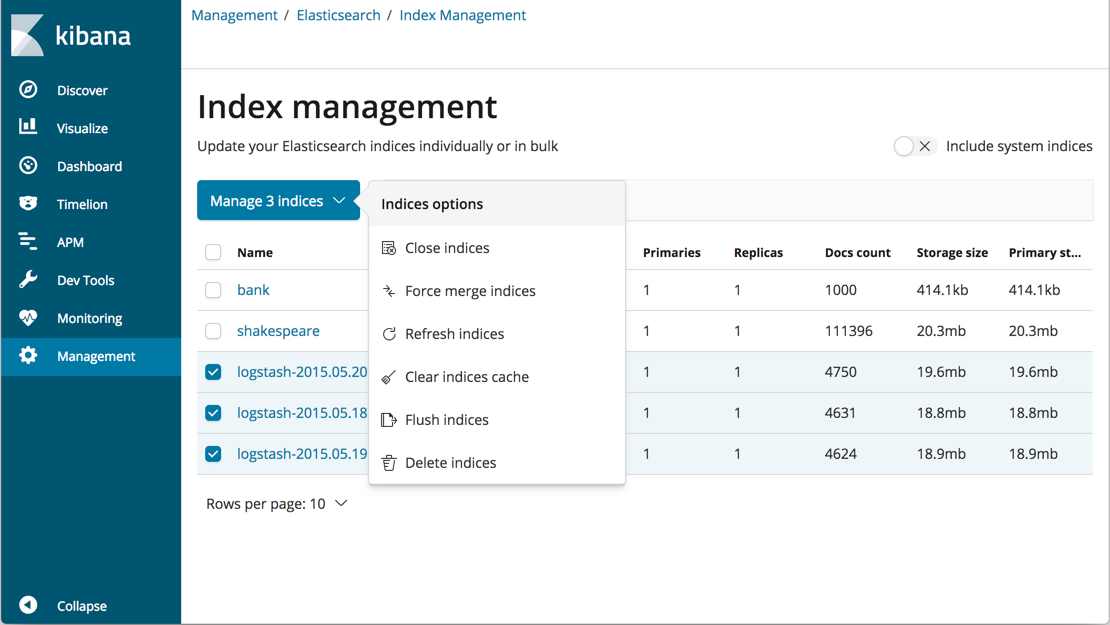
editThe new Index management UI enables you to view index settings, mappings, and statistics and perform management operations. These include refreshing, flushing, clearing the cache, merging segments, and closing or deleting indices. The UI provides a convenient way to perform bulk operations on multiple indices.
Interactive map support in Vega
editYou can now use Vega graphs to overlay a geographic data visualization on a map. To start a Vega visualization, open the Visualization application and click the + button. Scroll to the Others section and select Vega.
Easily enable monitoring from the UI
editIn 6.3, the first time you open Kibana monitoring, data collection is disabled, and you are prompted to turn it on. If you have permission to turn on data collection, and there is data in the cluster, Kibana displays the monitoring dashboards. If Kibana can’t activate monitoring, you’ll get a message with suggestions to try.
Enhancements to the Console
editThe autocompletion feature in the Dev Tools Console is now expanded to use all Kibana and Basic X-Pack APIs.
APM Watcher Assistant
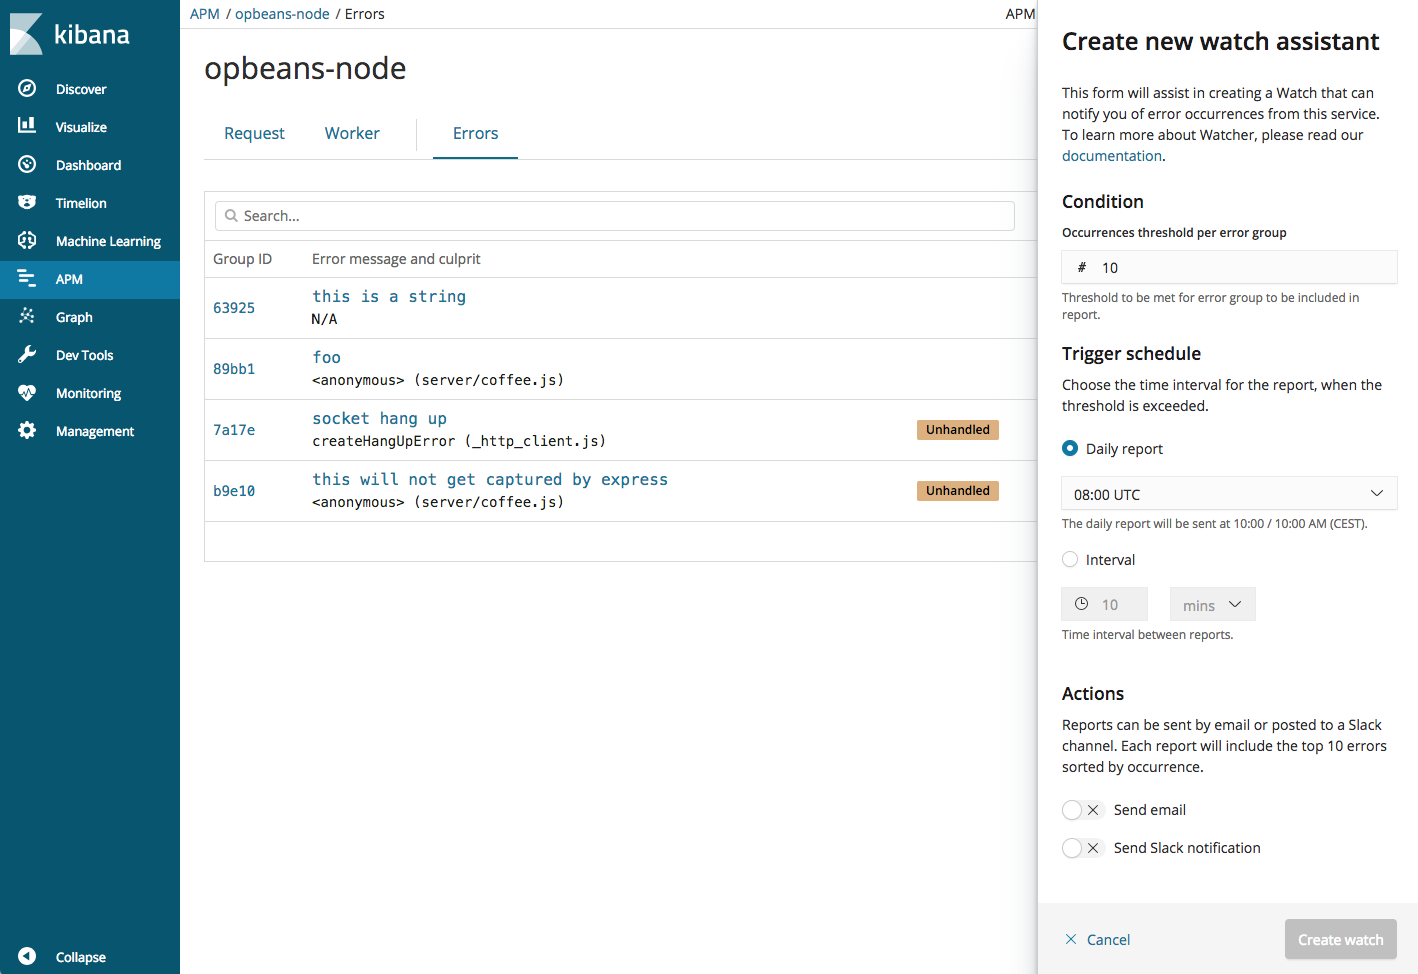
editThe new Watcher assistant UI enables you to easily generate watches that alert you to errors in your APM data. You can specify an error group occurrence threshold and a trigger schedule. At a fixed interval (minutes/hours/daily), you will get an email or slack notification if an error group has more than the specified number of occurrences.
Job validation
editThere is now an option in the machine learning job creation wizards to validate your choices before you create the job. The wizards provide advice based on your settings and the characteristics of your data. For example, you might be advised to reconsider your bucket span or choice of influencers. By heeding these suggestions, you can create jobs that are more likely to produce insightful machine learning results. For more information, see Job tips.
Custom URL improvements
editThe inclusion of custom URLs in your machine learning jobs enables users to follow links from the anomalies table in the Anomaly Explorer and the Single Metric Viewer to your URL of choice. For example, you could create a link to an operational dashboard that provides contextual information to help explain the anomaly. The custom URL can include targeted date ranges and optional query parameters as string substitutions. As a result, custom URLs have been challenging to create. In 6.3, when you edit your job in Kibana, there are new custom URL options to help you create a link to the Discover page, new controls for configuring the time range of the target page, and a button to test the URL.