Machine learning
editMachine learning
editAs datasets increase in size and complexity, the human effort required to inspect dashboards or maintain rules for spotting infrastructure problems, cyber attacks, or business issues becomes impractical. The Elastic machine learning anomaly detection feature automatically model the normal behavior of your time series data — learning trends, periodicity, and more — in real time to identify anomalies, streamline root cause analysis, and reduce false positives.
Anomaly detection run in and scale with Elasticsearch, and include an intuitive UI on the Kibana Machine Learning page for creating anomaly detection jobs and understanding results.
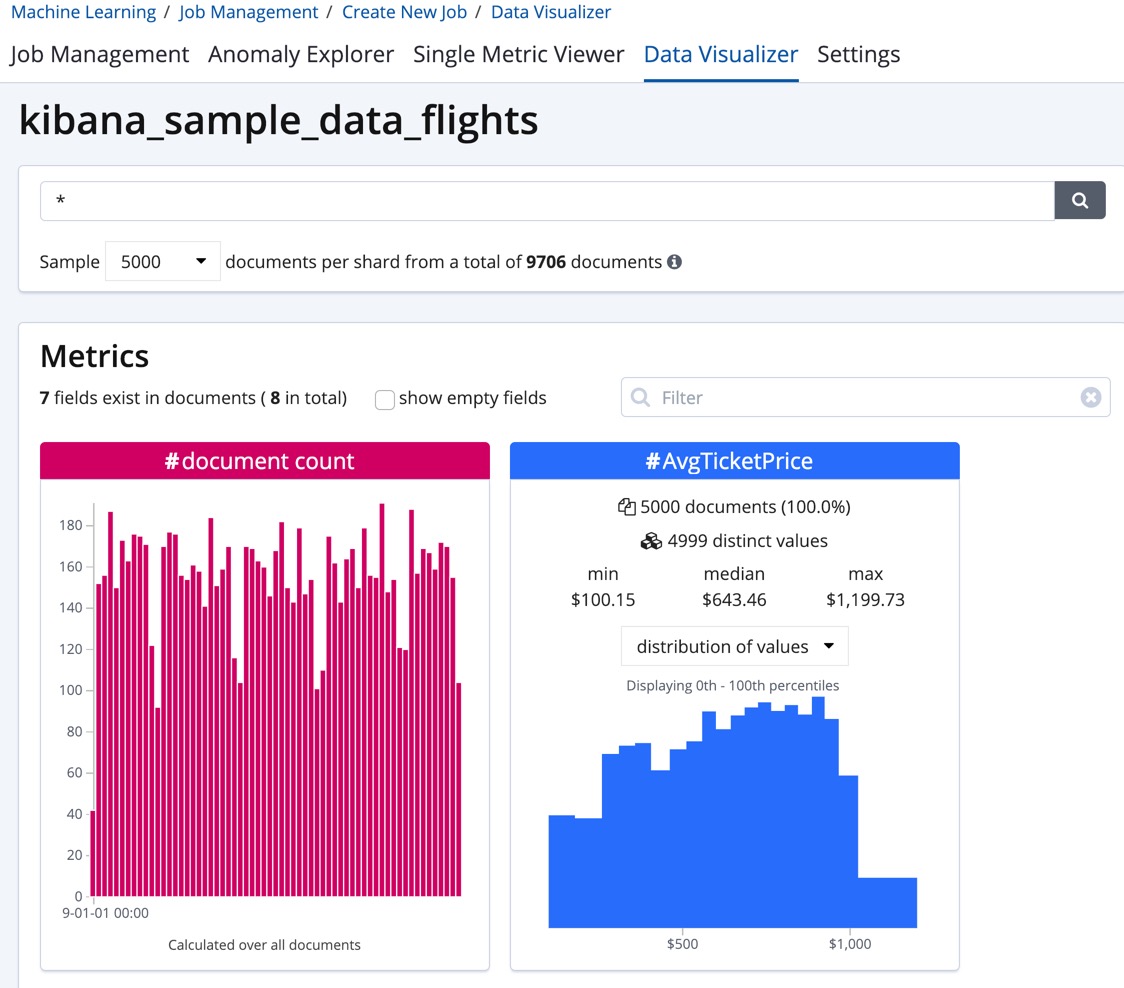
If you have a basic license, you can use the Data Visualizer to learn more about your data. In particular, if your data is stored in Elasticsearch and contains a time field, you can use the Data Visualizer to identify possible fields for anomaly detection:
[preview] This functionality is in technical preview and may be changed or removed in a future release. Elastic will work to fix any issues, but features in technical preview are not subject to the support SLA of official GA features. You can also upload a CSV, NDJSON, or log file (up to 100 MB in size). The Data Visualizer identifies the file format and field mappings. You can then optionally import that data into an Elasticsearch index.
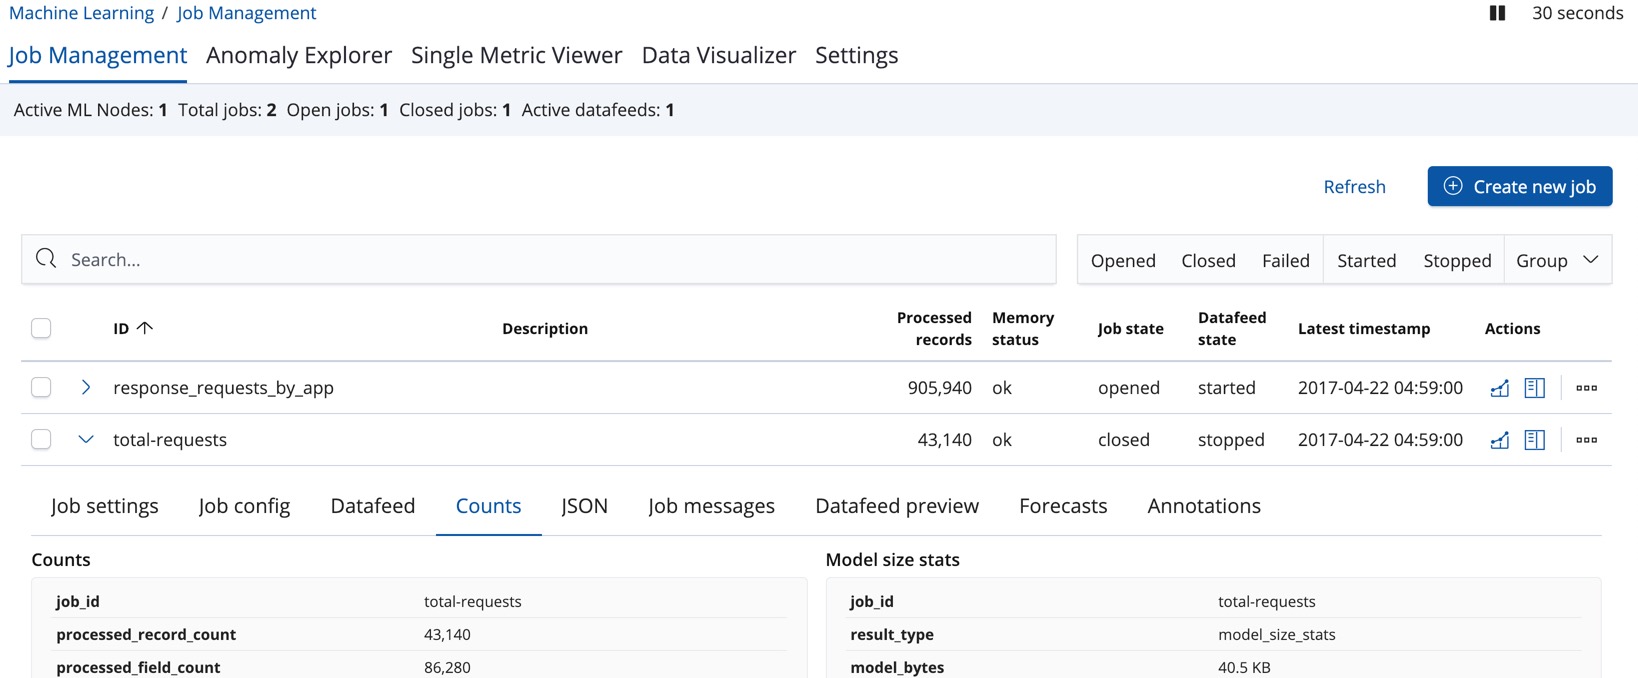
If you have a trial or platinum license, you can create anomaly detection jobs and manage jobs and datafeeds from the Job Management pane:
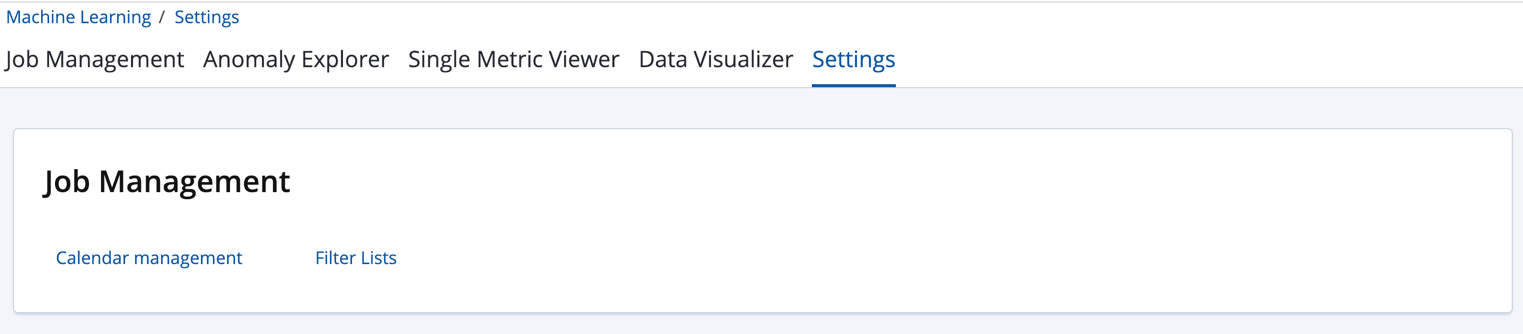
You can use the Settings pane to create and edit calendars and the filters that are used in custom rules:
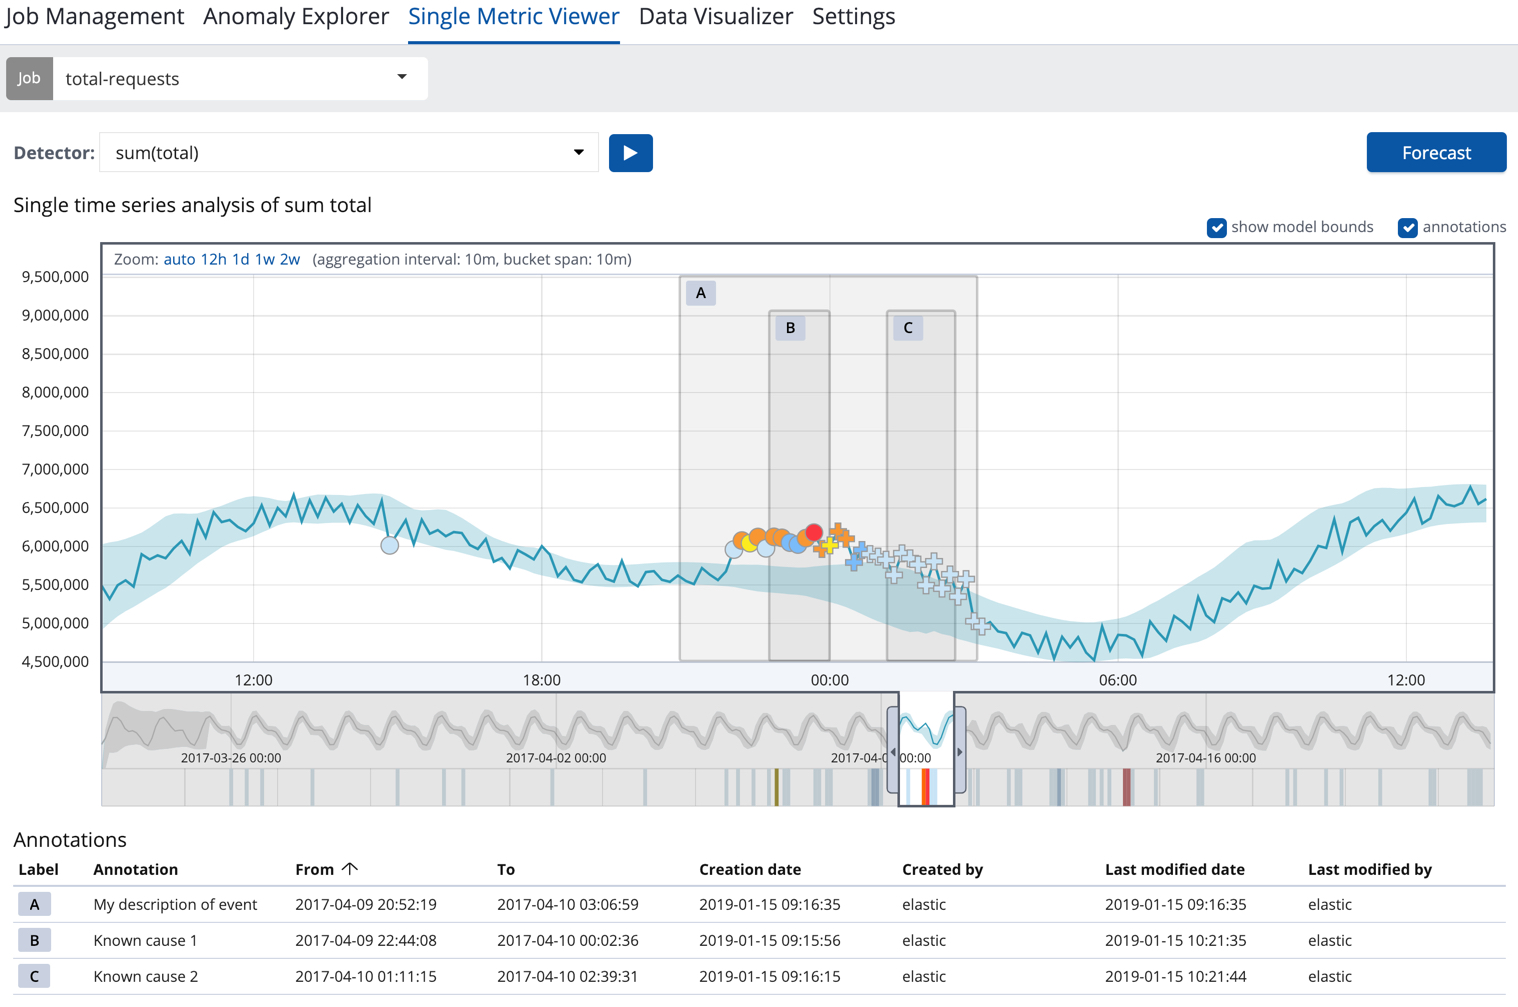
The Anomaly Explorer and Single Metric Viewer display the results of your anomaly detection jobs. For example:
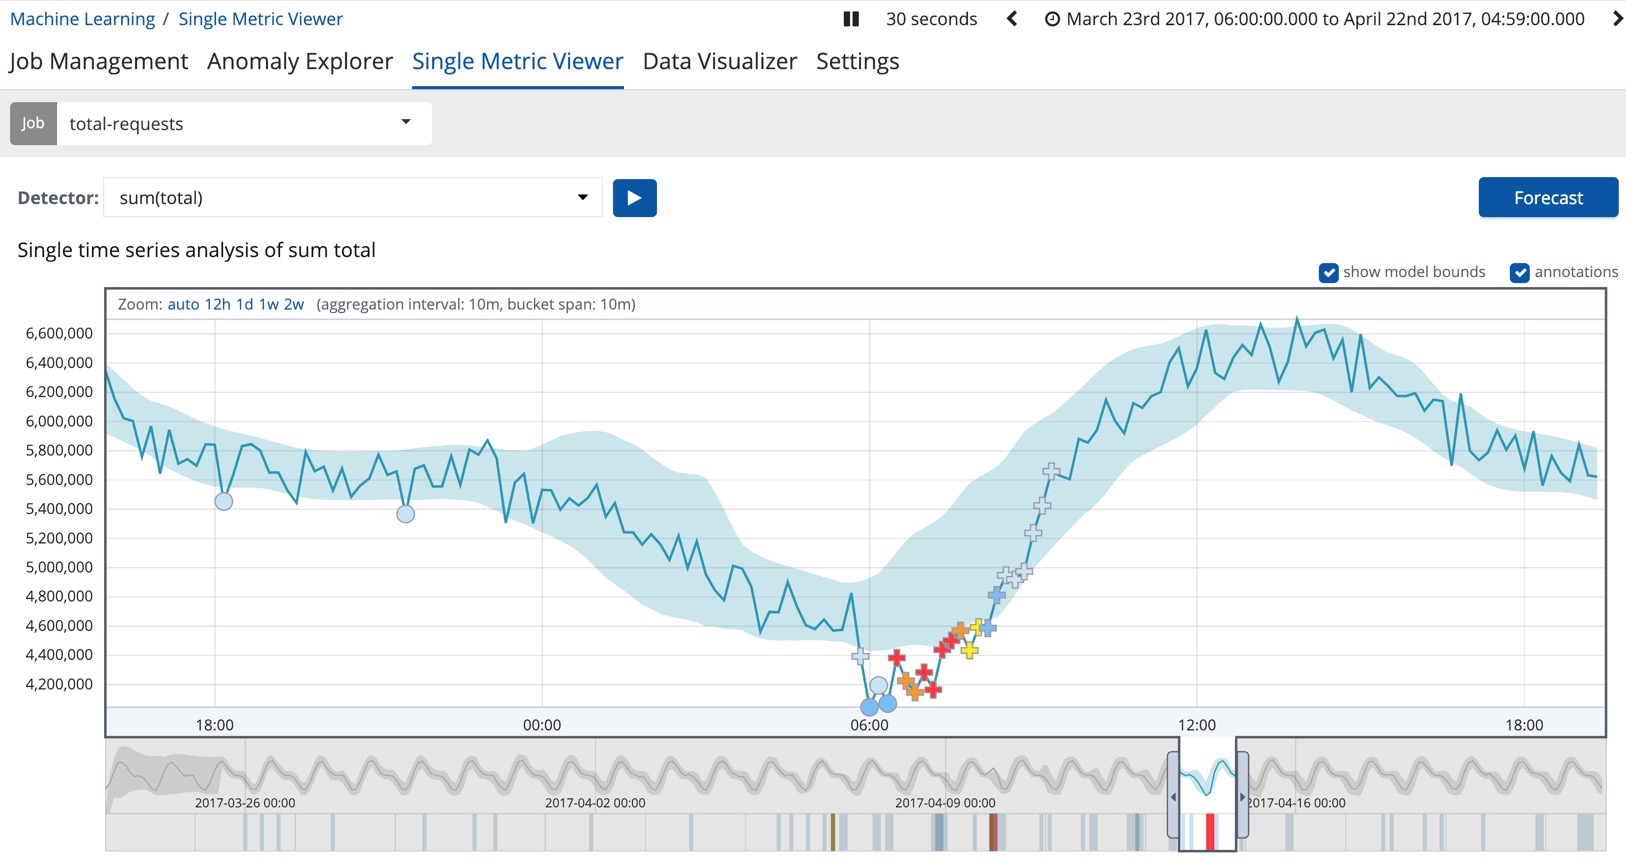
You can optionally add annotations by drag-selecting a period of time in the Single Metric Viewer and adding a description. For example, you can add an explanation for anomalies in that time period or provide notes about what is occurring in your operational environment at that time:
In some circumstances, annotations are also added automatically. For example, if the anomaly detection job detects that there is missing data, it annotates the affected time period. For more information, see Handling delayed data. The Job Management pane shows the full list of annotations for each job.
The Kibana machine learning features use pop-ups. You must configure your web browser so that it does not block pop-up windows or create an exception for your Kibana URL.
For more information about the anomaly detection feature, see Machine learning anomaly detection.