Infrastructure
editInfrastructure
editThis functionality is in beta and is subject to change. The design and code is less mature than official GA features and is being provided as-is with no warranties. Beta features are not subject to the support SLA of official GA features.
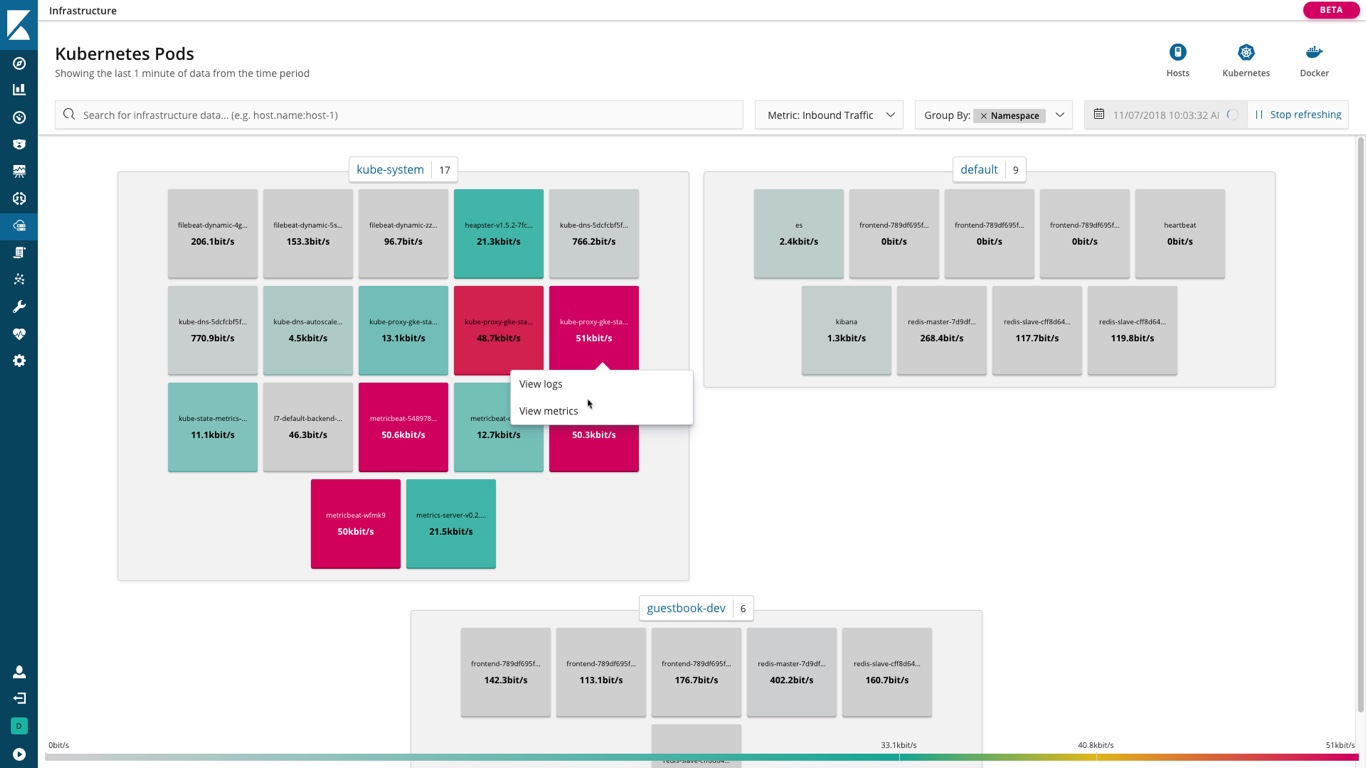
Use the interactive Infrastructure UI to monitor your infrastructure and identify problems in real time. You can explore metrics and logs for common servers, containers, and services.
Add data sources
editKibana provides step-by-step instructions to help you add your data sources. The Infrastructure Monitoring Guide is a good source for more detailed instructions and information.
Configure data sources
editBy default the Infrastructure UI uses the metricbeat-* index pattern to query the data. If you configured Metricbeat to export data to a different set of indices, you will need to set xpack.infra.sources.default.metricAlias in config/kibana.yml to match your index pattern. You can also configure the timestamp field by overriding xpack.infra.sources.default.fields.timestamp. See Infrastructure UI Settings for a complete list.