Getting Started
editGetting Started
editSystem Setup
editX-Pack reporting is automatically enabled in Kibana. The first time Kibana runs, it extracts a custom build for the Chromium web browser, which runs on the server in headless mode to load Kibana and capture the rendered Kibana charts as images.
Chromium is an open-source project not related to Elastic, but the Chromium binary for Kibana has been custom-built by Elastic to ensure it works with minimal setup. However, the Kibana server OS might still require additional dependencies for Chromium. See the Reporting Troubleshooting section for more information about the system dependencies for different operating systems.
Generating a Report Manually
edit-
Open Kibana in your web browser and log in. If you are running Kibana
locally, go to
http://localhost:5601. To access Kibana and generate reports, you need thekibana_userandreporting_userroles. For more information, see Reporting and Security. - Open the dashboard, visualization, or saved search you want to include in the report.
-
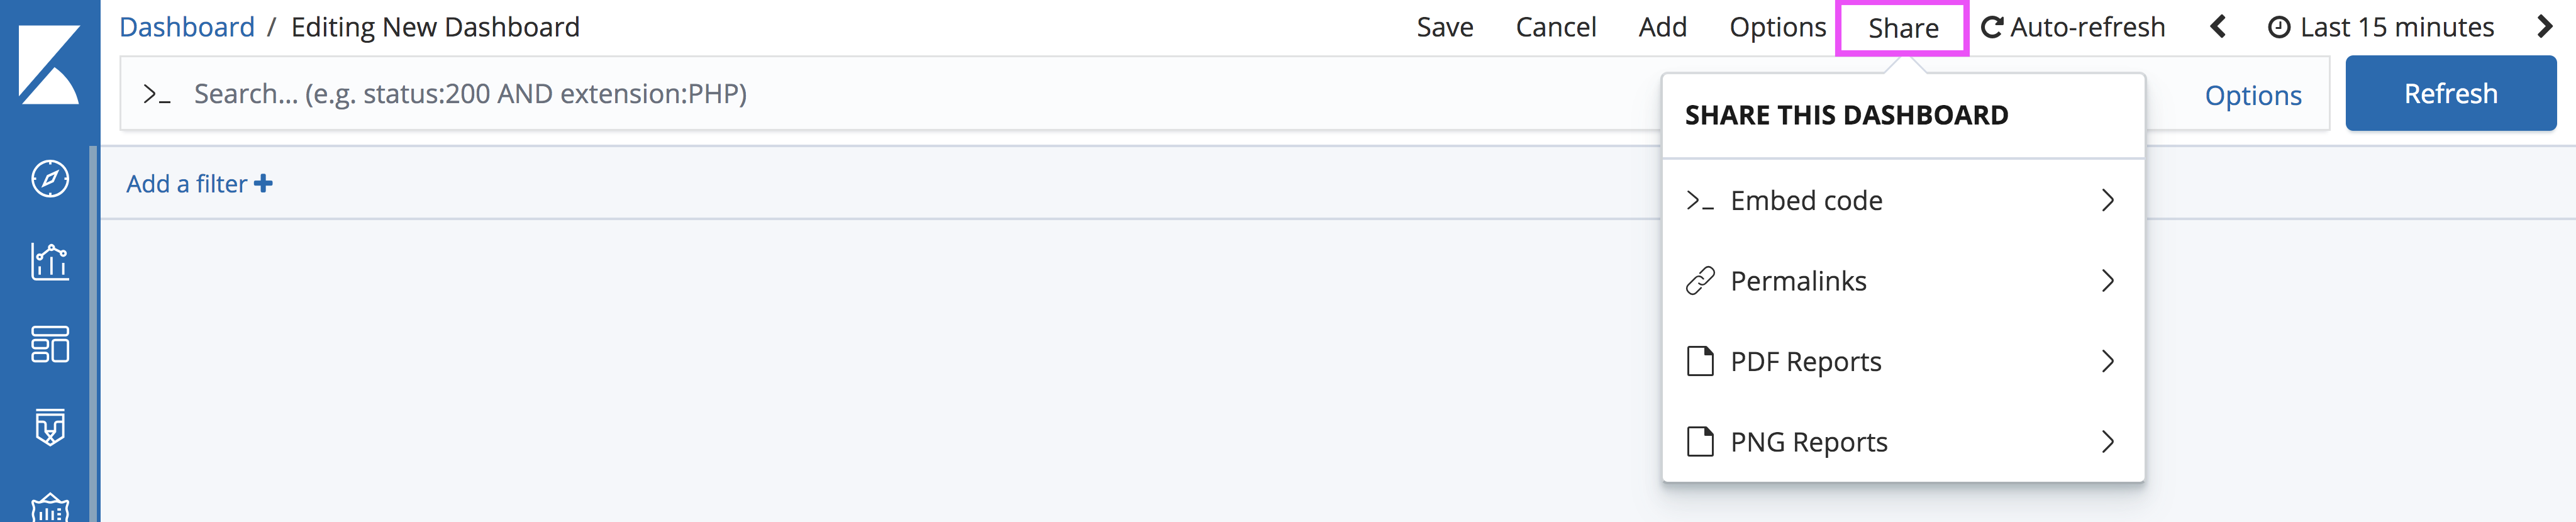
Click Share in the Kibana toolbar:
-
Depending on the Kibana application, choose the appropriate options:
-
If you’re on Discover:
- Select CSV Reports
- Click the Generate CSV button.
-
If you’re on Visualize or Dashboard:
- Select PDF Reports
- Choose to enable Optimize for printing layout mode. For an explanation of the different layout modes, see PDF Layout Modes.
- Click the Generate PDF button.
-

Generating a Report Automatically
editIf you want to automatically generate reports from a script or with Watcher, see Automating Report Generation