Profiling a more complicated query
editProfiling a more complicated query
editTo understand how the query trees are displayed inside the Search Profiler, let’s look at a more complicated query.
-
Index the following data:
POST test/test/_bulk {"index":{}} {"name":"aaron","age":23,"hair":"brown"} {"index":{}} {"name":"sue","age":19,"hair":"red"} {"index":{}} {"name":"sally","age":19,"hair":"blonde"} {"index":{}} {"name":"george","age":19,"hair":"blonde"} {"index":{}} {"name":"fred","age":69,"hair":"blonde"} -
Enter "test" in the Index filter above the query editor (the input box with a grayed-out
_all). This restricts profiled queries to thetestindex.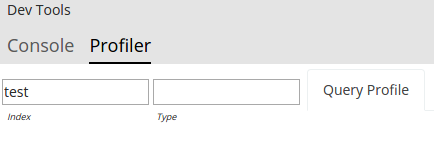
-
Replace the default
match_allquery with a query that has two sub-query components and includes a simple aggregation. For example, copy and paste the following query into the query editor.{ "query": { "bool": { "should": [ { "match": { "name": "fred" } }, { "terms": { "name": [ "sue", "sally" ] } } ] } }, "aggs": { "stats": { "stats": { "field": "price" } } } } -
Click Profile to profile the query and visualize the results.
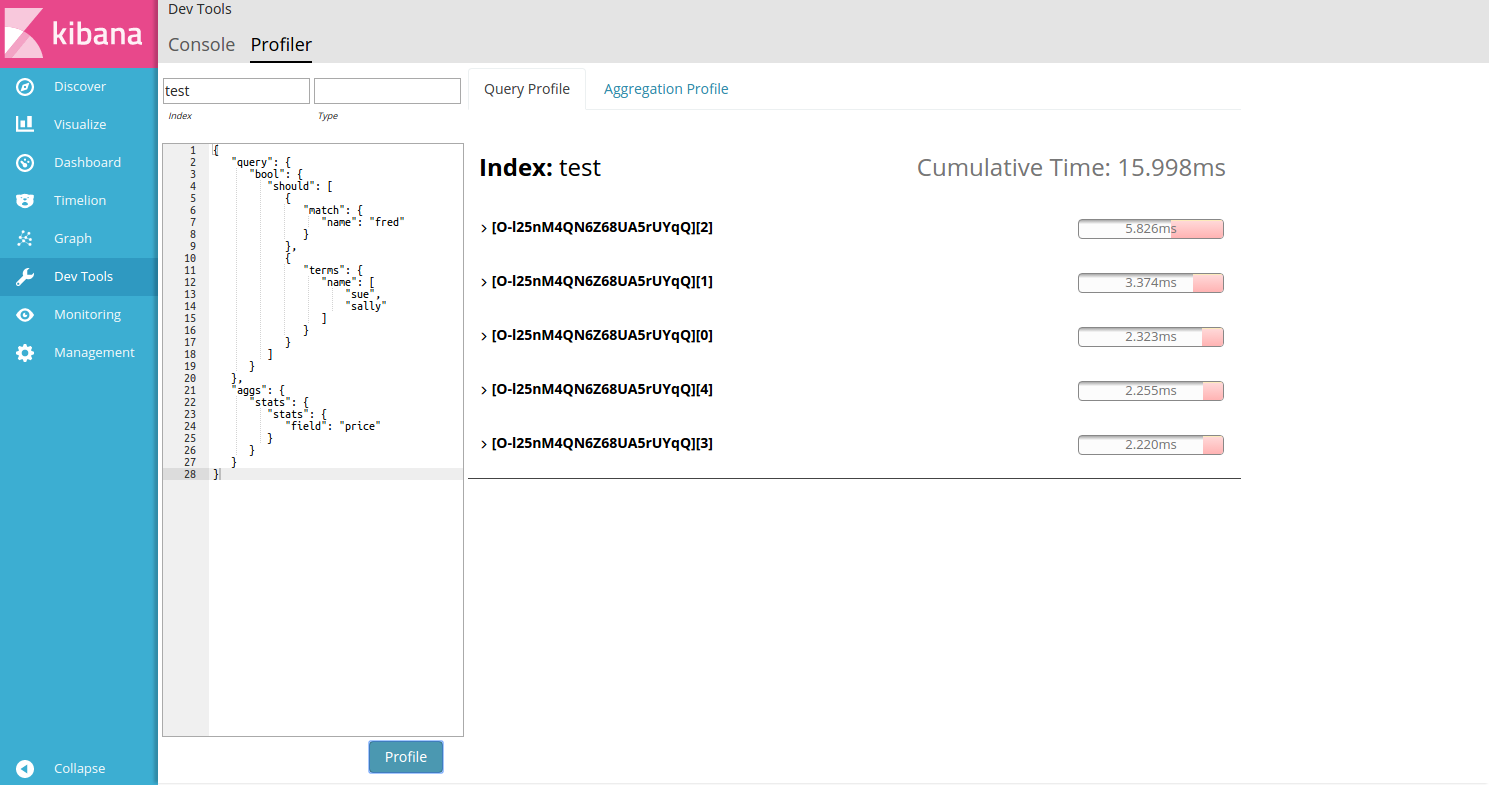
As before, you’ll see a list of shards appear in the center panel. You’ll notice that the query was slightly slower (15ms vs 0.13ms) because it actually had to do a bit of work this time, unlike the
match_allquery. -
Click the first shard’s Expand button to view the query details.
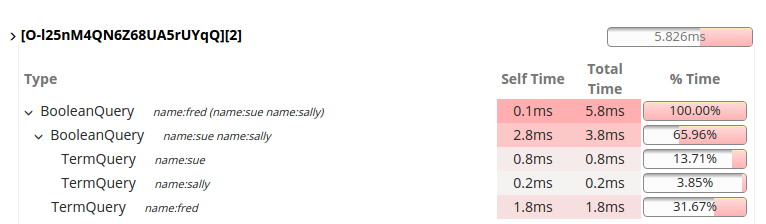
You’ll notice several interesting things in the results. The shard details contain a row for each query component:
-
The top-level
BooleanQuerycomponent corresponds to the bool in the query. -
The second
BooleanQuerycorresponds to the terms query, which is internally converted to aBooleanof should clauses. It has two child queries that correspond to "sue" and "sally" from the terms query. -
The
TermQuerythat’s labeled with "name:fred" corresponds to match: fred in the query.
If you look at the timings, you can see that "Self Time" and "Total Time" are no longer identical on all the rows. Self time represents how long the query component took to execute. Total time is the time a query component and all its children took to execute. Therefore, queries like the Boolean queries often have larger Total than Self.
In particular, you can see that the BooleanQuery for "name:sue name:sally" took 3.8ms total,
but 2.8ms of that was "self" time. That means 2.8ms was spent by the BooleanQuery itself, processing
the should clauses
Aggregations
editThis particular query also includes a aggregation (a stats agg on the "age" field).
To view Aggregation profiling statistics, click the Aggregation Profile tab. This tab
is only enabled if the query being profiled contains an aggregation.
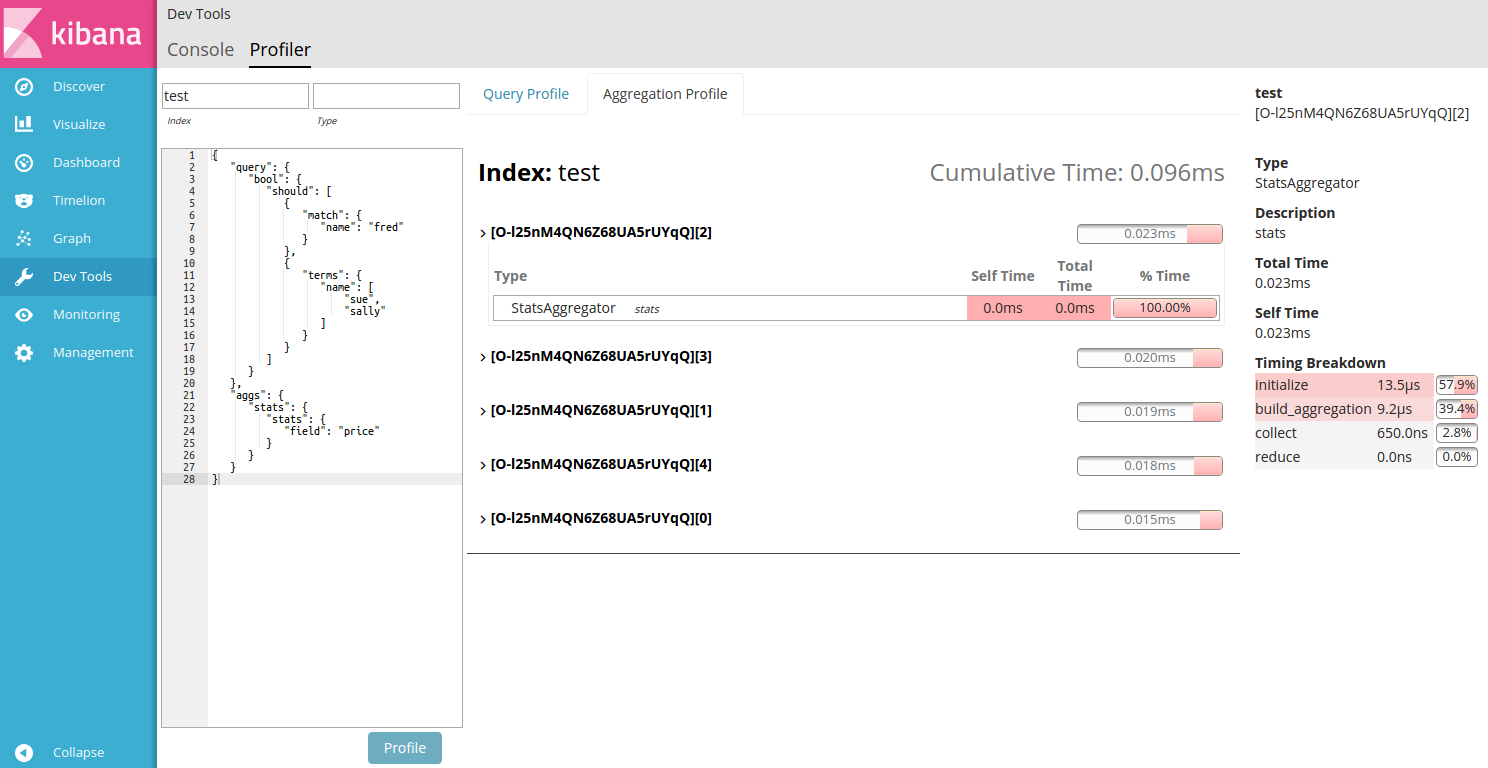
Click a shard’s Expand button to view the aggregation details. Hover over an aggregation row to view the timing breakdown.
For more information about how the Search Profiler works, how timings are calculated, and how to interpret various results, see Profiling queries.