Collecting Kibana monitoring data with Metricbeat
editCollecting Kibana monitoring data with Metricbeat
editThis functionality is in beta and is subject to change. The design and code is less mature than official GA features and is being provided as-is with no warranties. Beta features are not subject to the support SLA of official GA features.
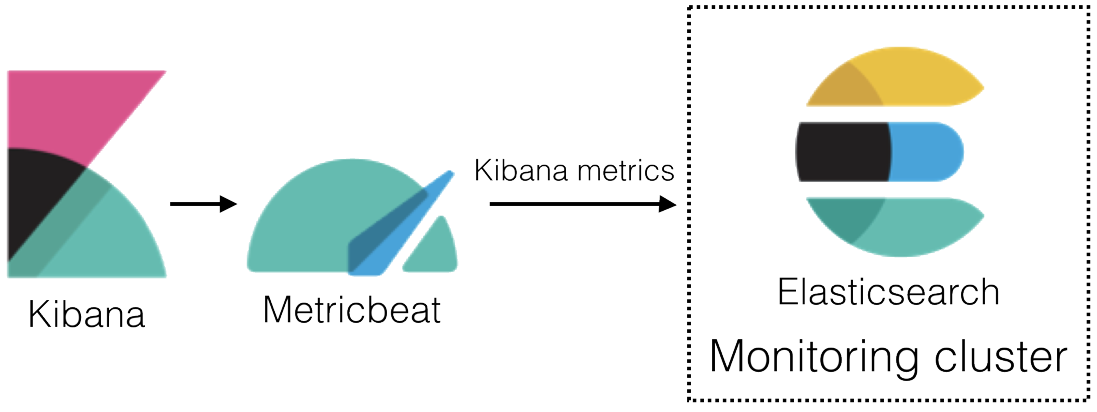
In 6.4 and later, you can use Metricbeat to collect data about Kibana and ship it to the monitoring cluster, rather than routing it through the production cluster as described in Collecting monitoring data.
To learn about monitoring in general, see Monitoring the Elastic Stack.
-
Disable the default collection of Kibana monitoring metrics.
Add the following setting in the Kibana configuration file (
kibana.yml):xpack.monitoring.kibana.collection.enabled: false
Leave the
xpack.monitoring.enabledset to its default value (true).For more information, see Monitoring settings in Kibana.
- Start Kibana.
-
Set the
xpack.monitoring.collection.enabledsetting totrueon each node in the production cluster. By default, it is disabled (false).You can specify this setting in either the
elasticsearch.ymlon each node or across the cluster as a dynamic cluster setting. If Elasticsearch security features are enabled, you must havemonitorcluster privileges to view the cluster settings andmanagecluster privileges to change them.-
In Kibana:
-
Open Kibana in your web browser.
If you are running Kibana locally, go to
http://localhost:5601/.If the Elastic security features are enabled, log in.
- In the side navigation, click Monitoring. If data collection is disabled, you are prompted to turn it on.
-
-
From the Console or command line, set
xpack.monitoring.collection.enabledtotrueon the production cluster.For example, you can use the following APIs to review and change this setting:
GET _cluster/settings

PUT _cluster/settings
{
  "persistent": {
    "xpack.monitoring.collection.enabled": true
  }
}
For more information, see Monitoring settings in Elasticsearch and Cluster update settings.
-
- Install Metricbeat on the same server as Kibana.
-
Enable the Kibana module in Metricbeat.
For example, to enable the default configuration in the
modules.ddirectory, run the following command:metricbeat modules enable kibana
For more information, see Specify which modules to run and Kibana module.
-
Configure the Kibana module in Metricbeat.
You must specify the following settings in the
modules.d/kibana.ymlfile:- module: kibana metricsets: - stats period: 10s hosts: ["http://localhost:5601"] xpack.enabled: trueThis setting identifies the host and port number that are used to access Kibana.
This setting ensures that Kibana can read the monitoring data successfully. That is to say, it’s stored in the same location and format as monitoring data that is sent by exporters.
-
If the Elastic security features are enabled, you must also provide a user ID and password so that Metricbeat can collect metrics successfully.
-
Create a user on the production cluster that has the
remote_monitoring_collectorbuilt-in role. Alternatively, use theremote_monitoring_userbuilt-in user.-
Add the
usernameandpasswordsettings to the Kibana module configuration file.For example, add the following settings in the
modules.d/kibana.ymlfile:- module: kibana ... username: remote_monitoring_user password: YOUR_PASSWORD
-
-
-
If you configured Kibana to use encrypted communications,
you must access it via HTTPS. For example, use a
hostssetting likehttps://localhost:5601in themodules.d/kibana.ymlfile. -
Identify where to send the monitoring data.
In production environments, we strongly recommend using a separate cluster (referred to as the monitoring cluster) to store the data. Using a separate monitoring cluster prevents production cluster outages from impacting your ability to access your monitoring data. It also prevents monitoring activities from impacting the performance of your production cluster.
For example, specify the Elasticsearch output information in the Metricbeat configuration file (
metricbeat.yml):For more information about these configuration options, see Configure the Elasticsearch output.
-
If the Elasticsearch security features are enabled on the monitoring cluster, you must provide a valid user ID and password so that Metricbeat can send metrics successfully.
-
Create a user on the monitoring cluster that has the
remote_monitoring_agentbuilt-in role. Alternatively, use theremote_monitoring_userbuilt-in user.-
Add the
usernameandpasswordsettings to the Elasticsearch output information in the Metricbeat configuration file (metricbeat.yml):output.elasticsearch: ... username: remote_monitoring_user password: YOUR_PASSWORD
-
-
-
If you configured the monitoring cluster to use
encrypted communications, you must access it via
HTTPS. For example, use a
hostssetting likehttps://es-mon-1:9200in themetricbeat.ymlfile. - Start Metricbeat.
- View the monitoring data in Kibana.