Monitoring Kibana with Metricbeat
editMonitoring Kibana with Metricbeat
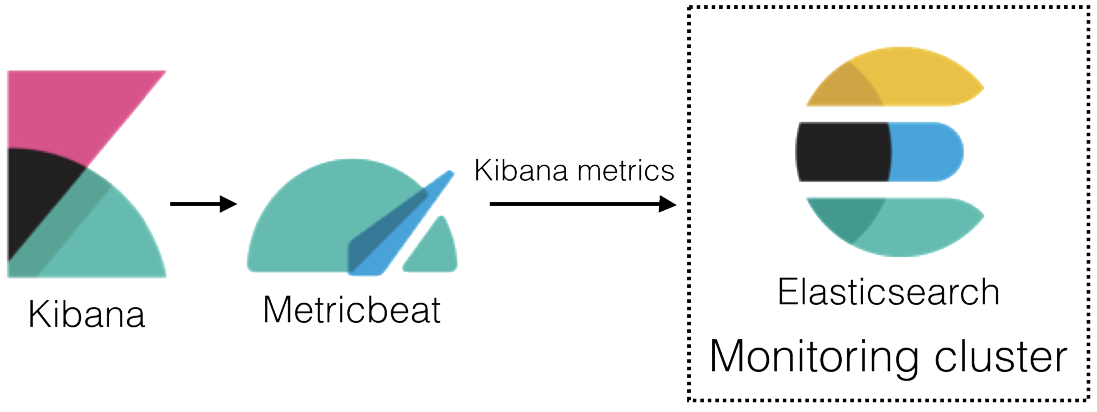
edit[beta] This functionality is in beta and is subject to change. The design and code is less mature than official GA features and is being provided as-is with no warranties. Beta features are not subject to the support SLA of official GA features. In 6.4 and later, you can use Metricbeat to collect data about Kibana and ship it to the monitoring cluster, rather than routing it through the production cluster as described in Configuring monitoring.
To learn about monitoring in general, see Monitoring the Elastic Stack.
-
Enable the collection of monitoring data. Set
xpack.monitoring.collection.enabledtotrueon the production cluster.For example, you can use the following APIs to review and change this setting:
GET _cluster/settings

PUT _cluster/settings
{
  "persistent": {
    "xpack.monitoring.collection.enabled": true
  }
}
For more information, see Monitoring settings in Elasticsearch and Cluster update settings.
-
Disable the default collection of Kibana monitoring metrics.
Add the following setting in the Kibana configuration file (
kibana.yml):xpack.monitoring.kibana.collection.enabled: false
Leave the
xpack.monitoring.enabledset to its default value (true).For more information, see Monitoring settings in Kibana.
- Install Metricbeat on the same server as Kibana.
-
Enable the Kibana module in Metricbeat.
For example, to enable the default configuration in the
modules.ddirectory, run the following command:metricbeat modules enable kibana
For more information, see Specify which modules to run and Kibana module.
-
Configure the Kibana module in Metricbeat.
You must specify the following settings in the
modules.d/kibana.ymlfile:- module: kibana metricsets: - stats period: 10s hosts: ["http://localhost:5601"] xpack.enabled: trueIf you configured Kibana to use encrypted communications, you must access it via HTTPS. For example,
https://localhost:5601. -
Identify where to send the monitoring data.
In production environments, we strongly recommend using a separate cluster (referred to as the monitoring cluster) to store the data. Using a separate monitoring cluster prevents production cluster outages from impacting your ability to access your monitoring data. It also prevents monitoring activities from impacting the performance of your production cluster.
For example, specify the Elasticsearch output information in the Metricbeat configuration file (
metricbeat.yml):If you configured the monitoring cluster to use encrypted communications, you must access it via HTTPS. For example,
https://es-mon-1:9200.For more information about these configuration options, see Configure the Elasticsearch output.
- Start Kibana.
- Start Metricbeat.
- View the monitoring data in Kibana.