WARNING: Version 6.2 of Kibana has passed its EOL date.
This documentation is no longer being maintained and may be removed. If you are running this version, we strongly advise you to upgrade. For the latest information, see the current release documentation.
Putting it Together in a Dashboard
editPutting it Together in a Dashboard
editA dashboard is a collection of visualizations that you can arrange and share. Here you’ll build a dashboard that contains the visualizations you saved during this tutorial.
- Open Dashboard.
- Click Create new dashboard.
- Click Add.
- Click Bar Example, Map Example, Markdown Example, and Pie Example.
Your sample dashboard look like this:
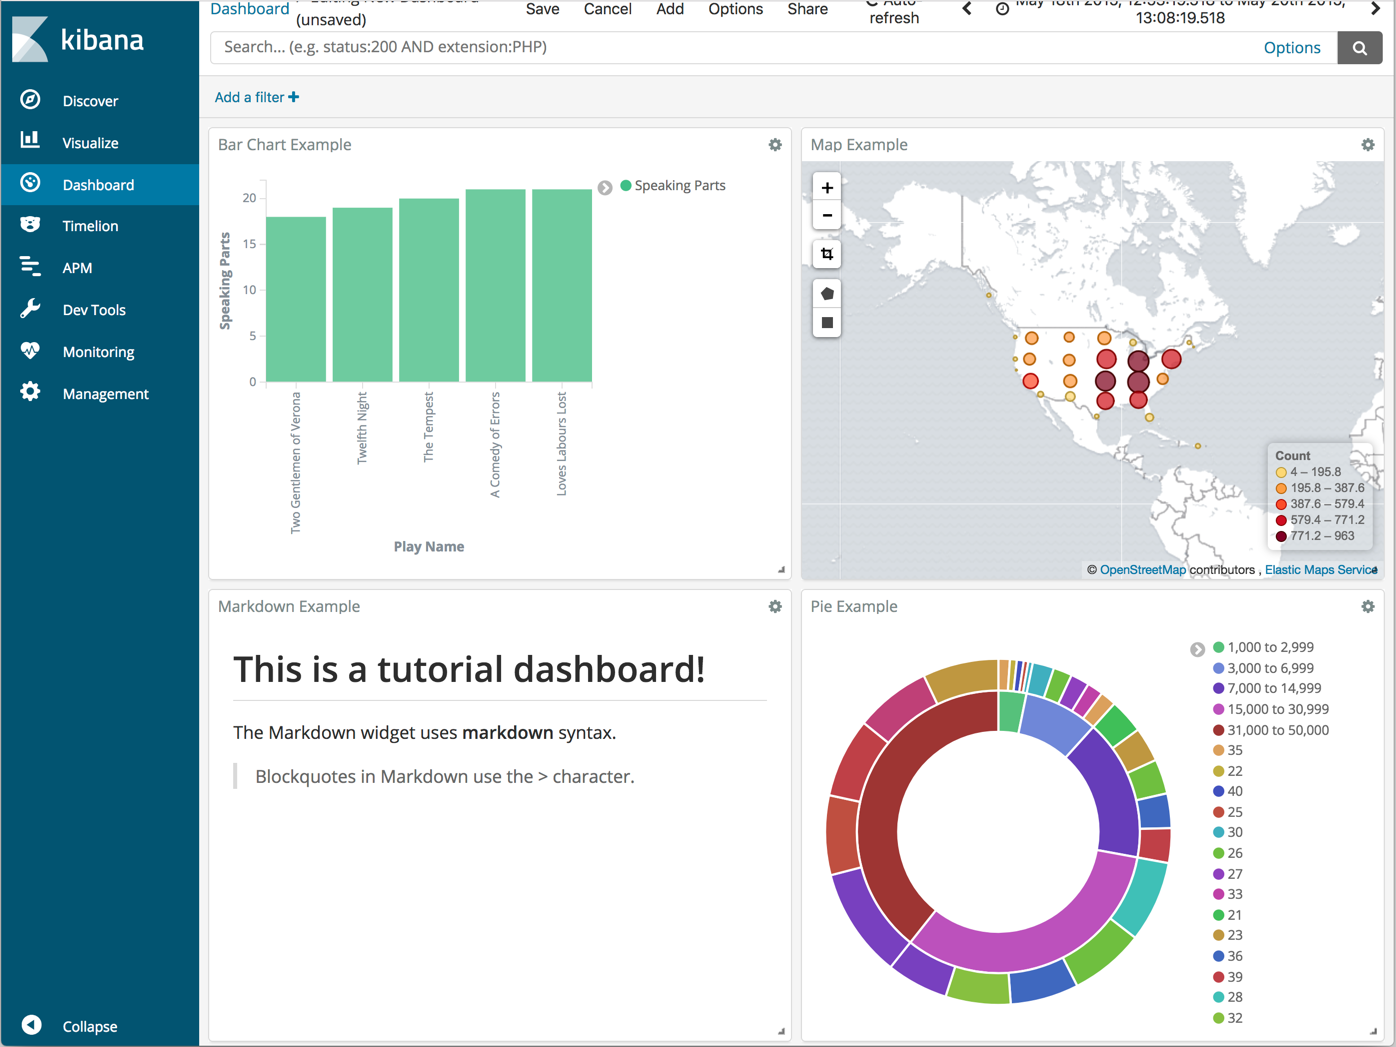
You can rearrange the visualizations by clicking a the header of a visualization and dragging. The gear icon in the top right of a visualization displays controls for editing and deleting the visualization. A resize control is on the lower right.
To get a link to share or HTML code to embed the dashboard in a web page, save the dashboard and click Share.
Save your dashboard.