WARNING: Version 6.0 of Kibana has passed its EOL date.
This documentation is no longer being maintained and may be removed. If you are running this version, we strongly advise you to upgrade. For the latest information, see the current release documentation.
Building a Dashboard
editBuilding a Dashboard
editTo build a dashboard:
-
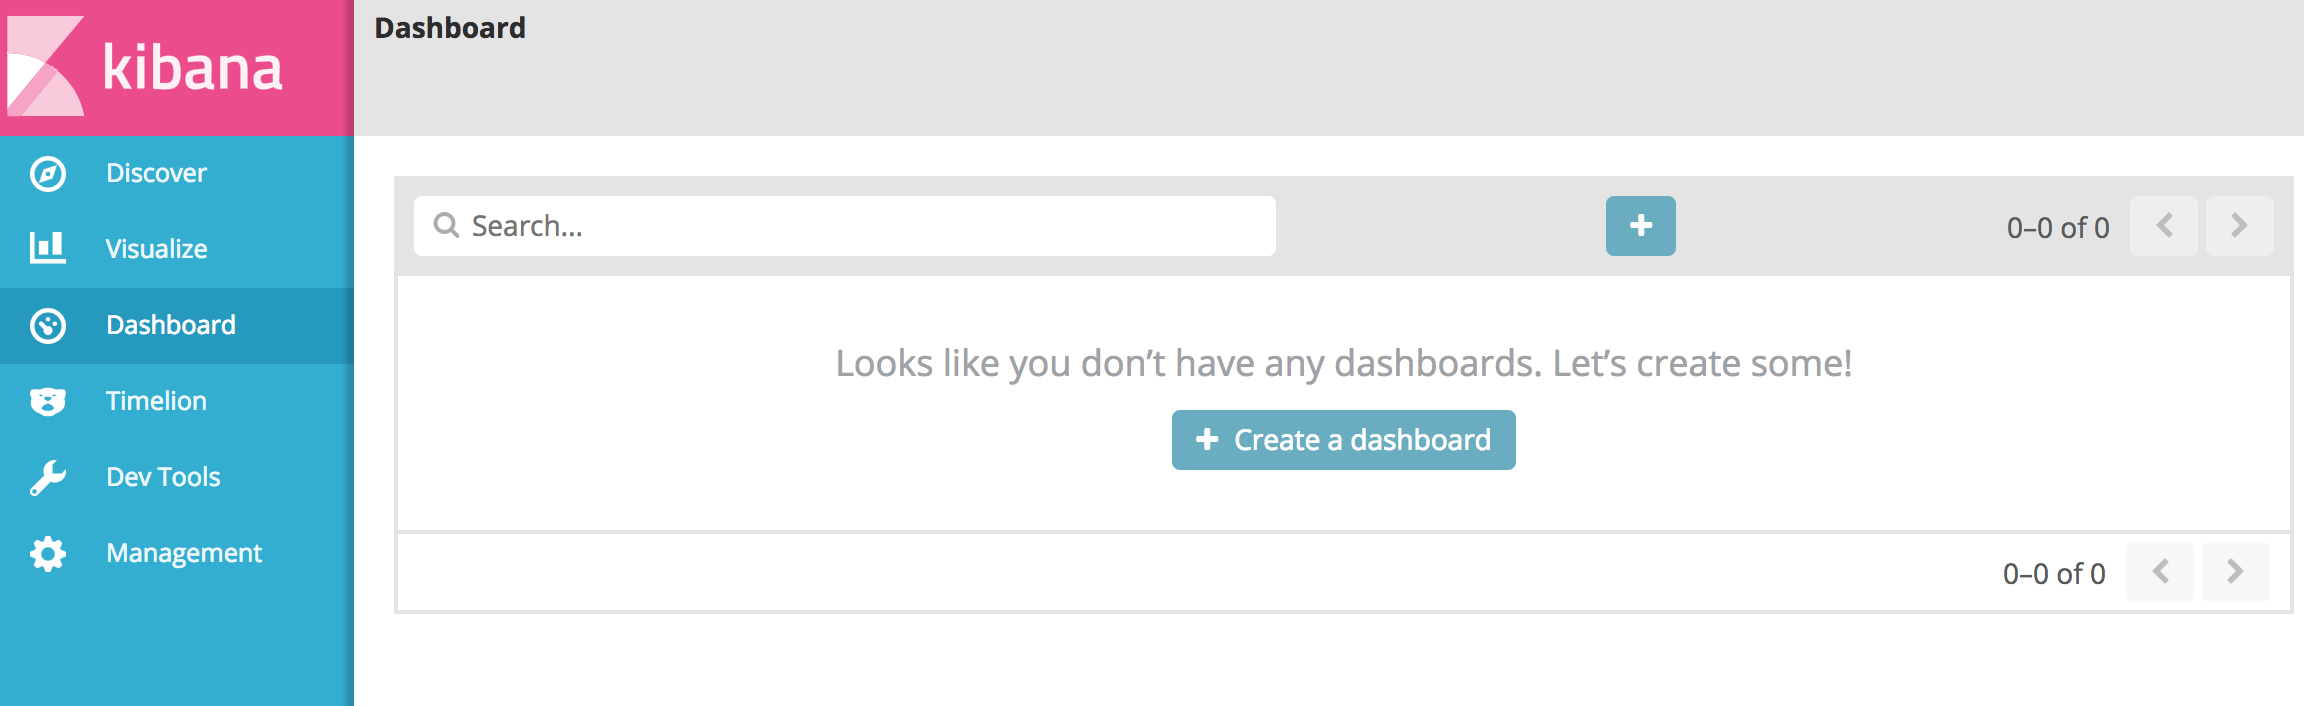
Click Dashboard in the side navigation. If you haven’t previously viewed a dashboard, Kibana displays a landing page where you can click +. Otherwise, click the Dashboard breadcrumb to navigate back to the landing page.
-
To add a visualization to the dashboard, click Edit mode. Brand new dashboards will be in Edit mode automatically.
-
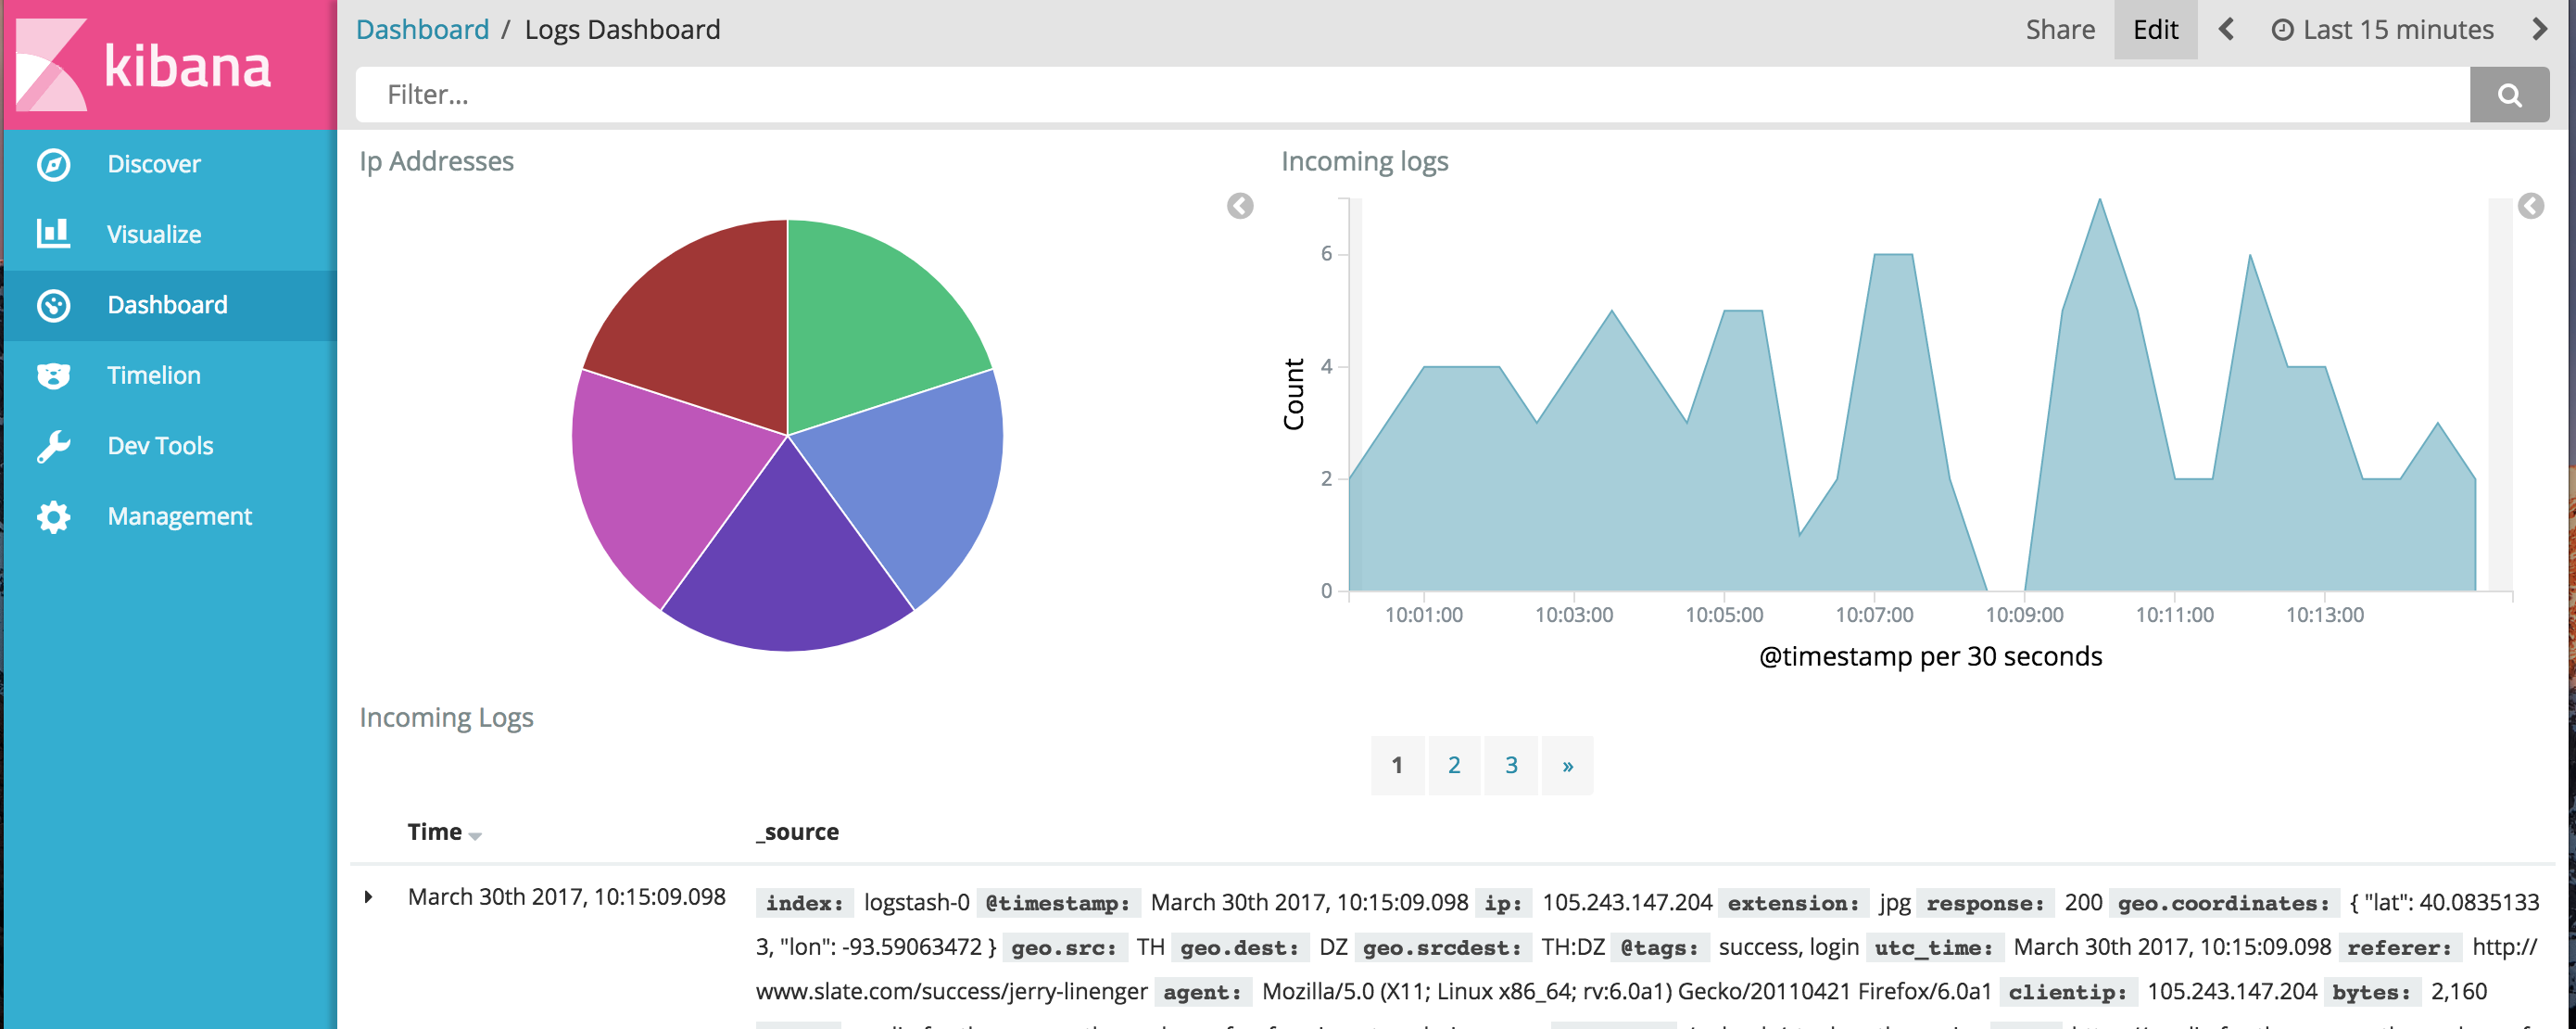
Once in Edit mode, click Add and select the visualization. If you have a large number of visualizations, you can enter a Filter string to filter the list.
Kibana displays the selected visualization in a container on the dashboard. If you see a message that the container is too small, you can resize the visualization.
By default, Kibana dashboards use a light color theme. To use a dark color theme, click Options and select Use dark theme. To change the default theme, go to Management/Kibana/Advanced Settings and set
dashboard:defaultDarkThemetotrue.
-
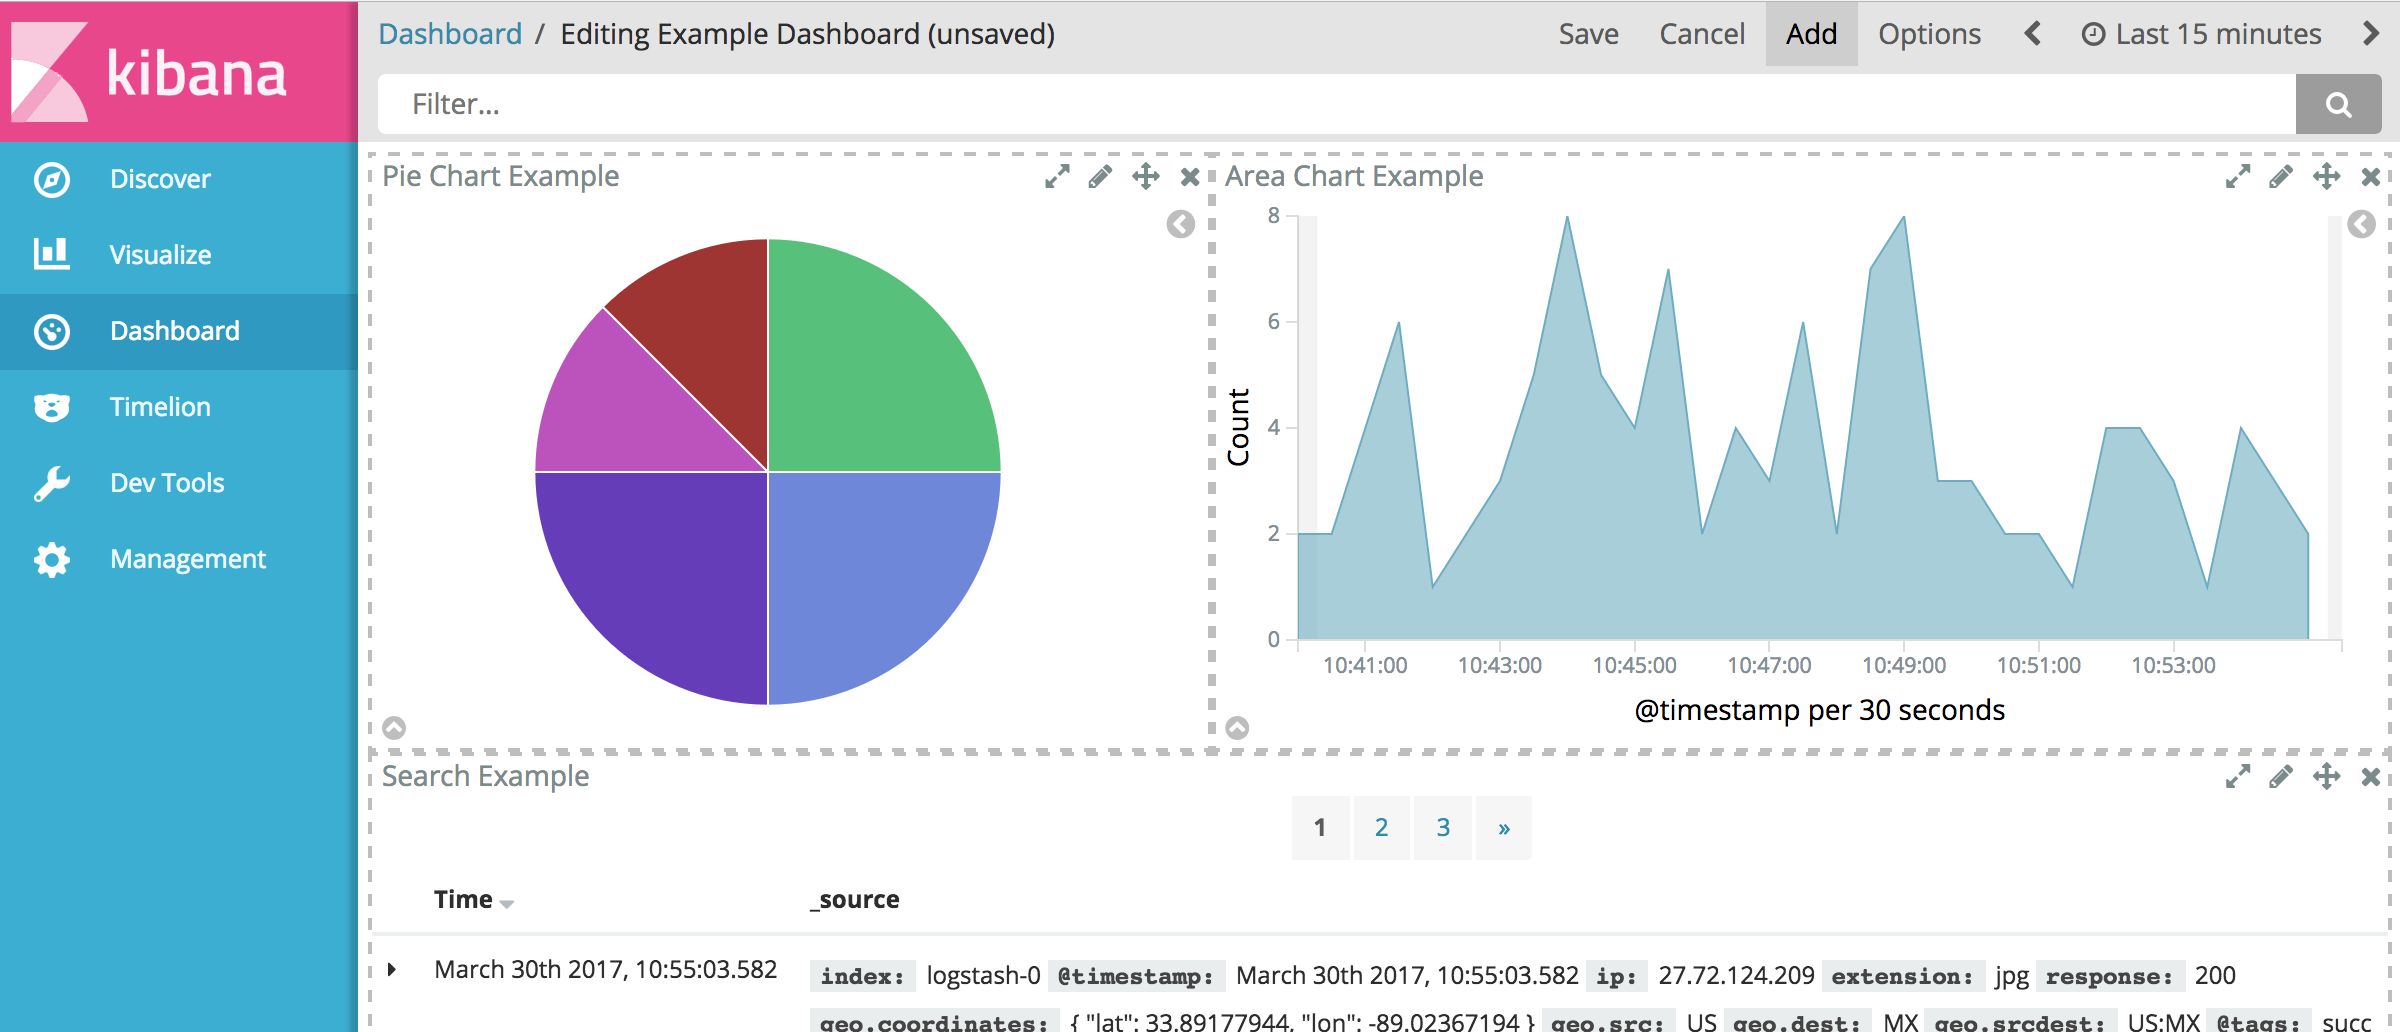
When you’re done adding and arranging visualizations, click Save to save the dashboard:
- Enter a name for the dashboard.
- To store the time period specified in the time filter with the dashboard, select Store time with dashboard.
- Click the Save button to store it as a Kibana saved object.
Arranging Dashboard Elements
editIn Edit Mode, visualizations in your dashboard are stored in resizable, moveable containers.
Moving Visualizations
editTo reposition a visualization:
- Hover over it to display the container controls.
- Click and hold the Move button in the upper right corner of the container.
- Drag the container to its new position.
- Release the Move button.
Resizing Visualizations
editTo resize a visualization:
- Hover over it to display the container controls.
- Click and hold the Resize button in the bottom right corner of the container.
- Drag to change the dimensions of the container.
- Release the Resize button.
Removing Visualizations
editTo remove a visualization from the dashboard:
- Hover over it to display the container controls.
-
Click the Delete button in the upper right corner of the container.
Removing a visualization from a dashboard does not delete the saved visualization.
Viewing Visualization Data
editTo display the raw data behind a visualization:
- Hover over it to display the container controls.
-
Click the Expand button in the lower left corner of the container. This displays a table that contains the underlying data. You can also view the raw Elasticsearch request and response in JSON and the request statistics. The request statistics show the query duration, request duration, total number of matching records, and the index (or index pattern) that was searched.
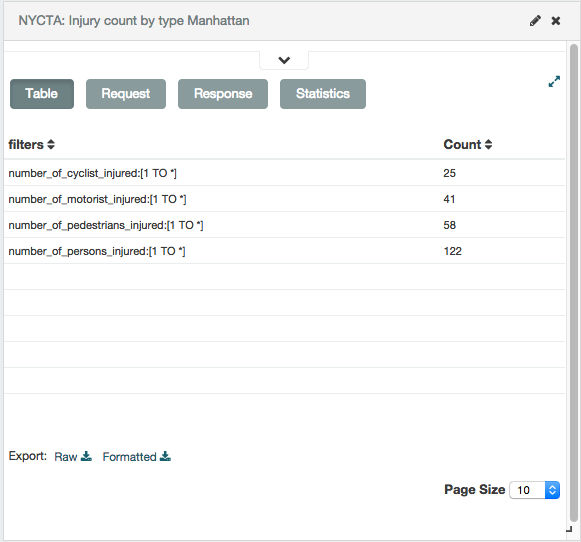
To export the data behind the visualization as a comma-separated-values (CSV) file, click the Raw or Formatted link at the bottom of the data Table. Raw exports the data as it is stored in Elasticsearch. Formatted exports the results of any applicable Kibana field formatters.
To return to the visualization, click the Collapse button in the lower left corner of the container.
Modifying a Visualization
editTo open a visualization in the Visualization Editor:
- Enter Edit Mode.
- Hover over it to display the container controls.
- Click the Edit button in the upper right corner of the container.